


Schizophrenia remains a major cause of disability, with substantial personal and economic costs. Classically, the clinical features of schizophrenia are divided into positive symptoms and negative symptoms. Despite the clinical presentation being a mixture of both domains, it is the positive symptoms of the disorder which largely form the basis of the operationalised diagnostic criteria for schizophrenia, 1,2 which show a response to antipsychotic medication Reference Davis, Schaffer, Killian, Kinard and Chan3 and which have proven most tractable to research regarding their pathophysiology. Reference Harrison4,Reference Siever and Davis5 However, the negative symptoms of schizophrenia are arguably more disabling Reference Katschnig6 and as yet there is no form of treatment which can be recommended as reliably relieving them. Reference Hanson, Healey, Wolf and Kohler7 Advances in the development of new treatments for negative symptoms are hampered by a lack of understanding of their pathophysiology. A primary reason for this is that negative symptoms tend to be identified later rather than earlier in the course of schizophrenia Reference Pfohl and Winokur8 making it unusual for them to be ratable in a situation uncontaminated by confounding factors. Reference Carpenter, Heinrichs and Alphs9 Principal among these confounders is antipsychotic medication – it has long been known that negative features may be difficult to distinguish from antipsychotic-induced akinesia. Reference Quitkin, Rifkin and Klein10 Other features associated with long-term psychotic illnesses, such as depression, Reference Andreasen11 institutionalisation Reference Wing and Brown12 and social isolation, Reference Harding, Brooks, Ashikaga, Strauss and Breier13 also complicate the clinical picture in those with long-standing illness.
In the Department of Psychiatry in Edinburgh we have focused on the development of psychotic illness and as such have examined populations at enhanced risk of schizophrenia. First, we studied people where enhanced risk was familial, Reference Johnstone, Ebmeier, Miller, Owens and Lawrie14 where we saw very little in terms of negative symptoms but this was not unexpected given the aims of the sample. We have gone on to examine individuals at enhanced risk for cognitive reasons Reference Johnstone, Owens, Hoare, Gaur, Spencer and Harris15,Reference Moorhead, Stanfield, McKechanie, Dauvermann, Johnstone and Lawrie16 and this is the sample used here. It is established that in people who are cognitively impaired, the risk of psychosis is higher, Reference Morgan, Leonard, Bourke and Jablensky17 the onset earlier Reference Meadows, Turner, Campbell, Lewis, Reveley and Murray18 and that negative symptoms are more marked, Reference Bouras, Martin, Leese, Vanstraelen, Holt and Thomas19 meaning that the current sample is particularly suitable for their longitudinal investigation in the absence of the confounding factors associated with chronic illness. A number of cross-sectional studies have previously reported associations between negative symptoms in schizophrenia and tissue loss, in particular grey matter tissue loss bilaterally in the insula, superior temporal gyrus and amygdala/hippocampus; as well as the left superior temporal gyrus, medial temporal gyrus and occipital gyrus. Reference Anderson, Wible, McCarley, Jakab, Kasai and Shenton20–Reference Cascella, Fieldstone, Rao, Pearlson, Sawa and Schretlen22 Conversely, other studies have reported decreased tissue loss associated with negative symptoms. Reference Galderisi, Quarantelli, Volpe, Mucci, Cassano and Invernizzi23,Reference Volpe, Mucci, Quarantelli, Galderisi and Maj24 However, the assessment of negative symptoms in these studies is potentially confounded by the factors mentioned above. Therefore, the ability to assess negative symptoms repeatedly and in conjunction with serial scans in a substantial population, largely free from antipsychotic medication and at a much earlier age than in most other studies, allows us the unusual opportunity to examine the correlates of negative symptoms developing over time in this at-risk population.
Method
Recruitment
A full description of the recruitment and design of the Edinburgh Study of Comorbidity (from which this sample comes) is published elsewhere. Reference Johnstone, Owens, Hoare, Gaur, Spencer and Harris15 In brief, local education authorities in Scotland were approached for permission to approach individual schools. Of the 19 authorities approached, 18 granted permission. A total of 243 schools across Scotland were subsequently approached and pupils receiving special educational assistance estimated to be functioning at a level consistent with borderline to mild intellectual disability were approached. After exclusions, 394 participants were recruited to undergo further study. After screening the group with the Childhood Behaviour Checklist Reference Achenbach25 and the Structured Interview for Schizotypy, Reference Kendler, Lieberman and Walsh26 and sampling the group based on these scores to enrich the cohort for participants with higher scores on these measures, 168 were recruited for the baseline magnetic resonance imaging (MRI) assessment (mean age 15.7 years). Of these, 120 consented to be re-contacted for a follow-up scan 6 years later. At follow-up, we successfully re-contacted 105 families of whom 55 agreed to participate in our follow-up imaging.
Clinical assessment
The Clinical Interview Scale (CIS) Reference Goldberg, Cooper, Eastwood, Kedward and Shepherd27,Reference Krawiecka, Goldberg and Vaughan28 was used at each of the assessments, with the examinations being conducted by the same raters on each occasion. In addition, the participants were assessed on the Positive and Negative Syndrome Scale (PANSS) Reference Kay, Fiszbein and Opler29 rated on the basis of this interview.
Using previously defined thresholds, Reference Moorhead, Stanfield, McKechanie, Dauvermann, Johnstone and Lawrie16 the participants were divided into two groups using the scores in the negative symptoms subscale of the PANSS representing the presence or absence of morbid negative symptoms in this population. Individuals were allocated to the negative symptoms group if they had a score of 3 or above on any of the items of the negative subscale at either time-point, with the exception of concrete thinking and lack of spontaneity and flow of conversation. Most participants scored above a 1 on these items by virtue of their intellectual impairment, therefore we considered a score of 4 to represent definite morbidity. However, none of the participants was allocated to the negative symptoms group solely on the basis of their scores in either concrete thinking or lack of spontaneity and flow of conversation. All but six participants provided DNA samples to exclude diagnoses of Down syndrome, fragile-X syndrome or velocardiofacial syndrome.
Image acquisition and pre-processing
The MRI data were collected using a 1.5T GE Signa Horizon HDX (General Electric, Milwaukee, Wisconsin, USA). Following midline sagittal localisation, the whole brain was imaged by two further sequences: a transverse spin-echo scan acquiring both T2- and proton density-weighted images; and a coronal gradient echo sequence acquiring 128 high resolution coronal T1-weighted images for structural image analysis (time of inversion = 600 ms, echo time = 3.4 ms, flip angle = 15°, field of view = 220 mm, slice thickness = 1.7 mm, matrix = 256 × 192).
The images were converted to ANALYZE 3D format and each image was examined for orientation and movement artefacts. The images were analysed in Statistical Parametric Mapping (SPM) version 5 (www.fil.ion.ucl.ac.uk) running in MATLAB version 7.3 (The MathWorks, Natick, Massachusetts, USA). The images were pre-processed using the SPM toolset before implementing the staged tensor-based morphometry (TBM) protocol Reference Kipps, Duggins, Mahant, Gomes, Ashburner and McCusker30–Reference Whitford, Grieve, Farrow, Gomes, Brennan and Harris33 to evaluate the grey matter tissue changes between the scans. For all scan acquisitions in this study we employed the same scanner, the same sequence and the same head coil. Nine participants were excluded from further analysis because of excess movement in the scans.
TBM analysis
The TBM protocol was implemented by following a staged procedure Reference Moorhead, McKirdy, Sussmann, Hall, Lawrie and Johnstone31,Reference Moorhead, Stanfield, Spencer, Hall, McIntosh and Owens32 and this was based on the established voxel-wise TBM methodology. Reference Kipps, Duggins, Mahant, Gomes, Ashburner and McCusker30,Reference Whitford, Grieve, Farrow, Gomes, Brennan and Harris33 The TBM method is susceptible to participant movement during scan time. As a result of this susceptibility, we were not able to use the paired scans from eight of the participants. Also, one participant did not complete the scan sequence. For each of the participants we recovered grey matter difference images in Montreal Neurological Institute (MNI) space from the TBM protocol.
The TBM grey matter difference images were smoothed with a 12-mm full width half maximum filter and compared in SPM using the general linear model (GLM). Comparisons were made between those with threshold negative symptoms and those without such features. Age, inter-scan time interval, gender, full scale IQ and PANSS positive symptom score were included in the model as covariates. The SPM t-contrast was initially thresholded at t = 3.00 (uncorrected) but we report results only where the cluster significance corrected for multiple comparisons was P<0.05. Removal of the covariates from the SPM cluster analysis increased the extent of the reported clusters and established that our analyses including covariates were conservative. The TBM–VBM whole-brain analysis was implemented in MNI standard space and the voxel coordinates of the results are presented in the same. The anatomical designations were taken from established atlases. Reference Duvernoy34,Reference Talairach and Tournoux35
Extracted values for whole brain grey matter volume were also compared to establish whether there was a relationship between change in volume and symptom states over time.
Results
Description of participants
Of the 55 participants scanned at baseline and 6-year follow-up, 46 had paired scans of sufficient quality to allow for the TBM analysis. Three further participants were excluded, as their lack of communication at baseline did not make it possible to make an assessment of negative symptomatology. Of these 43 participants, there were 13 females and 30 males, of mean age 15.6 years (s.d. = 1.8) at baseline and 21.6 years (s.d. = 1.8) at follow-up, and a mean IQ of 79.6. All participants either lived in their own home or in the family home at the time of the study. Of the participants, 5 were in further education, 4 in voluntary employment and 20 in paid employment, with the remainder being unemployed.
Table 1 shows the participants' characteristics as divided into the two clinical groupings. In general, the population was naive to psychotropic medication but two of them were on antipsychotic medication: one who had developed operationally defined schizophrenia since the beginning of the study and who was on depot flupentixol, lamotrigine and fluoxetine; the other participant was on small doses of amisulpiride and reboxetine for prominent anxiety symptoms. Both of these participants were in the negative symptoms group. A further two individuals, both in the negative symptoms-free group were taking antidepressant medication (sertraline and citalopram).
Table 1 Subject characteristics
| Negative symptoms-free group |
Negative symptoms group |
Significance | |
|---|---|---|---|
| n (male: female) a | 34 (23:11) | 9 (7:2) | 0.556 |
| Age at baseline, b years: mean (s.d.) | 15.2 (1.3) | 17.2 (2.4) | 0.009 |
| Age at follow-up, b years: mean (s.d.) | 21.1 (1.3) | 23.4 (2.4) | 0.003 |
| Full-scale IQ, b mean (s.d.) | 80.8 (15.8) | 75.0 (15.3) | 0.518 |
| PANSS positive baseline, c median (IQR) | 8 (2) | 9 (5) | 0.163 |
| PANSS negative baseline, c median (IQR) | 11 (4) | 13 (3) | 0.069 |
| PANSS general baseline, c median (IQR) | 19.5 (6) | 18 (7) | 0.976 |
| PANSS positive follow-up, c median (IQR) | 7.5 (4) | 7 (3) | 0.485 |
| PANSS negative follow-up, c median (IQR) | 9.5 (2) | 18 (10) | <0.001 |
| PANSS general follow-up, c median (IQR) | 18 (5) | 21 (9) | 0.180 |
| Baseline observed depression, c,d median (IQR) | 0(0) | 0(1) | 0.363 |
| Current alcohol units per week, c median (IQR) | 2 (10) | 1 (3) | 0.141 |
| Number who had ever used any illicit drugs e (%) | 9 (26) | 0 (0) | |
| Number currently using any illicit drug f (%) | 6 (18) | 0 (0) | |
PANSS, Positive and Negative Syndrome Scale; IQR, interquartile range.
a. χ2 test.
b. Independent t-test.
c. Mann-Whitney U-test.
d. From the Clinical Interview Scale.
e. Nine individuals had previously used cannabis, four had used amphetamines, four had used ecstasy, three had used cocaine and one had used LSD.
f. Six individuals were currently using cannabis, one was currently also using mephedrone.
At baseline, the group as a whole had a mean PANSS negative subscale score of 10.6 (s.d. = 2.6), and at follow-up a mean score of 11.8 (s.d. = 4.6). Figure 1 shows the median PANSS negative subscale scores for the two groups at both baseline and 6-year follow-up. The negative symptom scores do not differ significantly at baseline (P = 0.069), although in the negative symptoms group are significantly higher at follow-up (P<0.001). There was no significant difference in scores of observed depression on the CIS at baseline (P = 0.363).
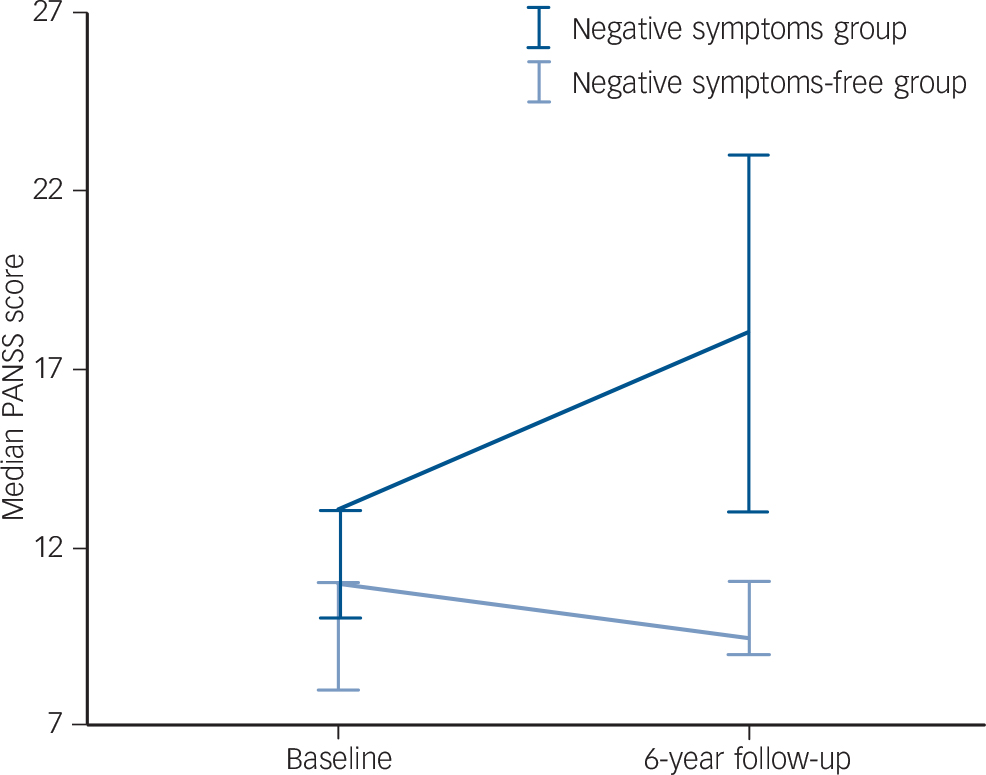
Fig. 1 Positive and Negative Syndrome Scale (PANSS) negative subscale scores at baseline and 6-year follow-up.
Error bars show 95% confidence interval.
At baseline, five participants met our threshold for negative feature pathology, of whom four had ongoing morbid negative symptoms at follow-up. In addition to these, a further four had developed threshold negative symptoms at 6-year follow-up.
TBM analysis
The whole brain TBM analysis found a number of clusters of significantly greater grey matter tissue loss between the scans at baseline and 6-year follow-up in those with negative symptoms, compared with those who had not. These clusters were in the occipital, inferior parietal and medial temporal lobes, as well as the posterior cingulate and the cerebellum. The significance levels for these clusters were calculated using the SPM non-stationary toolbox. Figure 2 shows the location and extent of these clusters. There were no regions of significantly greater tissue loss in the participants without negative symptoms when compared with the group with those symptoms. (Please note that a colour version of the figure is available in an online supplement to this paper.)

Fig. 2 (a) Cluster in the left posterior cingulate. The location of the maximal voxel for this cluster (T = 4.09) was at Montreal Neurological Institute (MNI) coordinates −14, −48, 29 at a whole brain significance of P<0.017; (b) Cluster in the left cerebellum. The significance of this cluster at the whole brain level was P<0.020. The maximal voxel location for this cluster (T = 4.73) was at MNI coordinates −18, −85, −31; (c) Cluster including the left insula, amygdala and hippocampus. The location of the maximal voxel for this cluster (T = 4.86) was at MNI coordinates −23, 0, −14 at a whole brain significance of P<0.024; (d) Cluster in the left occipatal lobe, extending forward to the left inferior parietal sulcus. The location of the maximal voxel (T = 3.92) was at MNI coordinates −25, −83, 21. This cluster's significance at a whole brain level was P<0.029; (e) Cluster in the left superior temporal gyrus, extending to the supramarginalgyrus. The location of the maximal voxel for this cluster (T = 4.47) was at MNI coordinates −46, −41, 11 at a whole brain significance of P<0.037.
When the TBM analysis was repeated after excluding the two individuals on antipsychotic medication, the left medial temporal gyrus and left cerebellum results remained significant. However, the other three results no longer remained significant. A third, new cluster in the cerebellum, however, did emerge as significant. The location of the maximal voxel for this cluster (T = 3.78) was at MNI coordinates −6, −68, −38.
Whole brain grey matter volumes
Figure 3 shows the results from our analysis of whole brain grey matter volumes over time. The differences between the groups are not significant at baseline (P = 0.881) or follow-up (P = 0.858), nor is the change over time (P = 0.591).
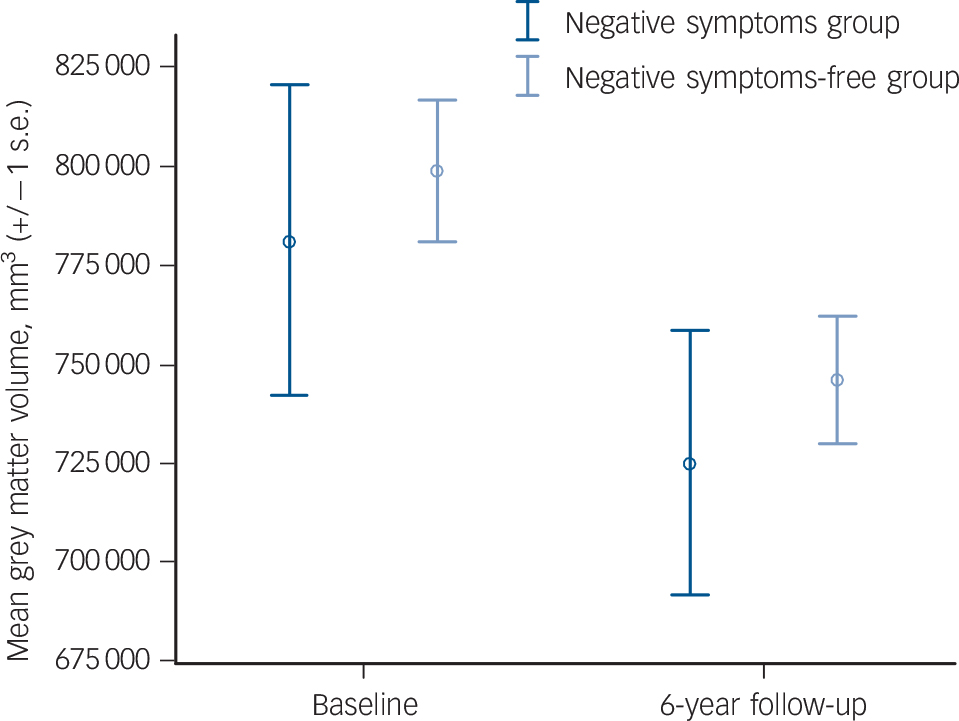
Fig. 3 Mean grey matter volumes at baseline and 6-year follow-up.
Discussion
In this study we undertook serial MRI brain scans of young individuals with intellectual limitations, scanning them at mean ages 16 and 22. Between these two time points, we found clusters of significantly greater grey matter tissue loss in the individuals with prominent negative symptoms compared with those without prominent negative symptoms. This included areas of greater tissue loss in the posterior cingulate, cerebellum, superior temporal gyrus, medial temporal lobe and occipital lobe all on the left-hand side. The groups did not differ significantly in terms of positive symptoms at either baseline or follow-up, nor were any of the participants admitted to hospital. The neuroanatomical changes over time that we report are therefore likely to relate to the presence of negative symptoms in this group and not to other confounding factors. One potential confounder is that although this group is almost completely antipsychotic naive, particularly when compared with other study populations, two of the individuals in the negative symptoms group were on antipsychotic medication. During further TBM analysis in which we excluded these individuals, two of the results remained significant and a new, significant result was found. We cannot know whether the loss of the significant results in the left superior temporal gyrus, left occipital lobe and left posterior cingulate is due to the absence of any antipsychotic medication effect or merely due to the smaller sample size, but we can be sure that the development of negative symptoms in a sample uncontaminated by antipsychotic medications is associated with tissue loss in the left cerebellum and the left medial temporal gyrus.
To our knowledge, this is the first longitudinal study in a group at high risk of psychosis due to cognitive reasons to relate structural changes to increasing negative symptom severity. Within this group, we have previously demonstrated grey matter tissue loss in the bilateral medial temporal lobes and superior temporal gyri to be associated with threshold levels of positive and negative symptoms considered together Reference Moorhead, Stanfield, McKechanie, Dauvermann, Johnstone and Lawrie16 (Table 2). The results of the current study overlap with these previous findings in relation to left medial temporal and superior temporal gyrus grey matter loss, but we also identified tissue loss in the left posterior cingulate, left cerebellum and left occipitoparietal region as uniquely associated with negative symptoms. Each of these regions has been previously reported to be associated with deficits in social cognition, which is known to be impaired in individuals with prominent negative symptoms. Reference Pantelis, Velakoulis, McGorry, Wood, Suckling and Phillips36
Table 2 Comparison of TBM correlates of negative features as reported in this study with the TBM findings in participants with all psychotic features as reported in Moorhead et al Reference Moorhead, Stanfield, McKechanie, Dauvermann, Johnstone and Lawrie16

| Region of tissue loss | All psychotic symptoms |
Negative symptoms |
|---|---|---|
| Left temporal lobe | ||
| Superior temporal gyrus | ✓ | ✓ |
| Amygdala | ✓ | ✓ |
| Insula | ✓ | ✓ |
| Hippocampus | ✓ | ✓ |
| Right temporal lobe | ||
| Superior temporal gyrus | ✓ | |
| Insula | ✓ | |
| Hippocampus | ✓ | |
| Left occipital lobe to left inferior parietal sulcus |
✓ | |
| Left posterior cingulate | ✓ | |
| Left cerebellum | ||
TBM, tensor-based morphometry.
In the current study, we reported a large region of tissue loss at 6-year follow-up in the left posterior cingulate, which is consistent with the findings of a previous cross-sectional study of individuals with schizophrenia. Reference Tanskanen, Ridler, Murray, Haapea, Veijola and Jaaskelainen37 It is possible that this finding may help the understanding of the nature of the specific deficits of negative symptoms. The posterior cingulate plays an important role in the default mode network Reference Broyd, Demanuele, Debener, Helps, James and Sonuga-Barke38 and negative symptoms have been previously reported to be correlated with decreased connectivity between the posterior cingulate and various brain regions including frontal, temporal and midbrain structures Reference Bluhm, Miller, Lanius, Osuch, Boksman and Neufeld39 as well as grey matter tissue loss in the posterior cingulate in individuals with schizotypal personality disorder. Reference Asami, Whitford, Bouix, Dickey, Niznikiewicz and Shenton40 Theory of mind activity (the ability to attribute mental states to others) has also been linked to increased activity in the posterior cingulate Reference Fletcher, Happe, Frith, Baker, Dolan and Frackowiak41 and it is, therefore, of interest that we have found significant tissue loss in this area associated with prominent negative symptoms, which have been associated with deficits in theory of mind. Reference Sprong, Schothorst, Vos, Hox and van Engeland42 Our finding suggests that this may be an area prone to tissue loss early in the course of a developing illness, and that tissue losses may be observable prior to the onset of illness and be involved in the aetiology of the disabling and treatment-refractory negative symptoms.
Our TBM results of tissue loss in the inferior parietal lobule are consistent with results from previous studies of negative symptoms in patients with schizophrenia Reference Sigmundsson, Suckling, Maier, Williams, Bullmore and Greenwood43,Reference Frederikse, Lu, Aylward, Barta, Sharma and Pearlson44 and support the idea of the involvement of the inferior parietal lobule in the development of schizophrenia. This is in keeping with the hypothesised role of mirror neurons in the inferior parietal lobule with regard to social cognition, specifically empathy and understanding the actions and intentions of others. Reference Gallese, Keysers and Rizzolatti45,Reference Rizzolatti and Sinigaglia46 An alternative possible explanation is that it may relate to the importance of the parietal lobe in functions which are disturbed in schizophrenia such as spatial working memory, language and attention. Reference Choi, Park, Jung, Jang, Kang and Jung47
Although more known for its role in motor coordination the cerebellum is increasingly recognised as having a variety of non-motor functions including a role in social cognition. Reference Calarge, Andreasen and O'Leary48 Therefore, our finding of significant tissue loss in the left posterior cerebellum, which has previously been shown to be the region most associated with non-motor deficits, Reference Stoodley and Schmahmann49 is in keeping with the evidence of its role in theory of mind as it relates to negative symptoms.
It is not clear to what degree prominent negative symptoms herald the development of schizophrenia, although it has more recently been suggested that negative symptoms may actually form an earlier, rather than later, part of the prodromal illness. Reference Hafner, Maurer and an der Heiden50 However, when combined with the finding of Hazlett et al that decreased superior temporal gyrus volumes were found in individuals with schizophrenia compared with those with schizotypy, Reference Hazlett, Buchsbaum, Haznedar, Newmark, Goldstein and Zelmanova51 suggests that prominent negative symptoms and grey matter changes may indeed be the forbearer of a threshold illness.
Study limitations
There are certain limitations to this study. First, the group with negative symptoms is slightly but significantly older than those without. This is not unexpected as the older participants are closer to the peak age at onset of schizophrenia. However, as age was included as a covariate in the TBM analysis we know that the age difference does not explain our main results. Second, although it could be suggested that in the negative symptoms group we are merely looking at a group with more severe illness, and although in terms of negative symptoms this is clearly the case, it is not so in terms of positive symptoms which do not differ (Table 1). It is possible that the negative symptoms are a precursor to the development of manifest psychosis but this transition has yet to occur.
The number of individuals with negative symptoms is relatively small and confirmation in a larger sample would be desirable. However, the sample from which this group was derived was very large Reference Johnstone, Owens, Hoare, Gaur, Spencer and Harris15,Reference Moorhead, Stanfield, McKechanie, Dauvermann, Johnstone and Lawrie16 and the opportunity of observing the development of negative symptoms over time in a group as large as this is unusual. The significance of the negative symptoms in terms of their role as a precursor of the development of schizophrenia cannot be known at this stage. Finally, the inclusion of two individuals in the negative symptoms-free group who were taking antidepressants is a possible confounder, although among the group of 34, of whom 32 were medication free, we think it unlikely that this was driving the results. In addition, the measures of observed depression at baseline did not differ significantly between the groups.
Implications
The presence and development of negative symptoms in people at high risk of schizophrenia for cognitive reasons is related to grey matter tissue loss in brain regions associated with social cognition. Our findings compliment and add to those of previous studies in groups at increased risk for other reasons (e.g. genetic high risk or clinical high risk). As noted, the pathophysiology of negative symptoms has been poorly understood and effective treatments have been hard to find. The results presented here do not overcome these problems but may represent a first step towards meaningful understanding of the biological underpinnings of these disabling symptoms of schizophrenia.
Funding
This study was supported by a programme grant from the UK Medical Research Council (G0100102) and by the Dr Mortimer and Theresa Sackler Foundation.
Acknowledgements
We are grateful to all of the study participants and their families, without whom this study would not have been possible. We are also most grateful to Dame Stephanie Shirley who funded the development of our mock scanning suite.


eLetters
No eLetters have been published for this article.