


Systematic reviews of prospective magnetic resonance imaging (MRI) studies of schizophrenia have indicated the existence of progressive volumetric changes in a number of brain regions (Reference Shenton, Dickey and FruminShenton et al, 2001; Reference Steen, Mull and McClureSteen et al, 2006). A number of explanations have been offered for these changes including the effects of medication, a programmed loss of neuropil and excitotoxic damage analogous to that caused by phencyclidine in rats (Reference WilliamsonWilliamson, 2006). Proton magnetic resonance spectroscopy (1H-MRS) allows in vivo quantification of glutamatergic metabolite levels at different stages of illness which could be associated with glutamatergic excitotoxicity; such studies in patients with schizophrenia have found increased glutamine levels in both the left anterior cingulate and thalamus in never-treated patients with first-episode schizophrenia and decreased levels of both glutamate and glutamine in the left anterior cingulate in patients with chronic illness (Reference Bartha, Williamson and DrostBartha et al, 1997; Théberge et al, Reference Théberge, Bartha and Drost2002, Reference Théberge, Al-Semaan and Williamson2003). Volumetric MRI techniques such as voxel-based morphometry (VBM) allow the assessment of grey-matter losses that could be caused by medication effects or programmed loss of neuropil. Separately, 1H-MRS and VBM, used in a longitudinal study of first-episode schizophrenia, permit comparison of the time evolution of brain abnormalities with that expected through pathophysiological mechanisms involving grey-matter loss alone or glutamatergic losses alone. By combining the two techniques one can examine pathophysiological mechanisms involving both grey-matter loss and glutamatergic changes such as neuroplasticity or neuropil loss. The purpose of this study was to determine whether glutamatergic abnormalities in schizophrenia correlated with grey-matter losses during the first years of illness.
We predicted that patients experiencing a first episode of schizophrenia would have higher than normal glutamatergic metabolite levels on the basis of our previous studies (Reference Bartha, Williamson and DrostBartha et al, 1997; Reference Théberge, Bartha and DrostThéberge et al, 2002). From a previous cross-sectional study of chronic schizophrenia showing lower than normal glutamine levels in the anterior cingulate (Reference Théberge, Al-Semaan and WilliamsonThéberge et al, 2003), glutamatergic metabolites levels and grey-matter volumes were expected to decrease after 30 months in patients experiencing a first episode of schizophrenia and to remain unchanged in healthy participants. Furthermore, we predicted that the effect of medication alone on glutamatergic metabolites and grey-matter volumes would be minimal and that disease-related reductions in these quantities would become apparent when comparing never-treated patients and patients treated for approximately 2.5 years (30 months), but these parameters would not decrease in healthy participants assessed 2.5 years apart. Finally, we expected that the longitudinal differences in glutamatergic metabolites in the anterior cingulate and thalamus would correlate with the grey-matter volume differences in functionally connected cortical areas, because glutamatergic losses in a given region can also be attributed to loss of glutamatergic afferents from another structure, in which case local reductions in glutamatergic metabolites could be obtained without local grey-matter losses and in response to remote grey-matter losses.
METHOD
Sixteen never-treated participants experiencing a first episode of schizophrenia and 16 healthy participants volunteered for the study after the protocol was fully explained, and written informed consent was obtained according to the guidelines of the Review Board for Health Sciences Research Involving Human Subjects at the University of Western Ontario in Canada. Participants were recruited by advertisement within the community and health network of London, Ontario. Demographic information about each group of participants is summarised in Table 1. The first MRS assessment of 12 of the participants with schizophrenia and 6 healthy participants was part of a previous study (Reference Théberge, Bartha and DrostThéberge et al, 2002). The second and third examinations of participants with schizophrenia occurred 10 months (s.d.= 3) and 34 months (s.d.=9) respectively after the first examination. A mean of 35 months (s.d.=12) separated the healthy participants’ first and second examinations. For convenience, the data groups are referred to as follows: participants with schizophrenia first assessment (never treated), NT; second assessment (10 months of treatment), 10 M; third assessment (30 months of treatment), 30 M; healthy participants first assessment, HPAR1; second assessment, HPAR2.
Table 1 Participant information and data availability.
| Group1 | |||||
|---|---|---|---|---|---|
| NT (n=16) | 10M (n=16) | 30M (n=16) | HPAR1 (n=16) | HPAR2 (n=16) | |
| Age, years: mean (s.d.) | 25 (8) | 25 (8) | 27 (8) | 29 (12) | 32 (12) |
| Gender, n | |||||
| Female | 2 | 2 | 2 | 2 | 2 |
| Male | 14 | 14 | 14 | 14 | 14 |
| Handedness, n | |||||
| Right-handed | 12 | 12 | 12 | 13 | 13 |
| Left-handed | 3 | 3 | 3 | 3 | 3 |
| Ambidextrous | 1 | 1 | 1 | 0 | 0 |
| Educational level: mean (s.d.)2 | |||||
| Participants | 2 (1) | 2 (1) | 2 (1) | 3 (1) | 3 (1) |
| Parents | 3 (1) | 3 (1) | 3 (1) | 3 (1) | 3 (1) |
| Schizophrenia subtype, n | |||||
| Paranoid | 11 | 11 | 11 | ||
| Undifferentiated | 5 | 5 | 5 | ||
| DUP, weeks: mean (s.d.) | 96 (108) | 96 (108) | 96 (108) | ||
| Length of illness, weeks: mean (s.d.)3 | 96 (108) | 144 (121) | 243 (120) | ||
| Symptoms score: mean (s.d.) | |||||
| SANS | 44 (12) | 33 (11) | 35 (10) | ||
| SAPS | 32 (12) | 6 (5) | 9 (8) | ||
| Data availability, n | |||||
| Anterior cingulate MRS | |||||
| Available | 13 | 13 | 16 | 16 | 15 |
| Excluded | 2 | 1 | 0 | 0 | 0 |
| Missing data | 1 | 2 | 0 | 0 | 1 |
| Thalamus MRS | |||||
| Available | 14 | 12 | 16 | 16 | 15 |
| Excluded | 1 | 2 | 0 | 0 | 0 |
| Missing data | 1 | 2 | 0 | 0 | 1 |
| VBM | |||||
| Available | 15 | 14 | 16 | 16 | 16 |
| Missing data | 1 | 2 | 0 | 0 | 0 |
All participants were assessed by a psychiatrist using the Structured Clinical Interview for DSM–IV (SCID; Reference First, Spitzer and GibbonFirst et al, 1997). Eleven participants were classified as having paranoid schizophrenia and five as having undifferentiated schizophrenia. The duration of untreated psychosis for participants with schizophrenia was evaluated and defined as the elapsed time between the first examination and the first appearance of positive symptoms. Symptoms of participants with schizophrenia were evaluated using the Scale for the Assessment of Negative Symptoms (SANS; Reference AndreasenAndreasen, 1983a ) and the Scale for the Assessment of Positive Symptoms (SAPS; Reference AndreasenAndreasen, 1983b ). The mean parental educational level of the most educated parent was rated on a four-point scale for all participants (level 1, grade 10 or below; level 2, grades 11–13; level 3, college 1–3 years; level 4, college 4 years or more). Handedness was assessed using a questionnaire (Reference BrydenBryden, 1977).
Four participants with schizophrenia received medications other than antipsychotics 1–10 days prior to their first scan (see Table 2). For patients receiving antipsychotic treatment, chlorpromazine equivalent dosages were calculated (Reference Bezchlibnyk-Butler and JeffriesBezchlibnyk-Butler & Jeffries, 2002; Reference WoodsWoods, 2003). At their second assessment, all patients were receiving atypical antipsychotics (not clozapine), with the exception of one patient who received haloperidol and two who did not receive antipsychotic medication but were judged to be clinically stable. At the final assessment two participants were taking clozapine and a third participant was no longer receiving medication.
Table 2 Medication in the study sample (see Table 1 for definition of study groups)

| NT (n=16) | 10M (n=16) | 30M (n=16) | ||||
|---|---|---|---|---|---|---|
| n | Mean dosage, mg (s.d.) | n | Mean dosage, mg (s.d.) | n | Mean dosage, mg (s.d.) | |
| No medication | 11 | 2 | 3 | |||
| Antipsychotics1 | ||||||
| Haloperidol | 0 | 1 | 1 | 2 | 1 (0) | |
| Risperidone | 0 | 5 | 3.7 (2.1) | 5 | 2.5 (2.1) | |
| Quetiapine | 0 | 2 | 350 (71) | 1 | 300 | |
| Olanzapine | 0 | 3 | 12.5 (2.9) | 3 | 11.7 (2.9) | |
| Ziprasidone | 0 | 1 | 160 | 0 | ||
| Clozapine | 0 | 0 | 2 | 350 (141) | ||
| Benzodiazepines | ||||||
| Diazepam | 0 | 0 | 1 | 2.52 | ||
| Clonazepam | 1 | 43 | 2 | 25 (35)2 | 1 | 12 |
| Lorazepam | 2 | 1 (0)3 | 0 | 0 | ||
| Antidepressants | ||||||
| Fluoxetine | 0 | 0 | 1 | 2002 | ||
| Sertraline | 0 | 0 | 1 | 2002 | ||
| Paroxetine | 1 | 303 | 0 | 1 | 202 | |
| Citalopram | 1 | 203 | 0 | 0 | ||
| Venlafaxine | 0 | 0 | 1 | 75 (0) | ||
| Benzatropine | 0 | 1 | 32 | 2 | 2 (0)2 | |
| Valproate semisodium4 | 0 | 0 | 1 | 12502 | ||
| Zopiclone | 1 | 7.53 | 0 | 0 | ||
| CPZeq, mg/day: mean (s.d.) | 196 (145) | 154 (150) | ||||
None of the participants had a history of head injury or of drug or alcohol misuse in the year before the scan, or a serious medical illness (according to SCID and anatomical MRI). Participants reported not using substances on the day of the scan; urinalysis was not always performed.
MRS and MRI
All MRI and MRS data were obtained using a 4.0 T Varian (Palo Alto, California, USA)/Siemens (Erlangen, Germany) scanner with a Varian Unity Inova console, Siemens Sonata gradients and a circularly polarised hybrid head resonator (XLR Imaging Inc., London, Ontario, Canada). The methods of MRI data acquisition and MRS data acquisition and data processing were identical to those described in a previous report by Théberge et al (Reference Théberge, Bartha and Drost2002). These procedures are described briefly below.
After a manual adjustment of global magnetic field uniformity with first- and second-order shims, a T 1-weighted three-dimensional imaging volume was obtained (three-dimensional magnetisation-prepared fast low angle shot (MP-FLASH), inversion time (TI) 500 ms, time to repetition (TR) 11.4 ms, time to echo (TE) 6.2 ms, α=30°, 64 slices, 2.75 mm thick, field of view 20 cm, matrix 256×256) and used to prescribe MRS voxel position, manually segment grey/white matter and cerebrospinal fluid (CSF) within MRS voxels and perform voxel-based morphometry.
Localised short echo time 1H-MRS measurements (stimulated echo acquisition mode, STEAM; TR=2000 ms, TE=20 ms, mixing time (TM)=30 ms, acquisition time 1.5 s, dwell time 500 μs, size 10×10×15 mm3, eight-step eight-step phase cycle, averages: 256 water-suppressed, 16 unsuppressed) were obtained from voxels in the left anterior cingulate and left thalamus of each participant (retrospective description of average Talairach coordinates: anterior cingulate, –5.9, 46.7, 1.3 – Brodmann area (BA) 32; thalamus, –6.9, –14.3, 4.2). Voxels were positioned by the scanner operator (J.T. or N.A.) based on anatomical landmarks, as trained by our local neuroanatomy expert (N.R.). Local field uniformity and radio frequency pulse power were manually optimised for each voxel. The line shapes of the water-suppressed spectra were restored to a Lorentzian form using a combined QUALITY and eddy current correction (ECC) lineshape correction (QUECC; as in Reference Bartha, Drost and MenonBartha et al, 2000b ). Residual water resonances between (4.2–6.2 ppm) were modelled using a Hankel–Lanczos singular value decomposition procedure and subtracted (Reference Bartha, Drost and WilliamsonBartha et al, 1999). Before spectral quantification, the quality of every spectrum was evaluated using two visual scales to provide an index composed of a number from 1 to 10 (Visual Appreciation Scale) and a letter from A to E (Baseline and Artefact Scale). The combined scales allow a more structured determination of spectral quality and are used in the decision to discard a spectrum in cases of excessive voluntary or involuntary movement by the participant (further information about these scales is presented in Data Supplement 1 to the online version of this paper). In this study, we discarded spectra with a Visual Appreciation Scale rating lower than 5 and/or a Baseline and Artefact Scale rating poorer than B, and for which the spectral quantification procedure described below was unsuccessful (no metabolite level data produced). Quantification of the water-suppressed spectra was performed using the Lawson Health Research Institute Fitman spectral analysis suite (Bartha et al, Reference Bartha, Drost and Williamson1999, Reference Bartha, Drost and Menon2000a ), a software package developed by our group and used by us and by other international collaborators in more than 30 publications. Time domain fitting of the water-suppressed spectra used the first 1024 points acquired. The quantification model used a priori knowledge from 12 metabolite solutions and partial prior knowledge for three macromolecules and ten broad components as described by Bartha et al (Reference Bartha, Drost and Williamson1999, Reference Bartha, Drost and Menon2000a ) (a complete list of the modelled spectral components can be found in the caption to Fig. 2). This quantification model using partial prior knowledge of broad spectral components is ideal for our short echo time STEAM-localised spectra acquired without outer-volume suppression (Reference Bartha, Drost and MenonBartha et al, 2000a ). The water-unsuppressed spectra were lineshape corrected and fitted to a single Lorentzian model. Metabolite levels were obtained by normalising the metabolite amplitude by the corrected amplitude of the water-unsuppressed acquisition (further information is presented in Data Supplement 2 to the online version of this paper). Although other MRS studies present metabolite levels calculated in this fashion as ‘absolute’ concentrations in mol/l or mol/kgww, we present them as metabolite levels in arbitrary units owing to the arbitrary nature of the numerical values chosen for quantities such as temperature-dependent molecular weights and densities as well as the assumed water content of different brain tissues (grey matter 81%, white matter 71%, CSF 100%). These quantities were obtained from the literature rather than measured in each individual participant because of the time needed to obtain such measurements. Additional correction for relaxation weighting (T 1, T2) and diffusion weighting of both metabolites and the water reference signals would be needed to claim absolute quantification; however, the magnitude of changes in these tissue parameters required to produce a significant change in metabolite levels is typically considered unlikely to be found in brains not affected by neoplasms, and thus these additional corrections are often ignored. The coefficients of variation of N-acetylaspartate, glutamate and glutamine metabolite levels using this technique (4.0 T, STEAM, TE=20 ms, 1.5 cm3 volume of interest) were 8%, 11% and 24% inter-individual and 7.3%, 8.9% and 16.9% intra-individual (Reference Bartha, Drost and MenonBartha et al, 2000a ).
Only metabolite levels, ratios of glutamate to glutamine (Glu/Gln) and macromolecular levels with inter-individual coefficients of variation less than 75% were included in statistical comparisons. In a normally distributed sample this upper limit guarantees that less than 10% of the sample would have negative values. Negative concentrations are impossible and never produced by our quantification routine. Thus the upper limit criterion prevents metabolite levels for which a significant proportion of samples have hit the lower detection threshold (not normally distributed) from being included in the statistical analysis (which assumes normality). Quantities satisfying this upper limit criterion included the metabolite levels of N-acetyl-aspartate, glutamate, glutamine, choline-containing compounds, creatine and phosphocreatine, myo-inositol and taurine for the anterior cingulate spectra; in addition, scyllo-inositol met the criterion in the thalamic spectra. Macromolecular levels of unidentified broad components M1.70, M1.41, M1.30, M1.22 and M0.90 in the anterior cingulate spectra and M3.15, M3.00, M1.75, M1.70, M1.50, M1.41, M1.30 and M0.90 in the thalamus met the coefficient of variation upper limit criterion as well as the metabolite level Glu/Gln in both regions of interest. Results for metabolites not satisfying this upper limit criterion are not reported. These metabolites were nevertheless part of the spectral quantification template.
For the two measurement period data (NT and 30M v. HPAR1 and HPAR2) the overall layout entailed a 2×2 split-plot factorial design with ‘measurement period’ being the two-level within-participant factor and ‘participant group’ being the two-level between-participant factor. With our directional hypotheses on the progression of glutamate and glutamine levels, unidirectional statistical tests (α=0.05) were applied. Significant effects, however, met two-tailed criteria throughout (Reference StevensStevens, 1996). The time evolution of glutamate and glutamine levels for participants with schizophrenia was tested separately from other metabolites because of our directional hypotheses concerning these metabolites. Here, the data layout entailed a three-level repeated-measures design using measurements from NT, 10M and 30M. Spectroscopic data for which we had no a priori hypotheses (macromolecular levels, the Glu/Gln ratio and the set of metabolite levels residual to glutamate and glutamine) were examined using multivariate analysis of variance (MANOVA) applied region-wise using the 2×2 (groups×time) split-plot factorial layout. For the patient group, the above measures were subjected to a region-wise MANOVA using the aforementioned three-level repeated-measures design. Constituent univariate analyses of variance were applied to the individual variables of the multivariate set pursuant to significant parent multivariate results (α=0.05). Two-tailed alphas of 0.05 (Reference Hummel and SligoHummel & Sligo, 1971; Reference StevensStevens, 1996) were used for the follow-up univariate tests (e.g. the statistical treatment in Reference Jensen, Miller and WilliamsonJensen et al, 2004).
Correlation between metabolite levels of participants with schizophrenia and symptoms scores (SANS and SAPS) as well as with length of illness and chlorpromazine equivalent dosage (30M only) were evaluated using the Pearson product-moment correlation coefficient (P<0.001).
Voxel-based morphometry maps were obtained for each participant using SPM2 (Wellcome Department of Imaging Neuroscience, University College London, UK) and the T 1-weighted images. Images were spatially normalised to the T 1-weighted template provided by SPM2 (Montreal Neurological Institute brain) and segmented into grey/white/CSF images with the modified model cluster analysis after correcting for intensity non-uniformity (Reference Ashburner and FristonAshburner & Friston, 2000). Images were then modulated by the Jacobian determinants obtained in the normalisation step and finally smoothed using an isotropic Gaussian kernel (12 mm full width at half maximum) (Reference Ashburner and FristonAshburner & Friston, 2001). The SPM2 general linear model produced maps of the t statistic for grey-matter ‘concentration’ changes between participants (NT v. HPAR1, 30M v. HPAR2) or within participants (NT v. 10M, NT v. 30M, 10M v. 30M, three-level repeated-measures analysis; HPAR1 v. HPAR2) with a corrected α< 0.05 and extent threshold k=5. Difference maps of grey-matter concentrations (NT—30M) were used in simple correlations with scanning, treatment and MRS variables. Uncorrected α values of 0.001 and k=5 were set to explore the hypothesised correlation of grey-matter loss and glutamine loss.
RESULTS
The participants’ demographic and clinical characteristics and data availability are summarised in Tables 1 and 2.
General 1H-MRS and VBM results
The proton MRS section of this study produced 152 spectra: 2 regions per participan×((3 time points×16 participants with schizophrenia – 3 missing time points) + (2 time points×16 healthy participants–1 missing time point)). Six of these spectra, obtained from participants with schizophrenia, were considered unusable because of excessive voluntary or involuntary movements during the acquisition (Table 1); no successful quantification was obtained from these six spectra. Discarded spectra had spectral quality ratings of 0E, 0E, 4C, 3E and 10D and one thalamic spectral acquisition was abandoned before completion owing to breathing-induced phase variations. All discarded spectra had been obtained from male participants (anterior cingulate: two NT, one 10M; thalamus: one NT, two 10M) and their handedness was as follows: anterior cingulate, right-handed participants exclusively (two NT, one 10M); thalamus, two right-handed participants (one NT, one 10M) and one left-handed participant (10M).
Mean metabolite levels for both regions and all groups are presented in Fig. 1 along with group standard deviations and statistics for significant differences (macromolecule levels for both regions and all groups are presented in Data Supplement 3, and group standard deviations of metabolite levels and minimum detectable percentage difference between groups in Data Supplement 4 to the online version of this paper). A typical spectrum from the anterior cingulate of a participant with schizophrenia is shown in Fig. 2, together with the spectral model and components. Fitted line widths of unsuppressed water signals and time domain N-acetylaspartate area signal-to-noise ratios are presented in Data Supplement 5 to the online version of this paper. The distribution of thalamic glutamine levels is presented in Fig. 3 for all participant groups.

Fig. 1 Longitudinal evaluation of metabolite levels in the left anterior cingulate and left thalamus of healthy participants and participants experiencing a first episode of schizophrenia (HPAR1, HPAR2) (NT, 10M, 30M; see text for definition of groups). Key: a, significantly different from HPAR1 (anterior cingulate: t=2.33, d.f.=1,27, P=0.014; thalamus: t=2.20, d.f.=1,28, P=0.018); b, significant group effect for NAA in 2×2 split-plot factorial analysis: HPAR1 and HPAR2 v. NTand 30M (F=4.431, d.f.=1,26, P=0.045); c, 30M level significantly different from NT level (t=2.802, d.f.=1,13, P=0.008); d, 30M level significantly different from 10M level (Gln: t=2.144, d.f.=1,11, P= 0.028; tCr: F=6.802, d.f.=1,11, P= 0.048); e, significant group effect for Tau in 2×2 split-plot factorial analysis: HPAR1 and HPAR2 v. NT and 30M (F=4.423, d.f.=1,27, P=0.045). Cho, choline-containing compounds; Gln, glutamine; Glu, glutamate; Myo, myo-inositol; NAA, N-acetylaspartate; Tau, taurine; tCr, creatine and phosphocreatine; Syl, scyllo-inositol.

Fig. 2 Anterior cingulate patient spectrum (example) and spectral quantification model: (a) spectral data (grey) and model (black) displayed with 2 Hz exponential broadening; (b) metabolite spectral components (top to bottom: N-acetylaspartate, glutamate, glutamine, γ-aminobutyric acid, creatine and phosphocreatine, choline-containing compounds, taurine, myo-inositol, scyllo-inositol, aspartate, N-acetylaspartylglutamate, glucose β and other components accounting for glutamate's and glutamine's 2CH multiplets, creatine's 2CH2 resonance and residual water peaks); (c) macromolecular spectral components; 13 unidentified broad resonances(top to bottom: M3.15, M3.00, M2.70, M2.29, M2.05, M1.75, M1.70, M1.50, M1.41, M1.30, M1.22, M0.90, M0.60; naming is based on seeded chemical shift in ppm).
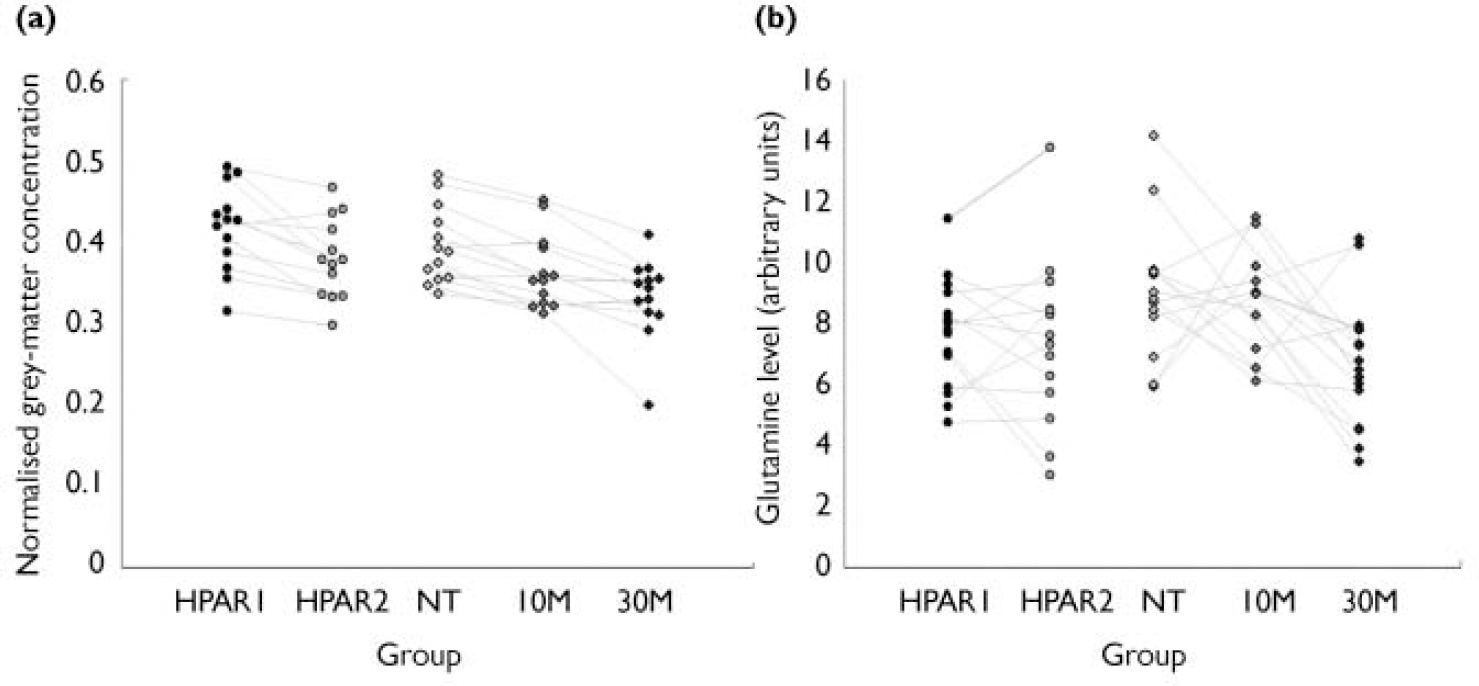
Fig. 3 Grey-matter volumes and glutamine levels in the five study groups (see text for key to groups): (a) selected volumes of interest in the superior temporal gyrus; (b) glutamine levels in the left thalamus.
Voxel-based morphometry used 77 anatomical volumes (3 time points×16 participants with schizophrenia – 3 missing time points)+(2 time points×16 healthy participants). Group standard deviation estimates for grey-matter ‘concentrations’ and minimum detectable difference between groups, based on data from a selected volume of interest in the superior temporal gyrus are presented in Data Supplement 4, and the distribution of VBM grey-matter concentrations is shown in Fig. 3.
Statistical comparisons
Proton MRS and VBM data were compared between participants with schizophrenia and healthy participants (between participants) and among participants with schizophrenia at different time points (within participants). A summary of all statistical comparisons is presented in Data Supplement 6 and details of significant VBM findings are presented in Data Supplements 7 and 8. Significant findings are presented below.
Between-participant comparisons
Anterior cingulate glutamine levels were significantly elevated among participants with schizophrenia (NT) compared with healthy participants (HPAR1) (see Fig. 1). This predicted result was embedded in a significant main effect of groups pursuant to the routine tests of the 2×2 split-plot factorial analysis (F=4.67, d.f.=1,26, P=0.04). The 2×2 analysis revealed a significant effect for group at the univariate level in metabolite levels of N-acetylaspartate (see Fig. 1) and macromolecular levels M1.41 (F=4.773, d.f.=1,26, P=0.038) and M1.30 (F=4.945, d.f.=1,26, P=0.035). These group differences were not significant at the multivariate level of analysis; although not ignored, they are presented with this associated caveat.
Left thalamic glutamate and glutamine levels showed significantly higher glutamine in participants with schizophrenia (NT) than in healthy participants (HPAR1) (see Fig. 1), but no significant difference in glutamate levels. The predicted elevation in level of glutamine for the patients’ first measurement period was considered as embedded in a significant (routinely computed) group×time interaction (F=5.76, d.f.=1,27, P=0.024), and main effect of time (P=0.02). Univariate split-plot factorial analysis of thalamic metabolite levels residual to glutamate and glutamine, macromolecular levels and the Glu/Gln ratio showed a significant group effect for the metabolite level of taurine (see Fig. 1), whereby participants with schizophrenia had lower levels than healthy participants. Note that Levene's test for equality of error variances disclosed no significant difference for anterior cingulate and thalamic glutamate and glutamine, a statistical bias consideration when comparing groups of unequal size (Box, Reference Box1953, Reference Box1954; Reference Milligan, Wong and ThompsonMilligan et al, 1987).
Between-group comparisons of grey-matter volume changes (VBM) showed significant differences between the last assessment of healthy participants and participants with schizophrenia (HPAR2>30M) but not in other comparisons (HPAR1>NT, HPAR1<NT, HPAR2<30M) using corrected t-statistics (α=0.05, k=5). Two small regions of significant grey-matter reduction were located in the left superior temporal gyrus (BA 22, k=77) and the left caudate head (k=10).
Within-participant comparisons (three-level)
The three-level repeated-measures analysis of glutamine and glutamate levels, in the anterior cingulate and thalamus respectively, yielded no significant effect. There were insufficient residual degrees of freedom (measure battery-to-participant ratio ≥1) to perform a three-level repeated-measures multivariate analysis of anterior cingulate metabolite levels residual to glutamate and glutamine, macromolecular levels and Glu/Gln; however, this was performed successfully with the corresponding thalamic metabolite levels. Multivariate (thalamus only) and univariate three-level repeated-measures analyses revealed no significant effect for any of these measurements (the Huynh–Feldt non-sphericity correction was applied for these tests) in both the anterior cingulate and thalamus.
The three-level within-group comparisons of VBM data from participants with schizophrenia (NT, 10M, 30M) yielded significantly different regions for NT>10M, NT>30M and 10M>30M (corrected α=0.05, k=5, d.f.=2,24). Figure 4 presents the distribution of regions of reduced grey-matter volume (NT>30M) superimposed on a cortical surface rendering. Regions with significant grey-matter volume reductions (NT>30M) include cortical regions of the frontal lobe (middle frontal gyrus: BA 46, 8 and 9; medial frontal gyrus: BA 6 and 8; inferior frontal gyrus: BA46, 9 and 44) bilaterally, the bilateral temporal lobe (BA 38, 39, 42, 21 and 22), the bilateral parietal lobe (BA 7, 40, 31 and 39), the limbic lobe (BA 28 and 31 (posterior cingulate), hippocampus and amygdala), the right caudate and right thalamus.

Fig. 4 Grey-matter losses in participants experiencing a first episode of schizophrenia after antipsychotic treatment for a period of 30 months: distribution of regions with significantly reduced grey-matter volume on comparison of the images obtained at the start and end of this period, superimposed on a cortical surface rendering.
Within-participant comparisons (two-level)
The split-plot factorial multivariate analysis of anterior cingulate macromolecular levels, Glu/Gln and the set of metabolite levels residual to glutamate and glutamine yielded a significant effect for time only (F=4.681, d.f.=11,16, P=0.003). Univariate split-plot factorial analysis of these measurements revealed a significant effect for time only in two macromolecular levels: M1.70 (F=7.924, d.f.=1,26, P=0.009) increased with time, and M1.41 (F=11.482, d.f.=1,26, P=0.002) decreased with time. Levene's test showed significant differences in the error variances of participants’ Glu/Gln ratio for the first assessment (F=8.940, d.f.=1,26, P=0.006). As the group of participants with schizophrenia had a smaller variance, and lower n owing to missing/excluded data, the lack of significant effects for this measure was not a statistical artefact (Reference Milligan, Wong and ThompsonMilligan et al, 1987).
The split-plot factorial MANOVA on thalamic metabolite levels residual to glutamate and glutamine, macromolecular levels and Glu/Gln yielded no significant effect. Univariate split-plot factorial analysis of the same measurements nevertheless revealed a significant effect for time in two macromolecular levels: both M1.50 (F=5.745, d.f.=1,27, P=0.024) and M1.41 (F=7.123, d.f.=1,27, P=0.013) decreased with time. Pursuant to the significant findings of the three-level analysis of the VBM data, within-group two-level comparisons (NT>10M, NT>30M, 10M>30M) were computed post hoc with a more exploratory uncorrected α=0.00001 and k=5 (d.f.=1,12). Significant reductions in grey-matter volume were found in all three comparisons (results are presented in Data Supplement 6).
Grouping of VBM data from participants with schizophrenia according to subtype (paranoid v. undifferentiated) in a 2×2 split-plot factorial design did not produce any significant effect for group using a corrected α=0.05 and k=5. Grey-matter loss across time (NT v. 30M) was not significantly different between subtypes (corrected P<0.05, k=5).
Based on the grey-matter, white-matter and CSF segmentation procedure performed on the anterior cingulate and thalamic MRS volumes of interest for the calculation of tissue content correction factors used in spectral quantification, a technique akin to traditional grey-matter volume measurements, the amount of grey-matter did not differ between the first and last scan of patients (anterior cingulate, P=0.58; thalamus, P=0.47; two-tailed paired t-test) and controls (anterior cingulate, P=0.98; thalamus, P=0.32; two-tailed paired t-test).
Correlations
None of the anterior cingulate and thalamic metabolite levels, macromolecular levels or Glu/Gln showed a significant correlation with SANS or SAPS scores, length of illness or antipsychotic dosage (chlorpromazine equivalents) (P>0.001). Correlation coefficients of glutamine levels with SANS scores, SAPS scores, length of illness and antipsychotic dosage were respectively 0.208 (P=0.186), 0.016 (P=0.920), –0.259 (P=0.098) and –0.217 (P=0.168) in the anterior cingulate, and 0.134 (P=0.398), 0.242 (P=0.123), –0.137 (P=0.399) and 0.058 (P=0.714) in the thalamus. Although these spectral components overlap in terms of chemical shift, there was no significant correlation between anterior cingulate levels of glutamine and M2.70 (r=0.056, P=0.637), M2.29 (r=0.203, P=0.085), M2.05 (r=0.19, P=0.870), gamma-amino-butyric acid (GABA) (r=0.196, P=0.097) or N-acetylaspartylglutamate (NAAG) (r=–0.201, P=0.088), or between thalamic levels of glutamine and M2.70 (r=–0.201, P=0.227), M2.29 (r=0.095, P=0.426), GABA (r=0.036, P=0.763) or NAAG (r=–0.027, P=0.818) as assessed with a two-tailed Pearson–moment correlation in all groups combined (n=73). Thalamic levels of glutamine did loosely correlate with M2.05 (r=–0.381, P=0.01, n=73) which is a macromolecular level that was not included in the planned statistical analyses (s.d.>75%). However, upon post hoc examination no significant difference in M2.05 levels was found between any group of participants.
Correlation of grey-matter loss in participants with schizophrenia (NT —30M) and antipsychotic dosage at 30M showed no significant results using a corrected α value of 0.05. However, significant correlation was found in three areas of the brain using an exploratory uncorrected α of 0.001: left frontal lobe (precentral gyrus, BA 6, x y z –50, 2, 28; P<0.001, t=8.38); left frontal lobe (superior gyrus, BA 10, x y z –18, 64, 18; P<0.001, t=6.59); right frontal lobe (inferior gyrus, BA 9, x y z=32, 16, 28; P<0.001, t=4.93).
Grey-matter loss (NT —30M) did not show any significant correlation with the time elapsed between NT and 30M assessments using an uncorrected α of 0.001.
Correlation of grey-matter loss (NT —30M) assessed by VBM with reduction in thalamic glutamine (NT —30M) was found in four areas of the brain when using an uncorrected α of 0.001 and n=14: right parietal lobe (precuneus, BA 7, x y z 16, –44, 46; P<0.001, t=6.28); left parietal lobe (angular gyrus, BA 39, x y z –30, –64, 30; P<0.001, t=6.09); left temporal lobe (inferior gyrus, BA 20, x y z –58, –36, –22; P<0.001, t=4.51); left temporal lobe (superior gyrus, BA 41, x y z –44, –26, 12; P<0.001, t=4.40). The correlation between left superior temporal gyrus grey-matter concentration loss and left thalamic glutamine loss is presented in Fig. 5 (r=0.741, n=14, P<0.001).

Fig. 5 Correlation of thalamic glutamine reduction and superior temporal gyrus grey-matter loss in participants with first-episode schizophrenia following 30 months of treatment.
Given the finding of positive correlation between thalamic glutamine loss and grey-matter volume loss from the VBM analysis, we expected a similar positive correlation between voxel grey-matter loss (first scan to last scan), as assessed during the grey/white/CSF segmentation procedure of the MRS analysis, and glutamine loss (first scan to last scan) in patients, and no correlation in controls. No significant correlation was found overall. In the anterior cingulate of patients (NT —30M) a trend towards a significant negative correlation was observed (r=–0.453, P=0.120, two-tailed, n=13), but no significant result was observed in controls (r=–0.149, P=0.597, two-tailed, n=15). No significant correlation was observed in the thalamus of patients (r=0.158, P=0.590, two-tailed, n=14) and controls (r=0.027, P=0.925, two-tailed, n=15).
DISCUSSION
Glutamatergic alterations
Proton MRS showed significantly increased levels of glutamine in both the left anterior cingulate and the left thalamus of never-treated participants with schizophrenia compared with healthy participants. These results are akin to the medial prefrontal findings of Bartha et al (Reference Bartha, Williamson and Drost1997) in a completely different cohort of patients and controls, and partially replicate the findings of Théberge et al (Reference Théberge, Bartha and Drost2002), who used an overlapping cohort of participants mostly composed of the same patients (12 of 16 NT) and a different group of controls (6 of 16 HPAR1). The results are consistent with a recent report of increased glutamine in the anterior cingulate of healthy participants administered a low dose of ketamine, a drug known to reliably produce schizophrenia-like symptoms (Reference Rowland, Bustillo and MullinsRowland et al, 2005), and with a report of increased glutamatergic metabolites in the medial frontal cortex of adolescents at high risk of developing schizophrenia (Reference Tibbo, Hanstock and ValiakalayilTibbo et al, 2004).
Glutamine levels did not significantly decrease in the left thalamus in participants with schizophrenia whose symptoms were stabilised with medication for 10 months, suggesting that medication or clinical status did not affect the findings. The absence of significant correlation between medication levels or clinical assessments and glutamine levels also suggest that these variables do not explain the findings. Decrease in thalamic glutamine within a period of 30 months in participants with schizophrenia could be explained by an excitotoxic process. However, glutamine levels did not decrease below healthy levels in either regions of interest. This contrasts with lower-than-normal glutamate and glutamine levels found in the anterior cingulate of patients with chronic schizophrenia (duration of illness 15 years) (Reference Théberge, Al-Semaan and WilliamsonThéberge et al, 2003). If excitotoxicity is responsible for glutamine decreases from elevated first-episode levels to lower than normal levels in patients with chronic illness, this study suggests that more than 30 months must elapse for its manifestation. This result also contrasts with the higher than normal thalamic levels of glutamine found in patients with chronic schizophrenia (Reference Théberge, Al-Semaan and WilliamsonThéberge et al, 2003); however, the majority of these patients were being treated with conventional rather than atypical antipsychotics for 10 years or more, which might account for the difference.
Anterior cingulate glutamine levels in never-treated participants with schizophrenia did not significantly decrease upon follow-up, suggesting that glutamatergic activity remains elevated in this region for at least 30 months. As expected, no significant difference in glutamine levels was observed between the initial and follow-up examination in healthy participants, suggesting that ageing does not affect normal glutamatergic activity over a period of 30 months. We did not observe any significant difference in N-acetylaspartate levels between participants with schizophrenia and healthy participants at first assessment or follow-up, which is consistent with studies using the same (Reference Bartha, Williamson and DrostBartha et al, 1997; Théberge et al, Reference Théberge, Bartha and Drost2002, Reference Théberge, Al-Semaan and Williamson2003) or similar methods (short echo time MRS and spectral analysis without non-physical baseline modelling).
Volumetric alterations
Voxel-based morphometry uncovered no significant grey-matter volume difference in the anterior cingulate and thalamus when comparing never-treated participants with schizophrenia and healthy participants. This suggests that significant differences in glutamine levels observed in never-treated participants compared with healthy participants are unlikely to be secondary to a programmed loss of neuropil (Selemon et al, 1999) prior to onset of symptoms or to other neurodevelopmental processes involving early grey-matter loss. However, elevated levels of glutamine in the early stages of untreated schizophrenia suggest a pre-existing dysregulation of the limbic basal ganglia–thalamocortical pathway (Reference Alexander, Crutcher and DeLongAlexander et al, 1990), the origin of which is not apparent from this study. No grey-matter volume difference was detected between the two healthy participant assessments 30 months apart. This suggests that grey-matter reductions related to normal ageing are unlikely to play a part in our findings.
Both the 10-month and 30-month assessments of participants with schizophrenia showed significant reductions in grey matter compared with the first (never-treated) assessment. After 10 months of treatment and stabilisation of symptoms, only a small cluster of voxels showed significantly reduced grey-matter volume in the left precuneus. After 30 months of treatment the significant reductions were widespread and had expanded to include regions of the frontal, temporal, parietal and limbic lobes. These observations are similar to those of previous studies (Reference Shenton, Dickey and FruminShenton et al, 2001; Reference Thompson, Vidal and GieddThompson et al, 2001; Reference Gogtay, Sporn and ClasenGogtay et al, 2004; Reference Honea, Crow and PassinghamHonea et al, 2005), particularly those looking at patients with first-episode disorder. Even after a short period of treatment (10 months) and stabilisation of symptoms, grey-matter volume reductions were observed, which suggests that antipsychotic medication might be partly responsible for the losses. However, the progressive nature of the grey-matter losses demonstrated at the 30-month assessment, when both clinical status and antipsychotic treatment had remained practically unchanged, suggests that the additional losses are disease-related. Late effects of antipsychotic medication on cortical volume are also a possibility.
Excitotoxicity or plasticity?
It is curious that no grey-matter loss was observed in regions where elevated glutamine was detected in never-treated participants with schizophrenia; this was expected, assuming the action of a glutamatergic excitotoxic process. It is possible that the use of a 12 mm smoothing kernel in the VBM analysis reduced our sensitivity to grey-matter changes in small structures (Reference White, O'Leary and MagnottaWhite et al, 2001) within the MRS regions of interest. However, traditional grey/white/CSF segmentation performed on the MRS volume of interest only also did not detect significant grey-matter loss in the anterior cingulate and thalamus. Detected regions of grey-matter loss, such as the dorsolateral prefrontal cortex and superior temporal gyrus, are closely connected with both the thalamus and the anterior cingulate. Interestingly, the posterior cingulate – one of the regions demonstrating significant reduction in grey matter at the 30 months assessment – is one of the first regions to incur excitotoxic damage after an acute administration of glutamate N-methyl-d-aspartate receptor antagonist in the rat model of schizophrenia of Olney & Farber (Reference Olney and Farber1995). Other schizophrenia models have proposed that regions of the dorsolateral prefrontal cortex and temporal lobe cortex regulate the limbic basal ganglia–thalamocortical circuit which includes the anterior cingulate and thalamus (Reference O'Donnell and GraceO'Donnell & Grace, 1998). Thus a programmed loss of neuropil in these cortical regions prior to the onset of symptoms could be associated with a secondary excitotoxic process in the limbic basal ganglia–thalamocortical circuit. However, in our study no lower than normal grey-matter volume consistent with loss of neuropil was observed at the initial assessment in those cortical regions. Thalamic input has an important role in directing the neuroplastic processes during cortical development (Reference Jafari, Zhang and YanJafari et al, 2007) and probably has a significant role in adult cortical plasticity (Reference WeinbergerWeinberger, 1995). The reciprocal connections between the thalamus and cortical regions are a potential conduit by which decreasing thalamic activity (evidenced in this study by a progressive reduction in glutamine) could lead to a plastic response. The finding of significantly correlated superior temporal lobe grey-matter loss and thalamic glutamine loss supports this interpretation.
Limitations
Some limitations should be acknowledged. Proton MRS measurements of glutamate and glutamine reflect the combined intra- and extraneuronal concentration within a somewhat coarse region of interest despite the use of high-field systems. Increases in glutamine concentration may not reflect increases in glutamatergic activity if a problem exists with the conversion of glutamine to glutamate in the astrocytic compartment of the glutamate–glutamine cycle. However, there is no consistent evidence for such enzymatic abnormality in schizophrenia. Glucose metabolism also influences glutamatergic neurotransmission by synthesising 15–20% of the glutamate entering the glutamate–glutamine cycle (Reference Hertz, Dringen and SchousboeHertz et al, 1999). The single-voxel MRS localisation technique used produced high-quality data from the anterior cingulate and thalamus yet did not permit the acquisition of MRS data from other regions of the brain potentially implicated in schizophrenia within a reasonable examination time. Macromolecular signals have been hypothesised by some to potentially influence glutamate and glutamine measurements. However, post hoc correlations of glutamine levels and overlapping macromolecular levels do not show a significant link, with the exception of thalamic glutamine levels and macromolecular level M2.05 which show a loose association. This association is not sufficient to explain significant findings in thalamic glutamine. Correlation with a greater number of overlapping components would have been necessary in order to explain the glutamine findings because of the fairly wide spread in chemical shift of glutamine's gamma and beta multiplets. Such a quantification artefact would probably have occurred in anterior cingulate data as well, yet no correlation was found between glutamine and macromolecular levels in this region. The number of participants in this study is fairly small owing to the complexity of following them up over several years. Steen et al (Reference Steen, Hamer and Lieberman2005) suggest that 39 patients and 29 controls are needed to obtain 80% statistical power to detect a 10% difference in N-acetylaspartate. Consequently, the number of participants might not have been sufficient to detect differences in metabolites such as N-acetylaspartate. The VBM technique may have limited ability to detect grey-matter volume differences in certain parts of the brain, and the use of large smoothing kernels may render the analysis sensitive to partial volume effects. Future studies should verify the observed progressive loss of grey matter with more conventional but time-consuming volumetric techniques.
Acknowledgements
This work was supported by the Canadian Institutes of Health Research (grant MT-12078).


eLetters
No eLetters have been published for this article.