


The Health of the Nation Outcome Scales (HoNOS) have been developed and validated for use with individuals with mental health problems in the general population (Reference Wing, Beevor and CurtisWing et al, 1998; Reference Bebbington, Brugha and HillBebbington et al, 1999).
The HoNOS provides professionals with a framework to measure risk and vulnerability. There are specific advantages in using HoNOS. It provides a systematic summary of behaviours and functioning, is easy to use, provides consistent measurements and provides basic monitoring and outcome information. In addition it allows all staff to work with the same criteria.
The HoNOS has generated a family of scales that target specific groups. HoNOS-CA (for use with children and adolescents) (Reference Gowers, Harrington and WhittonGowers et al, 1999) and HoNOS 65+ (for the population aged 65 years or over) (Reference Burns, Beevor and LelliotBurns et al, 1999) have both been designed and tested. There is also a version that has been designed for use with mentally disordered offenders (HoNOS-MDO) (P. Sugarman & H. Everest, personal communication, 1999).
People with learning disabilities are prone to the same range of mental illnesses as the general population, although there is a higher prevalence of mental illness within this group of people (Reference Patel, Goldberg and MossPatel et al, 1993; Reference Corbett, James and SnaithCorbett, 1979). People with learning disabilities are also sometimes further disadvantaged because of dual diagnosis (Reference Bernal and HollinsBernal & Hollins, 1995). There are several reliable and valid instruments for measurement of various aspects of learning disabilities, such as behavioural problems, physical disability and sensory disability (Reference AmanAman, 1991). There are few easy-to-use instruments, however, used by clinicians in day-to-day work, to measure changes in the level of functioning in people with learning disabilities who have added mental health needs.
The generic HoNOS was used with people with learning disabilities in longstay settings and was found to be limited in areas such as communication skills and movement disorders (Reference Ashaye, Mathew and DhadphaleAshayeet al, 1997).
Lelliott (1995), in calling for an integrated clinical information system, highlights the need for such an instrument. Problems encountered with poor coordination of services and different agencies means that an individual may not receive the best, or the appropriate care that he or she has a right to in the National Health Service (NHS).
“Agreement within clinical disciplines and between agencies on the use and definitions of common clinical terms concerning symptoms, signs and diagnoses, problems, needs, actions and outcomes could lead to standardisation of the way in which information is gathered and coded. This would open paths for better communication between those involved in mental health care and for comparisons between providers.”
METHOD
Development of HoNOS—LD
The generic HoNOS has 12 items that are individually graded for severity on a fivepoint scale. The Health of the Nation Outcome Scales for People with Learning Disabilities (HoNOS—LD) is rated on a similar five-point scale to HoNOS. The scales were re-calibrated to suit the needs of people with learning disabilities and a front sheet included to record information on impairments, diagnoses and levels of support available.
Following extensive consultation, it was agreed that the resulting instrument was worthy of testing in field trials.
The HoNOS—LD is designed for use with people with a learning disability and with added mental health needs, irrespective of the degree of their disability. Its primary aim is to measure change in an individual over two or more points in time as a measurement of outcome for therapeutic interventions. It measures change in the level of problems that a person has had and is not intended to be a comprehensive description of the individual. Like the generic HoNOS, HoNOS—LD may be used as a simple ‘present state’ profile for use by clinicians for their own purposes and could also be used, after aggregation and anonymisation, for epidemiological and administrative purposes.
The HoNOS—LD measures global outcomes and not inputs. It is not a rating for disability alone. The scale has items designed to measure areas of functioning that are relatively stable, and items measuring more transient phenomena that are more likely to change as a result of treatment.
Although the level of support that an individual receives will usually have a significant impact on performance, HoNOS—LD rates performances with the existing support, and not the individual's potential or the cause of the disability. Since it is intended for use in assessing global changes in those undergoing treatment, interventions in any area can lead to changes in several areas of functioning. It may be that a combination of inputs would produce the best outcome for some individuals or groups of people. The HoNOS—LD is able to measure no change, or deterioration, as well as improvement.
Field trials
All professional groups involved with the assessment and treatment of people with a learning disability and mental health needs participated in the study and the sample was drawn from a wide range of services across the country.
Acceptability studies
Following planning meetings, questionnaires were sent out to prospective pilot sites. Questions were asked about the content and construct validity of HoNOS—LD.
Ethical issues
Any studies involving people with learning disabilities or people with mental health problems should be able to stand up to ethical scrutiny. Work is sometimes carried out on behalf of people with learning disabilities that has little or no involvement by service users (Reference KiernanKiernan, 1999).
Anonymity of the people being rated was preserved through the use of a coding system. Each pilot site and each person could only be identified by their allocated codes.
Research ethics committees were not approached because the information required would have been gathered in any case, anonymity was assured, and the outcome scales themselves would be unlikely to directly affect the clinical treatment a patient or service user might receive from professionals.
Data gathering
Following training within participating NHS trusts, field trial sites were then asked to rate about 30 subjects. Each subject would have two raters rating simultaneously and using the same source of information (either an informant who knew the service user well, or case notes) but without conferring (T1). They were asked to rate the subject over the previous month. These same raters would then rate the individual subject — using the same source of information — about 3 months later in the same setting and, again, simultaneously and without conferring (T2). At both times (T1 and T2), raters were asked to provide a global subjective rating on the same five-point scale.
It was agreed that ICD-10 codes (World Health Organization, 1992) be used to indicate the degree of disability and any mental illness or developmental condition (such as autism).
Raters were also asked to record any physical conditions (e.g. epilepsy, Down's syndrome, cerebral palsy).
In addition to the ratings, those involved with the field studies were given a questionnaire that asked their views on the instrument itself and the guidelines for rating each instrument. Raters were asked to complete this questionnaire by indicating on a three-point scale (where the choices were good, fairly good or poor).
Data analysis and dissemination of findings
Data analysis began in April 1998 with the completion of the collection and collation of statistical results in July 1999. The analysis of data took place at Brooklands, Birmingham and at the Centre for Clinical Outcomes, Research and Effectiveness (CORE), University College London using Microsoft Access (Microsoft, 1997a ), Excel (Microsoft, 1997b ) and SPSS (SPSS, 1999) software.
RESULTS
Three hundred and seventy-two completed outcome scales were analysed at T1 and T2 across 16 NHS trusts. All these adhered to the agreed methodology. Fifty-seven questionnaires covering content and construct validity were returned and comments analysed.
Acceptability studies
There was general agreement that the language used was appropriate and that the instrument was easy to understand and use. The instruction points were found to be helpful, and there was consensus that some items might need to be added but few thought that the instrument should be shortened.
Results from the feedback questionnaire demonstrated that people involved in rating were happy with each instrument's items and the instructions accompanying them.
Demographic data
There was a preponderance of men in the population studied. The degree of learning disability was spread across the whole spectrum. This is shown in Table 1.
Table 1 Gender distribution and degree of learning disability
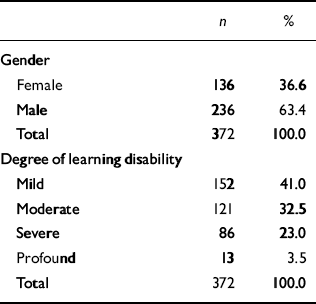
| n | % | |
|---|---|---|
| Gender | ||
| Female | 136 | 36.6 |
| Male | 236 | 63.4 |
| Total | 372 | 100.0 |
| Degree of learning disability | ||
| Mild | 152 | 41.0 |
| Moderate | 121 | 32.5 |
| Severe | 86 | 23.0 |
| Profound | 13 | 3.5 |
| Total | 372 | 100.0 |
Profession of rater
Three hundred and sixty-four raters rated 372 individuals. The profession of each rater is indicated in Table 2. Psychiatrists constituted over half the number at T1. At T2 there was a wider spread of professionals involved in rating.
Table 2 Profession of rater
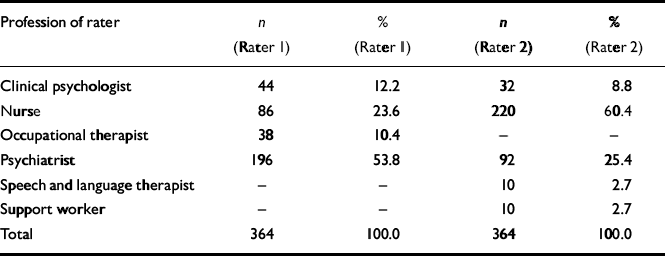
| Profession of rater | n (Rater 1) | % (Rater 1) | n (Rater 2) | % (Rater 2) |
|---|---|---|---|---|
| Clinical psychologist | 44 | 12.2 | 32 | 8.8 |
| Nurse | 86 | 23.6 | 220 | 60.4 |
| Occupational therapist | 38 | 10.4 | — | — |
| Psychiatrist | 196 | 53.8 | 92 | 25.4 |
| Speech and language therapist | — | — | 10 | 2.7 |
| Support worker | — | — | 10 | 2.7 |
| Total | 364 | 100.0 | 364 | 100.0 |
The pairs of ratings were analysed to measure reliability between raters taking into account their professional backgrounds. It was found that the Pearson correlation coefficient was high (0.89-0.96) between and within all combinations of professional groups.
Legal status
Information about legal status was available for 317 individuals. Two hundred and eighty-one (88.6%) were informal. Twenty-seven (8.5%) were sectioned under section 3 of the Mental Health Act 1983 and a further nine (2.8%) were under other sections such as 37 and 41.
Patient case status
Of the 372 cases, 360 (96.7%) were current cases and 12 (3.3%) were new referrals.
Patient accommodation
Information about accommodation was available for 303 individuals. One hundred and seventy-one (56.4%) lived in staffed group homes, 44 (14.5%) lived in their family home and a further 13 (4.4%) lived independently. Seventy-five people lived in hospitals, 46 (15%) in long-stay wards and 29 (9.6%) in acute assessment and treatment units.
Physical conditions
Information about coexisting physical conditions was available for 303 individuals. The most frequently occurring conditions are listed in Table 3.
Table 3 Physical conditions
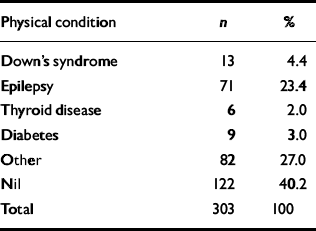
| Physical condition | n | % |
|---|---|---|
| Down's syndrome | 13 | 4.4 |
| Epilepsy | 71 | 23.4 |
| Thyroid disease | 6 | 2.0 |
| Diabetes | 9 | 3.0 |
| Other | 82 | 27.0 |
| Nil | 122 | 40.2 |
| Total | 303 | 100 |
Psychiatric/developmental conditions
Information about coexisting psychiatric/developmental conditions (ICD-10 diagnoses) was available for 262 individuals (70.4%). Out of this sample 32 people (12.2%) did not have a diagnosed condition. One hundred and fifty-seven (59.9%) patients had one condition, 59 (22.5) had two conditions, 10 (3.8%) had three and 4 (1.5%) had four coexisting psychiatric/developmental conditions.
Table 4 indicates the frequency of all diagnosed conditions of the subject population (n=262). Ten subjects with a personality disorder also had a sexual disorder. Twenty-seven subjects (10.3%) had a behavioural diagnosis only.
Table 4 Psychiatric/developmental conditions
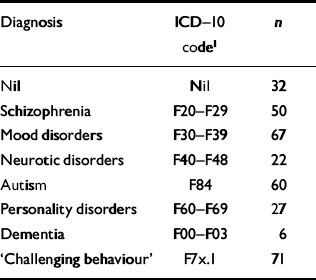
| Diagnosis | ICD-10 code1 | n |
|---|---|---|
| Nil | Nil | 32 |
| Schizophrenia | F20-F29 | 50 |
| Mood disorders | F30-F39 | 67 |
| Neurotic disorders | F40-F48 | 22 |
| Autism | F84 | 60 |
| Personality disorders | F60-F69 | 27 |
| Dementia | F00-F03 | 6 |
| ‘Challenging behaviour’ | F7×.1 | 71 |
Correlation coefficients between raters (total scores at TI)
Eighty-three per cent of the Pearson correlation coefficients (Reference PearsonPearson, 1902) calculated for the total scores of Rater 1 by Rater 2 at T1, were above the level ofr=0.7. This showed that there was a high degree of correlation between the total scores obtained between Rater 1 and Rater 2.
Cohen's κ was also calculated. The κ values and levels of significance obtained for T1 and T2 between the raters for all individual item scores show a high level of agreement in scoring between the two raters (see Table 5). The κ values and levels of significance obtained for T2 between raters for all the individual item scores again show a high level of agreement in scoring between the two raters.
Table 5 Validity of items
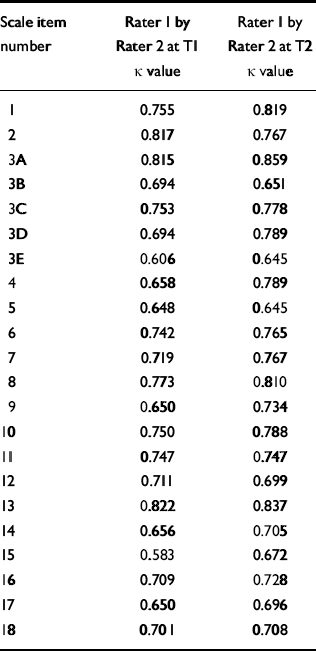
| Scale item number | Rater 1 by Rater 2 at T1 κ value | Rater 1 by Rater 2 at T2 κ value |
|---|---|---|
| 1 | 0.755 | 0.819 |
| 2 | 0.817 | 0.767 |
| 3A | 0.815 | 0.859 |
| 3B | 0.694 | 0.651 |
| 3C | 0.753 | 0.778 |
| 3D | 0.694 | 0.789 |
| 3E | 0.606 | 0.645 |
| 4 | 0.658 | 0.789 |
| 5 | 0.648 | 0.645 |
| 6 | 0.742 | 0.765 |
| 7 | 0.719 | 0.767 |
| 8 | 0.773 | 0.810 |
| 9 | 0.650 | 0.734 |
| 10 | 0.750 | 0.788 |
| 11 | 0.747 | 0.747 |
| 12 | 0.711 | 0.699 |
| 13 | 0.822 | 0.837 |
| 14 | 0.656 | 0.705 |
| 15 | 0.583 | 0.672 |
| 16 | 0.709 | 0.728 |
| 17 | 0.650 | 0.696 |
| 18 | 0.701 | 0.708 |
Subjective score
A Pearson correlation test was carried out to see whether the mean score for each completed outcome measure correlated with the subjective score for each rating.
A significant correlation was found between the mean score and the subjective score, at the 0.01 level, at both T1 and T2 for Rater 2. This analysis was completed for both raters at both T1 and T2. Significant results were obtained at the 0.01 level for both raters at both T1 and T2, indicating that the mean score correlated with the subjective score for each questionnaire irrespective of rater and time.
HoNOS-LD as a measure of change
A paired-sample t-test was completed using total scores obtained by Rater 1 at T1 v. T2 and total scores obtained by Rater 2 at T1v. T2. This showed that there was a significant difference between the scores at T1 and T2 for both raters. The level of significance for these differences was <0.001. This is shown in Table 6.
Table 6 Health of the Nation Outcome Scales for People with Learning Disabilities (HoNOS—LD) as a measure of change
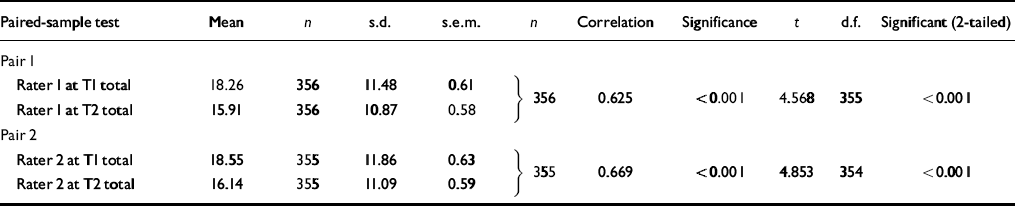
| Paired-sample test | Mean | n | s.d. | s.e.m. | n | Correlation | Significance | t | d.f. | Significant (2-tailed) |
|---|---|---|---|---|---|---|---|---|---|---|
| Pair 1 | ||||||||||
| Rater I at TI total | 18.26 | 356 | 11.48 | 0.61 [UNK] | 356 | 0.625 | <0.001 | 4.568 | 355 | <0.001 |
| Rater I at T2 total | 15.91 | 356 | 10.87 | 0.58 [UNK] | ||||||
| Pair 2 | ||||||||||
| Rater 2 at TI total | 18.55 | 355 | 11.86 | 0.63 [UNK] | 355 | 0.669 | <0.001 | 4.853 | 354 | <0.001 |
| Rater 2 at T2 total | 16.14 | 355 | 11.09 | 0.59 [UNK] |
There was significant correlation between the subject scores and total mean scores at T1 and T2 indicating a reliable measurement of change.
Reliability of data sources
There was a high correlation between Raters 1 and 2 (Pearson'sr=0.88) when clinical notes were used as a source of information (n=56) and an even higher correlation between Raters 1 and 2 (Pearson's r=0.96) when informants were used as a source of information (n=316). This indicated that using either notes or informants provided a reliable method of data collection between two raters, although informants were found to be more reliable.
Degree of change in mean total score
An attempt was made to determine whether the degree of learning disability significantly affected the degree of change in mean total score between T1 and T2.
The mean change score from each service user's total scores at T1 and T2 was calculated as follows: improvement, scores >0.06; no change, scores 0.05 to −0.05; deterioration, scores < −0.06.
There was a high correlation between change in mean total score between T1 and T2 for all degrees of disability at the 0.01 level of significance. The level of disability does not significantly affect the change in mean total score between T1 and T2, although it may be more difficult to interpret the significance of the profound group given the small numbers involved (n=13) (see Table 7).
Table 7 Change and degree of learning disability
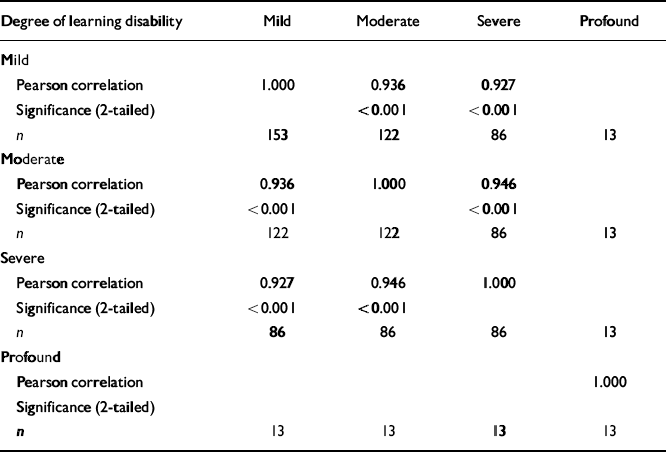
| Degree of learning disability | Mild | Moderate | Severe | Profound |
|---|---|---|---|---|
| Mild | ||||
| Pearson correlation | 1.000 | 0.936 | 0.927 | |
| Significance (2-tailed) | <0.001 | <0.001 | ||
| n | 153 | 122 | 86 | 13 |
| Moderate | ||||
| Pearson correlation | 0.936 | 1.000 | 0.946 | |
| Significance (2-tailed) | <0.001 | <0.001 | ||
| n | 122 | 122 | 86 | 13 |
| Severe | ||||
| Pearson correlation | 0.927 | 0.946 | 1.000 | |
| Significance (2-tailed) | <0.001 | <0.001 | ||
| n | 86 | 86 | 86 | 13 |
| Profound | ||||
| Pearson correaltion | 1.000 | |||
| Significance (2-tailed) | ||||
| n | 13 | 13 | 13 | 13 |
Mean HoNOS-LD scores
Calculation of the mean score of each question at T1 and T2 by Rater 1 indicated that subjects tended to score highly on psycho-social items and on Scale 1 (behaviour towards others), Scale 4 (attention and concentration) and Scale 9 (mood disturbance). In contrast, Scale 13 (seizures) was one area where subjects had scored relatively low, indicating that seizures were being well controlled.
Convergence study
Two raters completed HoNOS-LD ratings and then completed the Aberrant Behavior Checklist (ABC; Reference Aman, Singh and StewartAman et al, 1985) on the same service users at T1 and T2. In the interim one person died (hence n=31 at T1 and n=30 at T2). At T1 the Pearson correlation coefficient of the two ratings of ABC total scores was 0.87. The corresponding figure for the HoNOS-LD total scores was 0.93. There was a positive correlation between ABC and HoNOS-LD (Rater 1=0.66; Rater 2=0.76) at T1.
At T2 the interrater reliability of ABC total scores (Rater 1 v. Rater 2) was 0.81 and the interrater reliability of HoNOS-LD total scores was 0.76. Again there was a positive correlation between ABC and HoNOS-LD (Rater 1=0.71; Rater 2=0.76) at T2.
Measurement of change
The degree of change picked up by HoNOS-LD was evident in 207 service users. This is shown in Table 8.
Table 8 Measurement of change
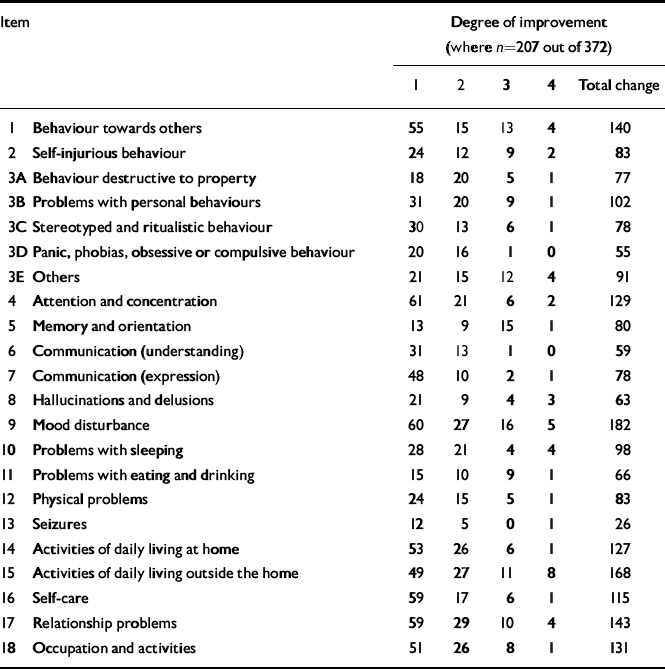
| Item | Degree of improvement (where n=207 out of 372) | |||||
|---|---|---|---|---|---|---|
| 1 | 2 | 3 | 4 | Total change | ||
| 1 | Behaviour towards others | 55 | 15 | 13 | 4 | 140 |
| 2 | Self-injurious behaviour | 24 | 12 | 9 | 2 | 83 |
| 3A | Behaviour destructive to property | 18 | 20 | 5 | 1 | 77 |
| 3B | Problems with personal behaviours | 31 | 20 | 9 | 1 | 102 |
| 3C | Stereotyped and ritualistic behaviour | 30 | 13 | 6 | 1 | 78 |
| 3D | Panic, phobias, obsessive or compulsive behaviour | 20 | 16 | 1 | 0 | 55 |
| 3E | Others | 21 | 15 | 12 | 4 | 91 |
| 4 | Attention and concentration | 61 | 21 | 6 | 2 | 129 |
| 5 | Memory and orientation | 13 | 9 | 15 | 1 | 80 |
| 6 | Communication (understanding) | 31 | 13 | 1 | 0 | 59 |
| 7 | Communication (expression) | 48 | 10 | 2 | 1 | 78 |
| 8 | Hallucinations and delusions | 21 | 9 | 4 | 3 | 63 |
| 9 | Mood disturbance | 60 | 27 | 16 | 5 | 182 |
| 10 | Problems with sleeping | 28 | 21 | 4 | 4 | 98 |
| 11 | Problems with eating and drinking | 15 | 10 | 9 | 1 | 66 |
| 12 | Physical problems | 24 | 15 | 5 | 1 | 83 |
| 13 | Seizures | 12 | 5 | 0 | 1 | 26 |
| 14 | Activities of daily living at home | 53 | 26 | 6 | 1 | 127 |
| 15 | Activities of daily living outside the home | 49 | 27 | 11 | 8 | 168 |
| 16 | Self-care | 59 | 17 | 6 | 1 | 115 |
| 17 | Relationship problems | 59 | 29 | 10 | 4 | 143 |
| 18 | Occupation and activities | 51 | 26 | 8 | 1 | 131 |
An analysis of reported improvements suggests that, where there are improvements, these are most likely to be in the areas of mood (Scale 9), behaviour towards others (Scale 1), attention and concentration (Scale 4) and the five psychosocial items (Scales 14-18). The most dramatic improvements were recorded in the areas of mood disturbance (Scale 9), activities in daily living outside the house (Scale 15), attention and concentration (Scale 4), and in relationship problems (Scale 17).
DISCUSSION
People with learning disabilities are subject to the same range of mental illnesses as the general population and are more prone to mental illness, psychological ill health and neurological conditions which affect quality of life. There are often problems with agreement of diagnosis (Reference Moss, Prosser and GoldbergMoss et al, 1996).
Improving the quality of a service necessitates a move from the measurement of volume to the measurement of outcomes (Reference LelliotLelliot, 1995). The HoNOS-LD provides clinicians with a structured and standardised approach to achieve this. It is simple to use, covers a broad range of clinical and psychosocial problems and is acceptable to clinicians. It has good interrater reliability and can measure change between two points in time. It has good correlation with well-established instruments such as the ABC. Factor analysis of HoNOS-LD shows that the instrument is useful irrespective of the degree of learning disability or gender of the person being rated.
A paired-sample t-test demonstrated that HoNOS-LD is a useful instrument in measuring change. The mean scores between T1 and T2 were demonstrated to have reduced (Rater 1 from 18.26 to 15.91 and Rater 2 18.55 to 16.14). The mean subjective scores for the same subjects had also reduced over the same period and there was a high correlation between the total HoNOS-LD scores and the subjective scores.
Analysis of the interrater reliability of the total scores of various professions demonstrated little variation in the strength of correlation coefficients against the raters' profession. Thus, HoNOS-LD can be used confidently by any service provider who has had appropriate training.
The comparison between the results of the field trials where the information source was either an informant or case notes, demonstrates the greater reliability of the use of informants.
Potential sources of bias
Difficulties with comprehension or expression may increase bias in reporting. The information that a client gives may need corroboration. Further bias may arise from the need to use an informant.
Some typical biases in responding include differing perspectives, social desirability, deviation and halo effects. All of these may have affected the field trials. By having a greater understanding, and by ‘cleaning’ data, it has been possible to minimise the effects of these possible biases in responding.
It is critical that any rating scale asks questions in such a way as to elicit as truthful an answer as possible (i.e. as near to a reflection of reality as possible). A rating scale that does not have this validity may produce skewed data that in turn may lead to further problems, for example, the overdiagnosis of a particular condition or an inaccurate assessment of risk.
The future
Further studies are needed to determine the effectiveness of the instrument with, for example, different age groups, people with chronic disabilities or with people from various ethnic backgrounds.
Clinicians can avoid misusing HoNOS-LD if they receive adequate training and appreciate the strengths and limitations of the instrument. Once the gathering of relevant clinical data is performed routinely, then clinicians will find that useful and rational approaches can be found to routine measurement of treatment outcomes in this highly vulnerable group of people.
Clinical Implications and Limitations
CLINICAL IMPLICATIONS
-
• Health of the Nation Outcome Scales for People with Learning Disabilities (HoNOS-LD) retains the general structure of the generic HoNOS, and is a clinician-friendly instrument that can be used in routine practice irrespective of professional background.
-
• Ethical objections to randomised control trials with people with learning disabilities mean that outcome measures such as HoNOS-LD will be useful in determining clinical effectiveness.
-
• The global nature of the instrument lends itself to a holistic approach to the health needs of people with learning disabilities, crucial for this most vulnerable group.
LIMITATIONS
-
• The nature of learning disabilities means that there is a greater reliance on informant-based data, leading to greater opportunities for error.
-
• HoNOS-LD relies on an ordinal method of recording mental health status and is therefore limited as a ‘present state’ assessment in a single rating.
-
• The broad nature of HoNOS-LD items may be less well suited to detecting the subtle changes in people with learning disabilities who have chronic conditions.


eLetters
No eLetters have been published for this article.