


An association between schizophrenia and subtle neurological abnormalities has been reported for nearly a century, with intensive study over the past 40 years (Reference Woods, Kinney and Yurgelun-ToddWoods et al, 1986). People with schizophrenia have a high frequency of abnormal subtle neurological findings, also known as neurological soft signs. There may be a genetic origin to neurological abnormalities in schizophrenia, as siblings without the disorder demonstrate a greater incidence of these signs (Reference Kinney, Woods and Yurgelun-ToddKinney et al, 1986; Reference Ismail, Cantor-Graae and McNeilIsmail et al, 1998; Reference Niethammer, Weisbrod and SchiesserNiethammer et al, 2000). Frontal release signs (also known as primitive reflexes) are a subset of neurological soft signs: they consist of a group of involuntary motor responses which are normally found early in postnatal development and are subsequently inhibited, but may be ‘released’ from inhibition by cerebral, usually frontal, damage (Reference Paulson and GottliebPaulson & Gottlieb, 1968; Reference Schott and RossorSchott & Rossor, 2003). Frontal release signs are common in the general population, occurring in roughly a quarter of young healthy adults, and are more common with advancing age (Reference Gladstone and BlackGladstone & Black, 2002). Although a single sign is of limited clinical significance, multiple signs tend to correlate with brain pathology (Reference Isakov, Sazbon and CosteffIsakov et al, 1984; Reference Schott and RossorSchott & Rossor, 2003). In this study we examined a large cohort of people with schizophrenia, their healthy siblings and a healthy non-psychiatric control comparison group to determine the frequency with which frontal release signs occur in these three groups, and specifically to assess the familiality of these signs by comparing the schizophrenia and sibling cohorts. Second, we sought to investigate the association between frontal release signs and cognitive impairment, with a focus on measures of frontal lobe function as well as more general cognitive measures such as full-scale IQ.
METHOD
Data concerning neurological soft signs were collected from 302 people with a diagnosis of schizophrenia or schizoaffective disorder, 240 of their full siblings and 346 members of a healthy control group who had participated in a study of neurobiological phenotypes associated with schizophrenia – the Clinical Brain Disorders Branch/National Institute of Mental Health (NIMH) Sibling Study (Reference Egan, Goldberg and GscheidleEgan et al, 2000). Siblings were excluded if they were diagnosed with schizophrenia or a schizophrenia-spectrum disorder; otherwise, they were included irrespective of their psychiatric status. In a previous analysis of neurological soft signs in our laboratory, 407 out of the 888 participants in this study overlapped (45.8%; Reference Egan, Hyde and BonomoEgan et al, 2001b ). The NIMH institutional review board approved all procedures and testing. Details of recruitment and exclusion criteria have been described previously (Reference Egan, Goldberg and GscheidleEgan et al, 2000). Briefly, families were recruited from local and national sources; the comparison group was recruited from the National Institutes of Health volunteer office and was matched to the sibling group on age, gender, education and performance on the Wide Range Achievement Test (WRAT; Reference Jastak and WilkinsonJastak & Wilkinson, 1984). In order to reduce the sample heterogeneity, only White participants (who were Caucasians of European ancestry) were included in this analysis. All participants were screened to exclude those with a premorbid full-scale IQ below 70, those with recent (within 1 year) significant drug or alcohol misuse or more than 5 years of prior dependence, and those with significant medical or neurological conditions. The healthy control group was selected with the additional requirement that they should not have a first-degree relative with a schizophrenia-spectrum disorder (Reference Egan, Goldberg and GscheidleEgan et al, 2000). All patients were clinically stable, with no psychiatric hospitalisation within 6 months of entry into the study. Written informed consent was obtained after complete description of the study to the participants.
Procedure
All participants were interviewed by a research psychiatrist (masked to family status) using the Structured Clinical Interview for DSM–IV Axis I Disorders (SCID; Reference First, Gibbon and SpitzerFirst et al, 1996). A second research psychiatrist reviewed all diagnostic data and the consensus diagnosis was used. All participants had a thorough medical evaluation, including magnetic resonance imaging of the brain. They were administered an extensive battery of neuropsychological tests as described in detail elsewhere (Reference Weickert, Goldberg and GoldWeickert et al, 2000). These included the short form of the Wechsler Adult Intelligence Scale – Revised (WAIS–R; Reference WechslerWechsler, 1981), a measure of full-scale IQ. The WRAT was administered to assess premorbid IQ. Participants were tested also on a variety of cognitive measures that assay prefrontal function: working memory/executive function was tested with the Wisconsin Card Sorting Test (WCST; Reference HeatonHeaton, 1981) and Letter fluency (Reference Benton, des Hamsher and VarneyBenton et al, 1983); psychomotor speed and oculomotor scanning were tested with Trail making test part B (Reference ReitanReitan, 1986); and working memory/updating was tested with the n-back task (Reference Goldberg, Egan and GscheidleGoldberg et al, 2003) (one-back and two-back) (Reference Egan, Goldberg and GscheidleEgan et al, 2001a ). Demographic data are presented in Table 1.
Table 1 Demographic characteristics of the sample
| Study group | Post hoc analysis | ||||
|---|---|---|---|---|---|
| Index (n=302) | Siblings (n=240) | Controls (n=346) | Index v. siblings P | Index v. controls P | |
| Age, years: mean (s.d.) | 36.5 (9.2) | 37.0 (9.8) | 34.5 (10.6) | NS | <0.05 |
| Gender | |||||
| Male, % | 76.8 | 50.0 | 40.3 | <0.0001 | <0.0001 |
| Education, years: mean (s.d.) | 14.0 (2.3) | 15.8 (2.4) | 16.7 (2.7) | <0.0001 | <0.0001 |
| WAIS full-scale IQ: mean (s.d.) | 93.0 (12.1) | 106.1 (10.4) | 108.0 (8.9) | <0.001 | <0.001 |
| WRAT (premorbid IQ): mean (s.d) | 102.5 (11.3) | 107.4 (9.9) | 109.5 (8.6) | <0.001 | <0.001 |
Participants underwent a detailed neurological examination by one of two research neurologists who were formally masked to diagnosis and familial relationships. Interrater reliability was assessed on 10 participants and revealed that all ratings were significantly correlated (intraclass correlation coefficients 0.54–0.90, P < 0.02). The examination included the Neurological Evaluation Scale (NES; Reference Buchanan and HeinrichsBuchanan & Heinrichs, 1989) scored as previously described (Reference Sanders and KeshavanSanders & Keshavan, 1998). The examiners followed the previously published clinical procedures for assessing each frontal release sign (Reference Paulson and GottliebPaulson & Gottleib, 1968; Reference Ovsiew, Yudofsky and HalesOvsiew, 1997)
Data analyses
The primary outcome measures were the individual and summed frontal release sign scores from the NES (Reference Buchanan and HeinrichsBuchanan & Heinrichs, 1989). For these measures, which are not independent, P=0.05 was accepted as significant. Data analyses were performed using SAS (version 9.1 for Windows). Mean scores were contrasted by mixed model analysis of variance (ANOVA), treating family status as a random effect. In order to investigate the relationships between frontal release signs and cognitive function, the summed frontal release sign scores were calculated from the individual tests of frontal lobe function from the NES: these included ratings of glabellar, suck, snout, and right and left grasp reflexes. Correlations between averages of the total and individual frontal release sign scores were obtained for each diagnostic group (schizophrenia, sibling and healthy control), using Pearson correlation coefficients. When shared environmental factors are not considered causative of a shared trait in family members, relative risk is commonly thought to reflect shared genetic factors. Relative risk was assessed by comparing the proportion of affected individuals in the sibling cohort v. the proportion of affected individuals in the control cohort (‘affected’ was defined by a summed frontal release sign score greater than 1 standard deviation above the control group mean). A chi-squared analysis was performed to test the significance of the relative risk. As an additional test of possible heritability in sibships, an intraclass correlation coefficient was calculated for total frontal release sign scores.
RESULTS
In the schizophrenia cohort the maximum individual frontal release sign score (on a scale of 0–10) was 7, with an average of 1.50 (s.d.=1.58). In the control cohort, the maximum score was 4, with a mean of 0.42 (s.d.=0.77. In the sibling cohort the maximum score was 6, with a mean of 0.54 (s.d.=0.92) (Fig. 1). Using a mixed model ANOVA, contrasting total frontal release sign scores with diagnostic group, the schizophrenia cohort had significantly higher average scores than the control and sibling cohorts (d.f.=746, F=76.26; t=10.77 and t=10.52 respectively; P < 0.0001). The control and sibling cohorts did not differ (t=–1.23; P=0.22). The relative risk was 1.40 (P=0.25 by χ2 analysis), suggesting that frontal release signs are not a strongly familial characteristic in schizophrenia. An alternative method of testing heritability, the intraclass correlation coefficient, was not significant at 0.14 for total frontal release sign score (P=0.98).
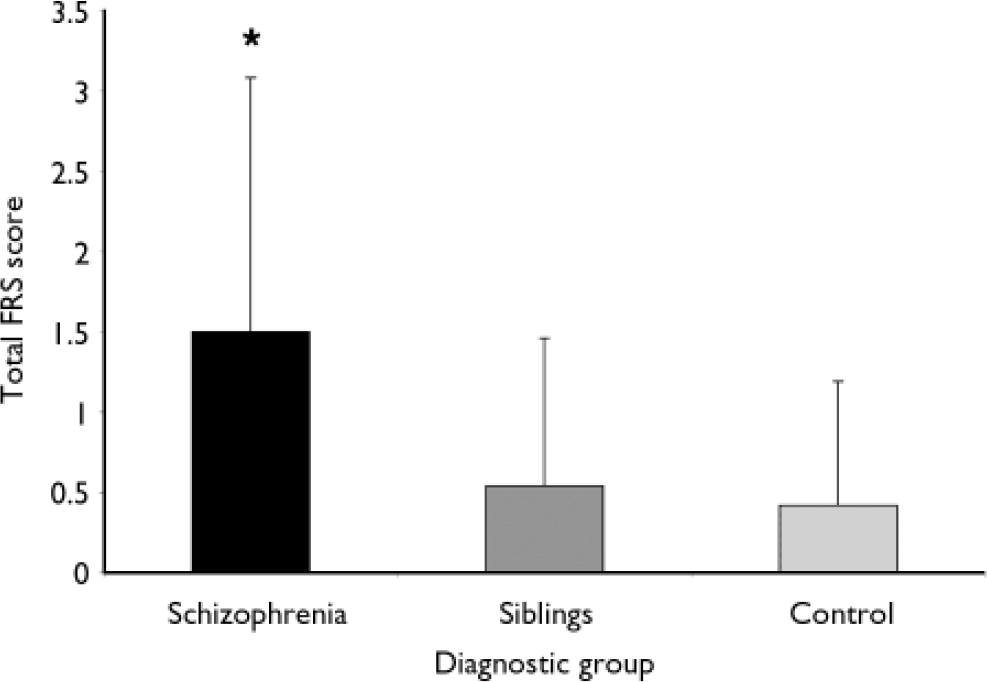
Fig. 1 The participants with schizophrenia had significantly higher total frontal release sign (FRS) scores than either their siblings or a non-related control group of healthy individuals (error bars represent standard deviations).
The schizophrenia cohort had the greatest number of significant correlations between total and individual frontal release sign scores and performance on the neuropsychological testing battery, although all were weak (Table 2). In particular, total and individual frontal release sign scores had highly significant inverse correlations with performance on the WAIS–R full-scale IQ. In fact, if the results are Bonferroni-corrected, the only result that meets the corrected criteria of P < 0.0006 is the correlation between total FRS score and WAIS–R full-scale IQ in the schizophrenia group. Within the uncorrected data-set, in the control group there was a trend towards an inverse correlation between total frontal release sign scores and WAIS–R full-scale IQ (Table 3).
Table 2 Correlations between frontal release sign scores and neuropsychological performance in the schizophrenia group
| Correlation1 | ||||
|---|---|---|---|---|
| Total FRS | Glabellar | R grasp | L grasp | |
| WAIS | -0.199* | -0.121* | -0.183* | -0.146* |
| WCST2 | 0.03 | 0.039 | 0.122 | 0.011 |
| One-back | -0.047 | -0.027 | -0.047 | 0.006 |
| Two-back | -0.134 | -0.096 | -0.11 | -0.06 |
| Trails B | 0.098 | 0.075 | 0.07 | 0.085 |
| Letter fluency | -0.116* | -0.131* | -0.077 | -0.02 |
Table 3 Correlations between frontal release sign scores and neuropsychological performance in the control group
| Correlation | ||||
|---|---|---|---|---|
| Total FRS | Glabellar | R grasp | L grasp | |
| WAIS | -0.109 | -0.04 | -0.078 | -0.129* |
| WCST | 0.137* | 0.049 | 0.181* | 0.179* |
| One-back | -0.066 | -0.101 | -0.019 | 0.029 |
| Two-back | -0.089 | -0.096 | -0.034 | -0.022 |
| Trails B | 0.027 | 0.003 | 0.034 | 0.024 |
| Letter fluency | 0.038 | 0.132* | -0.073 | 0.009 |
For percentage of perseverative errors on the WCST, a number of significant correlations were noted across all three cohorts. In the schizophrenia cohort the presence of a right grasp reflex positively correlated with number of perseverative errors, whereas in the control cohort, total and several individual frontal release sign scores positively correlated with number of perseverative errors. In the sibling cohort, right grasp reflex scores positively correlated with number of perseverative errors (Table 4). Finally, in the sibling cohort there was a positive correlation between left grasp reflex scores and time to complete the Trails B test.
Table 4 Correlations between frontal release sign scores and neuropsychological performance in the siblings group
| Correlation | ||||
|---|---|---|---|---|
| Total FRS | Glabellar | R grasp | L grasp | |
| WAIS | -0.046 | 0.002 | -0.063 | -0.032 |
| WCST | 0.098 | 0.033 | 0.117* | 0.04 |
| One-back | -0.011 | 0.064 | -0.051 | -0.081 |
| Two-back | -0.067 | -0.008 | -0.082 | -0.056 |
| Trails B | 0.077 | 0.02 | 0.095 | 0.108* |
| Letter fluency | 0.05 | 0.047 | 0.03 | 0.019 |
DISCUSSION
Classical clinical–pathological correlations have suggested that frontal release signs in adults are one of the few bedside indices of prefrontal cortical dysfunction. Participants with schizophrenia in our study had a much higher number of frontal release signs on average than controls or their unaffected siblings. This finding is largely in agreement with a number of previous studies (Reference Taylor and AbramsTaylor & Abrams, 1984; Reference Woods, Kinney and Yurgelun-ToddWoods et al, 1986; Reference LiddleLiddle, 1987; Reference Ismail, Cantor-Graae and McNeilIsmail et al, 1998; Reference Sanders and KeshavanSanders & Keshavan, 1998; Reference Egan, Hyde and BonomoEgan et al, 2001b ; Reference Lawrie, Byrne and MillerLawrie et al, 2001; Reference Cuesta, Peralta and ZarzuelaCuesta et al, 2002; Reference Gourion, Goldberger and OlieGourion et al, 2004). In this study, both individual and summed frontal release sign scores showed weak inverse correlations with several neuropsychological measures, including full-scale IQ, and a positive correlation with number of perseverative errors on the WCST (a test of executive function that reliably engages the dorsolateral prefrontal cortex). These findings were most apparent in the schizophrenia group, perhaps as a result of a greater dynamic range in frontal release sign and cognitive scores.
The greater number of frontal release signs in people with schizophrenia compared with siblings and normal controls was reported previously (Reference Ismail, Cantor-Graae and McNeilIsmail et al, 1998). In fact, a grouping of neurological soft signs that included frontal release signs, abnormalities in eye movements and short-term memory deficits differentiated people with schizophrenia from a healthy control group better than any other sub-scale from the Neurological Evaluation Score (Reference Arango, Bartko and GoldArango et al, 1999). Both genetic and environmental factors have been cited as the cause of neurological soft signs in schizophrenia; in these studies frontal release signs were subsumed within a larger set of clinical measures (neurological soft signs) and were not examined independently (Reference Ismail, Cantor-Graae and McNeilIsmail et al, 1998; Reference Egan, Hyde and BonomoEgan et al, 2001b ).
Neurological soft signs previously have been associated with cognitive impairment (Reference Taylor and AbramsTaylor & Abrams, 1984; Reference LiddleLiddle, 1987; Reference Schonfeld, Shaffer and BarmackSchonfeld et al, 1989; Reference Cuesta, Peralta and ZarzuelaCuesta et al, 2002), including a propensity towards lower IQ (Reference Obiols, Serrano and CaparrosObiols et al, 1999; Reference Fellick, Thomson and SillsFellick et al, 2001) and a poor long-term functional outcome in first-episode patients (Reference Johnstone, Macmillan and FrithJohnstone et al, 1990). Patients with schizophrenia who had a higher number of soft signs had lower IQ (Reference KennardKennard, 1960; Reference Mosher, Pollin and StabenauMosher et al, 1971; Reference Marcus, Hans and ByhouwerMarcus et al, 1985) and deficits on measures of executive function such as working memory, learning and attention (Reference Saykin, Gur and GurSaykin et al, 1991; Reference Franke, Maier and HainFranke et al, 1992; Reference BraffBraff, 1993; Reference Paulsen, Heaton and SadekPaulsen et al, 1995). Neuroanatomically, soft signs have been associated with regional grey-matter volume changes that may be an index of perturbed cortical–subcortical connectivity (Reference Dazzan, Morgan and OrrDazzan et al, 2004). Although not specific to schizophrenia, neurological soft signs appear to be an intrinsic element of this disorder and have a negative connotation with respect to illness severity.
Heritability of frontal release signs
There is a suggestion of the heritability of neurological soft signs in general, when studying people with schizophrenia and their non-affected siblings (Reference Egan, Hyde and BonomoEgan et al, 2001b ; Gourion et al, Reference Gourion, Goldberger and Bourdel2003; Reference Gourion, Goldberger and Olie2004). Some-what unexpectedly, frontal release signs do not appear to share the same characteristic, at least when siblings are compared with healthy controls using a chi-squared analysis of relative risk. Moreover, the intraclass correlation coefficient also was not significant. This suggests that environmental factors may have a significant role in the development of frontal release signs, and by extension, some aspects of frontal pathology in schizophrenia. It should be noted, however, that our study rigorously excluded siblings with schizophrenia and schizophrenia-spectrum disorders.
The notion that neurological abnormalities in schizophrenia might be due to genetic factors came from studies that found a higher incidence of these abnormalities in family members without schizophrenia of patients with this disorder (Reference Ismail, Cantor-Graae and McNeilIsmail et al, 1998; Reference Niethammer, Weisbrod and SchiesserNiethammer et al, 2000). However, the genetic contribution to the liability towards the development of neurological abnormalities in schizophrenia is modest at best (Reference Kinney, Woods and Yurgelun-ToddKinney et al, 1986; Reference Rossi, De Cataldo and Di MicheleRossi et al, 1990; Reference Ismail, Cantor-Graae and McNeilIsmail et al, 1998; Reference Niethammer, Weisbrod and SchiesserNiethammer et al, 2000; Reference Egan, Hyde and BonomoEgan et al, 2001b ). In our study we also found very modest evidence of the heritability of frontal release signs, as measured by relative risk or intraclass correlation. The greater incidence of frontal release signs in people with schizophrenia compared with their non-affected siblings suggests a significant role for environmental factors. Alternatively, in any given individual, genetic susceptibility to schizophrenia is probably secondary to the interaction of polymorphisms in several genes with small interacting effects, acting in conjunction with the effects of environmental factors (Reference Wildenauer, Hallmayer and SchwabWildenauer et al, 1996; Reference Harrison and WeinbergerHarrison & Weinberger, 2005). People with schizophrenia most probably have both a much greater genetic load and a greater exposure to predisposing environmental factors than their non-affected siblings. Hence, the lack of heritability of frontal release signs may reflect the effects of these genetic–environmental interactions.
Frontal release signs and cognitive impairment
In general our correlation between the presence of frontal release signs and poor performance on neuropsychological tests of prefrontal function in schizophrenia agrees with previous reports. However, previous studies differ in some of the details of the findings from our study. One group found that frontal release sign scores correlated with a higher number of random errors but not with perseverative errors on the WCST in people with schizophrenia (Reference Wong, Voruganti and HeslegraveWong et al, 1997). In two studies, global scores of neurological soft signs correlated with perseverative errors on the WCST in schizophrenia, but frontal release signs were not specifically examined (Reference Braun, Lapierre and HodginsBraun et al, 1995; Reference Mohr, Hubmann and AlbusMohr et al, 2003). Poor performance by people with schizophrenia on the WCST (as measured by achieved categories) directly correlated with a greater number of neurological soft signs (Reference Bersani, Clemente and GherardelliBersani et al, 2004). Most studies of frontal release signs have relied upon much smaller samples and therefore have less statistical power than our study. Moreover, most studies of the relationship between neurological abnormalities and prefrontal dysfunction in schizophrenia have not examined frontal release signs separately from other neurological soft signs.
The inverse correlation between full-scale IQ and frontal release signs in schizophrenia is the clearest result in our data. In fact, this is the only correlation that withstands a rigorous Bonferroni correction. This suggests that at least in this sample frontal release signs implicate a more widespread pathology of higher cortical systems. Barnes et al (Reference Barnes, Crichton and Nelson1995) measured frontal release sign scores and performance on the WAIS–R in people with schizophrenia: no significant correlation was found, but the total sample size of 48 gave limited power. Two studies have reported an inverse relationship between high scores on more broad-based measures of neurological soft signs and low scores on IQ tests. Neither of these studies evaluated the participants for the presence of frontal release signs; instead, they relied upon other neurological soft signs (Reference Obiols, Serrano and CaparrosObiols et al, 1999; Reference Fellick, Thomson and SillsFellick et al, 2001). Mohr et al (Reference Mohr, Hubmann and Albus2003) found that overall neuropsychological performance inversely correlated with the total score on a battery of neurological soft signs. However, that study did not assay frontal release signs. They did note that higher soft sign scores inversely correlated with a number of sub-tests from the WAIS–R. In general, our findings agree with these previous reports.
Side-effects of antipsychotics might account for our findings. However, similar neurological abnormalities have been noted in schizophrenia for nearly a century, decades before the introduction of antipsychotic therapy (Reference Bleuler and ZinkinBleuler, 1950; Reference Kraepelin, Barclay and RobertsonKraepelin, 1971). Other studies support the notion that neurological soft signs are an intrinsic part of schizophrenia rather than a direct or indirect consequence of treatment (Reference Johnstone, Macmillan and FrithJohnstone et al, 1990; Reference Gupta, Andreasen and ArndtGupta et al, 1995; Reference Browne, Clarke and GervinBrowne et al, 2000; Reference Mohr, Hubmann and AlbusMohr et al, 2003; Reference Dazzan, Morgan and OrrDazzan et al, 2004). Neurological soft signs and frontal release signs are common in first-episode schizophrenia (Reference Browne, Clarke and GervinBrowne et al, 2000); in fact it has been reported that frontal release signs are more common in people with schizophrenia who have never been treated with antipsychotics than in treated patients (Reference Gupta, Andreasen and ArndtGupta et al, 1995). In addition, unmedicated participants at high risk of schizophrenia have more neurological soft signs than healthy control individuals (Reference Lawrie, Byrne and MillerLawrie et al, 2001). These findings suggest that exposure to antipsychotics is not necessary for the appearance of neurological soft signs in general and frontal release signs in particular. In addition, both typical (Reference Mishara and GoldbergMishara & Goldberg, 2004) and atypical (Reference Weickert, Goldberg and MarencoWeickert et al, 2003) antipsychotics may sometimes improve cognitive performance, militating against antipsychotics as a cause. As a whole, the preponderance of the findings in the psychiatric literature makes it highly unlikely that the findings in our study are solely directly attributable to the deleterious effects of antipsychotic medications.
In summary, people with schizophrenia had more frontal release signs than their siblings or the control group. In the schizophrenia group both individual and summed frontal release sign scores inversely correlated with several neuropsychological measures, including full-scale IQ and the number of perseverative errors on the WCST (a relatively selective test of prefrontal function). Although these findings were most apparent in the participants with schizophrenia, perhaps as a result of a greater range in frontal release sign scores, a trend for similar relationships was also seen in the control group. This suggests that frontal release signs are at best a weak index of prefrontal cognitive dysfunction, particularly in schizophrenia, but also in healthy individuals.
Acknowledgements
This research was supported in its entirety by the intramural research programme of the National Institute of Mental Health. The authors would also like to thank the clinical staff of the Clinical Brain Disorders Branch, Genes, Cognition and Psychosis Program, for their efforts in patient recruitment and characterisation, and Dr Llewellyn Bigelow in particular for his efforts in clinical diagnosis.


eLetters
No eLetters have been published for this article.