


Mental health services research must attempt to balance the merits of rigorous scientific studies of treatment efficacy against relevant and generalisable studies of clinical effectiveness (Reference Thornicroft, Strathdee and PhelanThornicroft et al, 1998). The UK700 trial of intensive case management v. standard case management for psychotic illness compared different levels of case-load and demonstrated no significant differences in mean hospitalisation over 2 years of follow-up analysed by intention to treat (Reference Burns, Creed and FahyUK700 Group, 1999). However, not all patients received extensive exposure to intensive case management, either because they remained in hospital or prison for extensive periods or because they were lost to follow-up during the study period. We tested whether there were identifiable patient characteristics associated with shorter exposure to case management. We then compared the main trial outcomes (hospitalisation and total treatment costs) between patients who were exposed to intensive case management for more than 50% of the study period (12 months) and those exposed to more than 12 months of standard case management. To reduce possible selection bias we adjusted for patient characteristics associated with exposure to case management.
METHOD
A total of 708 persons with severe psychotic illnesses, in four inner-city areas, were randomly allocated by an independent statistical centre to either intensive case management (1:10-15 case-load) or standard case management (1:30-35 case-load). They were comprehensively assessed on a range of clinical and social functioning measures at baseline and at 1- and 2-year follow-up by independent researchers (Reference Burns, Creed and FahyUK700 Group, 1999).
Information on the use of all hospital and community services was collected for each patient over the 2-year follow-up period. A number of sources were used, including event records of community mental health team activities, clinical records, patient interview at 1- and 2-year follow-up, local authority social services departments, and questionnaires completed by case managers. Where possible, unit costs were calculated on the basis of information provided by the relevant local service providers. Unit costs of services that could not be determined locally and those of relatively small service components were taken from national publications. All unit costs were calculated for the financial year 1997/8 and future costs were discounted at an annual rate of 6% (UK700 Group, 2000).
Identification of non-exposure
Patients could fail to receive their allocated form of case management (whether intensive or standard case management) for any one or a combination of three reasons: prolonged in-patient stay, prison, or loss of contact through refusal, changing address or — in a few cases — where major changes in their clinical condition required transfer to another service (e.g. transfer to secure services after a violent offence, or transfer to a rehabilitation team when schizophrenia had become complicated by a stroke requiring residential care). The actual dates when patients dropped out of contact and (where applicable) resumed contact were recorded by case managers. Duration of in-patient and prison stays, however, were obtained directly from the modified World Health Organization life chart (World Health Organization, 1992) at the 24-month follow-up. Although the duration of these stays was accurately recorded, their dates were not. To deal consistently with these two types of data we developed a convention for computing ‘days unexposed in the community’. We assumed that:
-
(a) time in hospital never coincided with time in prison;
-
(b) time in prison always occurred after drop-out from case management;
-
(c) where patients were lost to contact during follow-up, time spent in hospital was equally distributed before and after drop-out.
Total days unexposed to case management were the sum of days in hospital, days in prison and days unexposed in the community.
Associations with baseline variables
In testing for identifiable patient characteristics associated with shorter exposure to case management, we considered the baseline variables used in the original outcome study: age, gender, centre, ethnic group, father's occupation at birth; months since onset, point of entry (in-patient or out-patient), days in hospital over the previous 2 years; scores on the Comprehensive Psychopathological Rating Scale (Reference Asberg, Montgomery and PerrisAsberg et al, 1978), Disability Assessment Scale (Reference Jablensky, Schwartz and TomovJablensky et al, 1980), Lancashire Quality of Life Profile (Reference Oliver, Huxley and PriebeOliver et al, 1997) and Camberwell Assessment of Need (Reference Phelan, Slade and ThornicroftPhelan et al, 1995) (unmet needs) scores; and user satisfaction (Reference Burns, Creed and FahyUK700 Group, 1999). These variables were entered into multiple regression analyses in which the outcomes were the numbers of days unexposed overall and in each category (in-patient, in jail, unexposed in the community). Any variable that was significant at the 10% level for any one outcome was included in the models for all four outcomes. Randomised allocation was not significant at this level for any outcome.
Estimated intervention effect
We estimated the effects of intensive case management compared with standard case management in patients who were exposed for at least 50% of the follow-up period. This is not a comparison between randomised groups, and thus there is potential for selection bias if the groups differ in terms of baseline factors that might influence the outcome of the evaluation. To reduce selection bias we adjusted for the baseline variables that predicted days exposed, singly and jointly. Dummy variables for missing baseline variables were used to keep the sample size the same in all these analyses. Costs were highly skewed so bootstrap methods were used to check the validity of the confidence intervals (Reference Efron and TibshiraniEfron & Tibshirani, 1993); these gave similar results to standard methods, so the latter are reported.
RESULTS
Distribution of exposure
Of the 708 patients randomised into the UK700 trial, 679 had useable 2-year hospitalisation data and could be entered into this study. Of these, 84 (12.4%) were exposed to case management for under 50% of the follow-up period (Fig. 1).
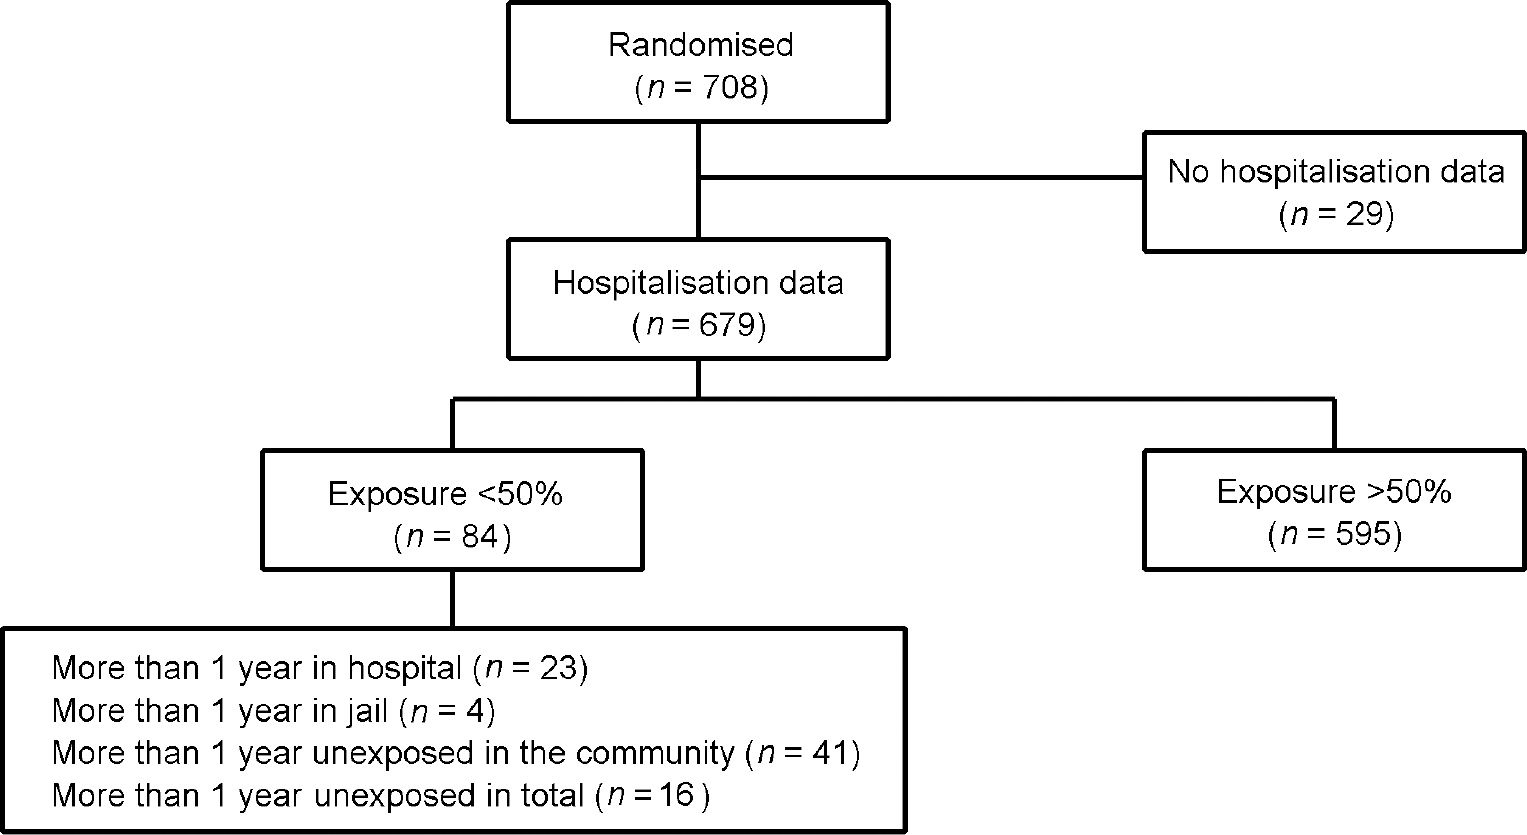
Fig. 1 Exposure to treatment in the UK700 trial: study profile.
Figure 2 displays the rates of unexposure by site, type of case management and cause. It can be seen that there are marked variations in the proportions of patients unexposed in the community across the sites. St Mary's had almost no patients unexposed in the community in either intensive or standard case management, while at the other extreme nearly 20% of King's College intensive case management patients were unexposed in the community. In the regression analyses (Table 1), these differences between centres are statistically significant both for all days unexposed and for days unexposed in the community, after adjusting for other predictors of exposure.
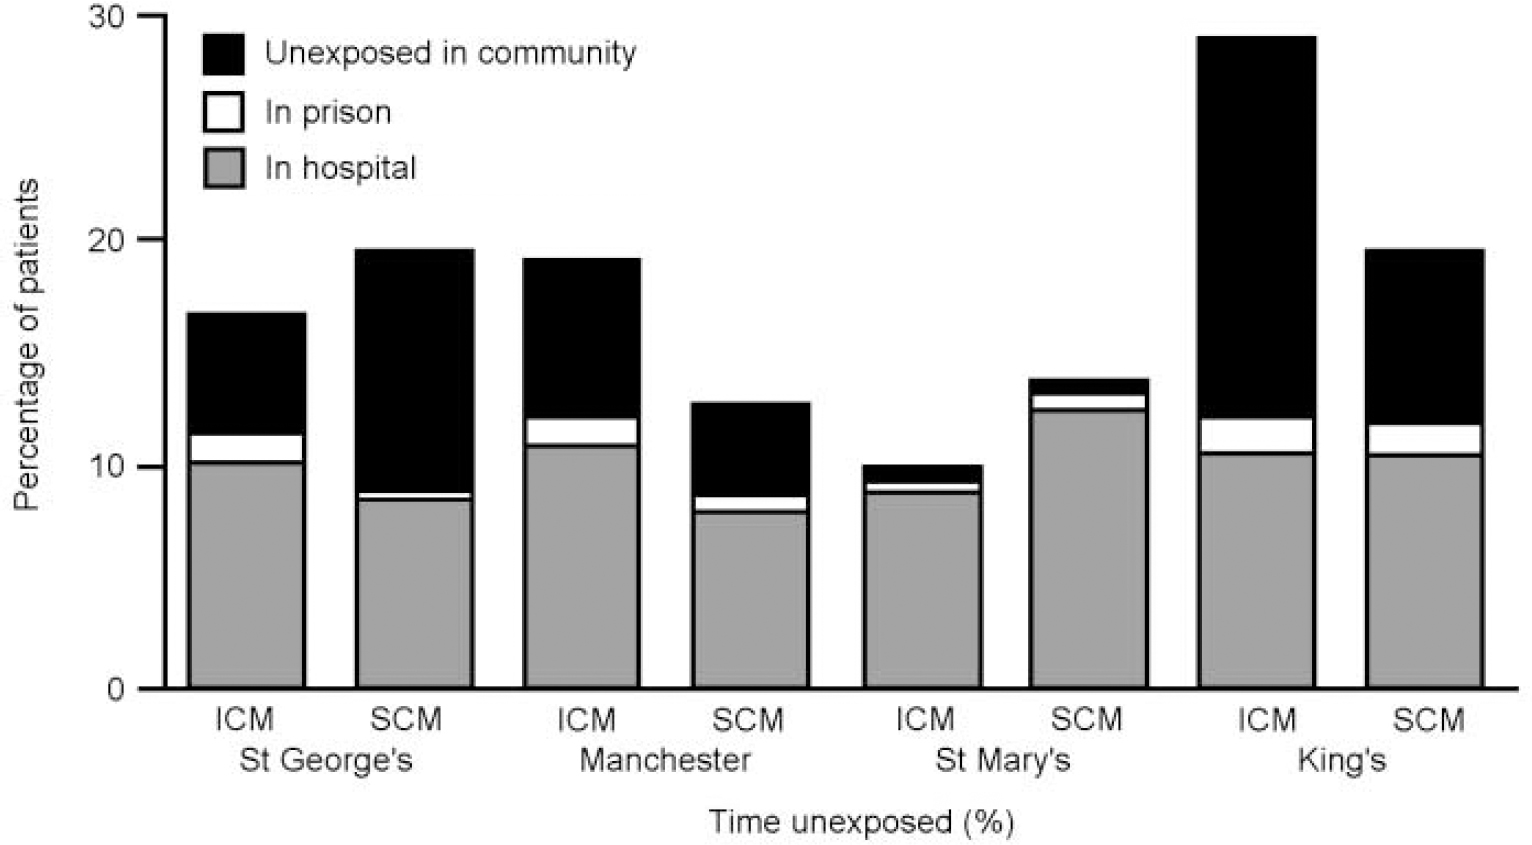
Fig. 2 Rates of unexposure by cause and by centre. ICM, intensive case management; SCM, standard case management.
Table 1 Multiple regression of days unexposed on baseline variables1

| All days unexposed | Days unexposed because of hospitalisation | Days unexposed because of prison | Days unexposed in the community | |||||||||
|---|---|---|---|---|---|---|---|---|---|---|---|---|
| β | 95% CI | P | β | 95% CI | P | β | 95% CI | P | β | 95% CI | P | |
| Centre | < 0.001 | 0.97 | 0.62 | < 0.001 | ||||||||
| St George's | 0 | 0 | 0 | 0 | ||||||||
| Manchester | -24.3 | -62.6 to 13.9 | -3.7 | -28.4 to 21.1 | -1.4 | -11.5 to 8.8 | -19.3 | -48.3 to 9.6 | ||||
| St Mary's | -56.7 | -92.3 to -21.0 | -0.3 | -23.3 to 22.8 | -1.0 | -10.5 to 8.5 | -55.4 | -82.4 to -28.4 | ||||
| King's | 29.7 | -8.3 to 67.8 | -5.0 | -29.6 to 19.7 | 4.9 | -5.2 to 15.0 | 29.8 | 1.0 to 58.6 | ||||
| Age (per added year of age) | -2.3 | -3.9 to -0.6 | 0.006 | -1.9 | -2.9 to -0.8 | < 0.001 | -0.4 | -0.9 to 0.0 | 0.04 | 0.1 | -1.2 to 1.3 | 0.91 |
| Gender (female v. male) | 20.5 | -6.4 to 47.4 | 0.14 | 6.7 | -10.6 to 24.1 | 0.45 | -9.3 | -16.5 to -2.2 | 0.01 | 23.1 | 2.7 to 43.4 | 0.03 |
| Recruitment (in-patient v. community) | 53.3 | 25.7 to 80.8 | < 0.001 | 28.4 | 10.6 to 46.2 | 0.002 | 2.4 | -4.9 to 9.7 | 0.52 | 22.5 | 1.6 to 43.3 | 0.04 |
| Previous hospitalisation (per added day, in preceding 2 years) | 0.3 | 0.2 to 0.4 | < 0.001 | 0.3 | 0.2 to 0.4 | < 0.001 | 0.0 | -0.1 to 0.0 | 0.23 | 0.0 | -0.1 to 0.1 | 0.52 |
| Clinical Status (CPRS) (per added point, sum total) | 0.5 | -0.7 to 1.7 | 0.41 | 1.1 | 0.3 to 1.9 | 0.005 | -0.6 | -0.9 to -0.3 | < 0.001 | 0.0 | -0.9 to 0.9 | 0.93 |
| Quality of life (per added point, global rating) | 8.1 | -11.9 to 28.1 | 0.43 | 11.3 | -1.7 to 24.2 | 0.09 | -9.4 | -14.7 to -4.1 | 0.001 | 6.2 | -9.0 to 21.3 | 0.42 |
| Time since illness onset (per added month) | 0.0 | -0.2 to 0.2 | 0.92 | 0.1 | 0.0 to 0.2 | 0.14 | 0.0 | 0.0 to 0.1 | 0.18 | -0.1 | -0.2 to 0.0 | 0.07 |
| Mean | 124.8 | 73.3 | 5.9 | 45.6 | ||||||||
| Standard deviation | 180.9 | 117.8 | 45.4 | 133.8 | ||||||||
Baseline associations with non-exposure
The multivariate analysis identified several further independent predictors of exposure (Table 1). Younger patients had significantly more time unexposed because of being in hospital or in prison. Men had greater exposure overall because they were less likely to be lost to contact, despite spending more time in prison on average. Patients with longer periods of hospitalisation in the 2 years before the randomisation tended to have further prolonged hospitalisation, as did those recruited to the study from hospital rather than from team community case-loads. Patients recruited at discharge from in-patient care also had more loss to contact in the community. Patients who were more symptomatic at recruitment spent more time in hospital and less time in prison than those who were less symptomatic. A higher reported baseline quality of life was associated with significantly less time in prison.
Intervention effects
Table 2 lists the differences between the mean hospital days in intensive case management and standard case management for the 679 patients in the intention-to-treat analysis and for the 595 patients who had been exposed to more than 12 months in the community. In the intention-to-treat analysis, intensive case management patients had a mean of 0.4 more days in hospital over the 2-year follow-up. For those with more than 50% exposure, intensive case management patients spent a mean of 11.3 days less in hospital during follow-up. Neither of these differences was significant, although that for the exposed patients did show a trend towards significance.
Table 2 Effect of intensive case management in patients with more than 50% exposure to case management: various adjustments
| Patients (n) | Intensive case management minus standard case management | |||
|---|---|---|---|---|
| Estimate | 95% CI | P | ||
| Days in hospital over 2 years | ||||
| All patients | 679 | 0.4 | -17.4 to 18.1 | 0.97 |
| Patients with > 50% exposure | ||||
| Unadjusted | 595 | -11.3 | -24.5 to 1.9 | 0.09 |
| Adjusted for baseline variables | ||||
| Centre | 595 | -11.2 | -24.4 to 2.0 | 0.10 |
| Age | 595 | -10.5 | -23.7 to 2.7 | 0.12 |
| Gender | 595 | -11.5 | -24.7 to 1.7 | 0.09 |
| Point of entry | 595 | -11.0 | -24.0 to 2.0 | 0.10 |
| Hospitalisation | 595 | -8.6 | -21.4 to 4.1 | 0.18 |
| CPRS | 595 | -12.4 | -25.6 to 0.7 | 0.06 |
| Quality of life | 595 | -11.5 | -24.7 to 1.7 | 0.09 |
| Time since onset | 595 | -10.4 | -23.6 to 2.9 | 0.13 |
| All the above variables | 595 | -9.4 | -22.1 to 3.2 | 0.14 |
| Costs (£) | ||||
| All patients | 667 | 1849 | -1605 to 5304 | 0.29 |
| Patients with > 50% exposure | ||||
| Unadjusted | 593 | 173 | -2951 to 3296 | 0.91 |
| Adjusted for baseline variables | ||||
| Centre | 593 | 208 | -2918 to 3333 | 0.90 |
| Age | 593 | 399 | -2715 to 3513 | 0.80 |
| Gender | 593 | 231 | -2888 to 3351 | 0.88 |
| Point of entry | 593 | 208 | -2909 to 3325 | 0.90 |
| Hospitalisation | 593 | 1118 | -1759 to 3994 | 0.45 |
| CPRS | 593 | -192 | -3311 to 2927 | 0.90 |
| Quality of life | 593 | 182 | -2929 to 3292 | 0.91 |
| Time since onset | 593 | 149 | -2992 to 3291 | 0.93 |
| All the above variables | 593 | 720 | -2151 to 3590 | 0.62 |
Adjusting for previous hospitalisation in a regression analysis reduced this difference from 11.3 days to 8.6 days (Table 2). Adjusting for other baseline variables had little impact. After adjustment for all baseline variables simultaneously, patients in the intensive case management arm spent a mean of 9.4 days less in hospital, but with a 95% confidence interval extending from 22.1 days less to 3.2 days more. None of the adjustments was clinically significant. Costs were higher by an average of £173 in patients who had been exposed to more than 12 months in the community, and £ 720 after adjustment for baseline variables. None of these differences was statistically significant.
DISCUSSION
Impact of excluding non-exposed patients
In response to the publication of the outcome of the UK700 trial (Reference Burns, Creed and FahyUK700 Group, 1999), various concerns were expressed about whether the patients had or had not been exposed to adequate differences in care to test the main hypothesis (Reference McGovern and OwenMcGovern & Owen, 1999; Reference Pelosi, Duncan and McNultyPelosi et al, 1999; Reference DodwellDodwell, 2001). In a previous paper we have demonstrated that the process of care was significantly different in the two arms (Reference Burns, Fiander and KentBurns et al, 2000). The differences between the mean and median hospitalisation reported in the outcome paper reflected the skewed hospitalisation data, with a small number of patients who remained as inpatients for most of the study. In this paper we have examined whether a possible effect of intensive case management in reducing hospitalisations was being masked by the distorting effect of this patient group. Their exclusion results in a non-significant mean advantage to intensive case management of just over 9 days over the 2 years. The original conclusion that simply reducing case-load size does not reduce hospitalisation over the 2-year follow-up is confirmed, and the difference between this result and the intention-to-treat result is most probably due to chance. Similarly, differences in costs remained non-significant, although the greater expense in the intensive group was reduced by more than 50% after adjustment for baseline variables.
Selection bias
Analyses other than intention-to-treat should always be viewed with caution, since they are prone to selection bias. We attempted to reduce selection bias by adjusting for baseline variables, but bias could still remain owing to other unmeasured factors which differed between the exposed groups in the two arms. However, our results agree closely with a comparison of median hospitalisations. The primary analysis compared mean hospitalisations, because the investigators believed that the most likely effect of intensive case management would be to shorten the longer hospital stays with less impact on shorter stays (Reference Burns, Creed and FahyUK700 Group, 1999). It would appear that the main effect of our analysis is to reduce the impact of the few patients with very long hospitalisations on a comparison of mean hospitalisation. There is a need for a simple form of analysis that is appropriate for interventions expected to have their main impact on longer hospital stays but not on the very longest stays.
Site variations
There were interesting differences in the causes of non-exposure in the 84 patients. Of these, 57 were ‘unexposed in the community’. This usually means that the case managers were unable to maintain contact with them because the patient either moved away or consistently refused contact. This category of patients demonstrated marked variation across the four sites, which is hard to explain. From examination of contact frequency data (Reference Burns, Fiander and KentBurns et al, 2000), it appears that at least three of the sites had different expectations of contact frequency and therefore different thresholds for deciding that a patient was lost to contact. In particular, the St Mary's team demonstrated lower rates of contact than the King's College or St George's teams, possibly explaining why they identified fewer patients lost to contact. The original study protocol enjoined teams to keep patients in their treatment of randomisation for the whole 2 years if possible. Days unexposed in the community were also associated with being male and having been recruited from hospital across the four sites.
Baseline characteristics
Younger patients were significantly more likely to remain in hospital for longer periods or to be imprisoned. For each year of increasing age patients spent a mean of 1.9 days less in hospital and 0.5 days less in prison over the 2 years. Duration of hospitalisation in the 2 years prior to randomisation, not surprisingly, also predicted increased hospitalisation during follow-up and indeed increased costs (Reference Byford, Barber and FianderByford et al, 2001). Days unexposed because of prison were, predictably, highly associated with being male and also with being less ill at baseline. They were also associated with a worse subjective quality of life at intake.
Overall, this study sustains the conclusions of the main outcome paper (Reference Burns, Creed and FahyUK700 Group, 1999) that a reduced case-load size alone is not significantly associated with a reduced need for hospitalisation. It confirms that previous hospitalisation is a strong predictor of subsequent protracted hospitalisation, as is recruitment from in-patient care. Power calculations for future studies which may recruit such patients should allow for the likelihood that they will experience less benefit from any case management intervention. Identifying the optimal clinical profile for patients likely to benefit from intensive case management remains a pressing need for further studies.
CLINICAL IMPLICATIONS
-
▪ Despite controlling for severe ‘outliers’ a reduction in case-load size alone still does not lead to reduced hospitalisation.
-
▪ Recruitment to community studies needs to control for past hospital care and source of sample.
-
▪ In-patient costs continue to influence community studies disproportionately.
LIMITATIONS
-
▪ There are substantial variations by study site which remain unexplained.
-
▪ The exact dates of drop-out from care are difficult to determine and require conventions for their estimation.
-
▪ Analyses other than intention-to-treat should always be viewed with caution, since they are prone to selection bias.
Acknowledgements
The UK700 Group is a collaborative study team involving four clinical centres: Manchester Royal Infirmary: Tom Butler, Francis Creed, Janelle Fraser, Peter Huxley, Nicholas Tarrier and Theresa Tattan; King's/Maudsley Hospital, London: Tom Fahy, Catherine Gilvarry, Kwame McKenzie, Robin Murray, Jim van Os and Elizabeth Walsh; St Mary's Hospital/St Charles Hospital, London: John Green, Anna Higgit, Elizabeth van Horn, Catherine Manley, Patricia Thornton and Peter Tyrer; St George's Hospital, London: Robert Bale, Tom Burns, Matthew Fiander, Kate Harvey, Andy Kent and Chiara Samele; Centre for Health Economics, York: Sarah Byford and David Torgerson; London (Statistics): Simon Thompson (Royal Postgraduate Medical School) and Ian White (London School of Hygiene and Tropical Medicine).


eLetters
No eLetters have been published for this article.