


Economic modelling studies comparing selective serotonin reuptake inhibitors (SSRIs) and tricyclic antidepressants (TCAs) have usually found in favour of SSRIs (Reference Hatziandreu, Brown and RevickiHatziandreu et al, 1994; Reference StewartStewart, 1994; Reference Einarson, Arikian and SweeneyEinarson et al, 1995; Canadian Coordinating Office for Health Technology Assessment, 1997; Reference Doyle, Casciano and ArikianDoyle et al, 2001) but often rely on estimates of resource costs. Varying assumptions used greatly affects the conclusions (Reference Jonsson and BebbingtonJonsson & Bebbington, 1994; Reference Woods and RizzoWoods & Rizzo, 1997). Three studies collected primary resource use and outcome data. A naturalistic study in the USA by Simon et al (Reference Simon, von Korff and Heiligenstein1996) found that higher costs for fluoxetine were balanced by fewer hospital costs compared with TCA treatment, but analysed cost-consequences, not cost-effectiveness. A Czech study (Reference Hosak, Tuma and HanusHosak et al, 2000) found similar results, but outcome was limited to days free from hospitalisation. Forder et al (Reference Forder, Kavanagh and Fenyo1996) estimated cost-effectiveness in UK primary care, suggesting that sertraline was more cost-effective than TCAs, but used a quasi-experimental design and estimated outcomes retrospectively. There was therefore a clear need for a prospective cost-effectiveness comparison of these antidepressants in UK primary care.
METHOD
We aimed to compare the cost-effectiveness (cost per depression-free week) and cost-utility (cost per quality-adjusted life-year) of TCAs, SSRIs and lofepramine as recommended first-choice antidepressants in primary care, adopting a health service perspective. We included lofepramine as a third option frequently prescribed as a tolerable, safer alternative to the older TCAs. A pragmatic, open-label, three-arm randomised trial was designed, aimed at recruiting a representative sample of patients presenting to primary care with a new episode of depression.
Ethics committee approval
Ethics committee approval was granted by the South West Multicentre Ethics Committee and subsequently by local research ethics committees covering Hampshire, East Dorset, Wiltshire, West Sussex and South West Surrey.
Inclusion and exclusion criteria
All adults diagnosed with depression by their general practitioner and accepting antidepressant treatment were eligible, including those with comorbid physical or mental illness and those aged over 65 years. Those already taking antidepressants, under 18 years old, pregnant, breast-feeding, terminally ill, confused, with insufficient English language skills or temporarily resident were excluded. Patients who were prescribed antidepressants for indications other than depression (e.g. chronic pain) were excluded.
Randomisation
The researchers visited patients within a few days of referral, usually at the patient's home, gave information about the study, and sought written consent. Consenting patients were randomly allocated to a recommended first-choice class of antidepressant, either a TCA (choice of amitriptyline, dosulepin or imipramine), or an SSRI (fluoxetine, sertraline or paroxetine), or lofepramine. Remote telephone randomisation was carried out by the University of York service. Randomisation was stratified by referring general practitioner, on the basis that one doctor's referrals might differ systematically in severity, or in other ways, from another's.
Partial preference design
A partial preference design was used to minimise the effect of treatment choice on recruitment, and allow assessment of the effect of receipt of preferred treatment on outcome. Patients were informed at recruitment that, following randomisation, treatment could be prescribed from a different class to the one allocated at random, if they or their doctor preferred an alternative, in a preference group. The main analysis was conducted on an intention-to-treat basis. Sensitivity analyses were carried out including only those who actually received an initial prescription from the randomised class.
Treatments
All treatments were prescribed by the general practitioners in order to keep care close to normal, and could be changed as clinically indicated, including switching class of antidepressant. Doctors were asked to prescribe using British National Formulary recommended dosages (see Appendix; British Medical Association & Royal Pharmaceutical Society of Great Britain, 2001) and to continue treatment for 6 months after remission of the depressive episode, or for at least 12 months if the patient had experienced two or more depressive episodes within the past 5 years.
Outcome measures
All outcome measures were self-completed, to avoid interviewer bias, as it was impossible to mask the researchers to group allocation. Follow-up was initially planned using 12 postal questionnaires at monthly intervals, but 13 months into recruitment the monthly questionnaires at 2, 4, 5, 7, 8 and 11 months were dropped because the response rates were low, and outcome data were collected instead through face-to-face contacts at 6 months, 9 months and 12 months, which improved response rates.
The primary outcome was the number of weeks free from depression, defined as a score of below 8 on the Hospital Anxiety and Depression Scale – Depression subscale (HADS–D; Reference Zigmond and SnaithZigmond & Snaith, 1983), the threshold for ‘possible major depressive disorder’. Linear interpolation of missing values was used, but there was no extrapolation beyond the last observation. An alternative definition of ‘depression-free’ was employed in a sensitivity analysis using a cut-off HADS–D score of below 11 (threshold for ‘probable major depressive disorder’). A wider range of psychiatric symptoms was assessed using the computerised (PROQSY) version of the Clinical Interview Schedule – Revised (CIS–R; Reference Lewis, Pelosi and ArayaLewis et al, 1992). Psychiatric diagnoses were generated at baseline by means of the CIS–R algorithm used in the Office of Population Censuses and Surveys national psychiatric morbidity survey (Reference Meltzer, Gill and PetticrewMeltzer et al, 1994). Generic health status was measured using the 36-item Medical Outcomes Study Short Form (SF–36; Reference Ware, Snow and KosinskiWare et al, 1993). For the estimation of quality-adjusted life-years (QALYs; see below), utility was measured using the EuroQol EQ–5D questionnaire (EuroQol Group, 1990). Patients’ use of health and social services between follow-up points was recorded on a schedule specifically designed for the study.
Cost data
Patients’ practice records were examined at the end of the 12-month follow-up period to estimate total health and social service resource use, including all medications prescribed and their duration. Additional use of resources identified from patients’ self-reports was added to the medical record data.
Analysis of clinical outcomes
Repeated-measures analysis of variance (ANOVA) using generalised linear modelling was used to test the significance of differences between groups in the number of depression-free weeks, adjusting for baseline HADS–D score. This assumed that missing data were ‘missing at random’, and used all the available data to estimate the number of depression-free weeks expected if all patients with post-baseline HADS–D scores completed all 12 months of follow-up. Other comparisons between the three groups used the Kruskal–Wallis test.
Sample size calculation
We aimed to power the study to be able to demonstrate equivalence of total costs, based on data from the study by Simon et al (Reference Simon, von Korff and Heiligenstein1996); if equivalence of costs were found, then the comparison would simply be of clinical outcomes. To demonstrate equivalence within 5% of the expected mean log cost of 7.16 (s.d.1.0, β=0.1, α=0.05/3), we required 260 evaluable patients per group at follow-up.
Economic analysis
The economic analysis was conducted from a health service perspective. Unit costs in pounds sterling (£) were obtained from published sources for 2001/2002, and inflated or deflated as appropriate where figures were not available (Reference Ratcliffe, Ryan and TuckerRatcliffe et al, 1996; Reference Brown, Smith and CantorBrown et al, 1997; Reference Moffett, Torgerson and Bell-SyerMoffett et al, 1999; British Medical Association & Royal Pharmaceutical Society of Great Britain, 2001; Reference Netten, Rees and HarrisonNetten et al, 2001). No discounting was necessary as costs and effects related to no more than 1 year. Estimated total service use costs per patient over 12 months were calculated from the medical record data, augmented by patients’ self-reports. Cost-effectiveness and cost-utility analyses included resource data only up to the time of patients’ last HADS–D or EQ–5D ratings. The QALY is a measure of a patient's life expectancy, weighted by his or her health-related quality of life, valued on a self-reported ‘utility’ scale, where 0 represents death and 1 represents full health. The QALYs were calculated by applying a tariff of health state values, based on a representative UK sample, to the utility scores from the EQ–5D (Reference DolanDolan, 1997). A multivariate generalised linear model was used to adjust for differences in baseline EQ–5D scores.
In the absence of demonstrable cost equivalence, incremental cost-effectiveness and cost-utility ratios were computed comparing TCAs with SSRIs, SSRIs with lofepramine and TCAs with lofepramine. To characterise the uncertainty around the ratios, estimates were bootstrapped with 5000 replications and presented on cost-effectiveness planes and as cost-effectiveness acceptability curves (Reference ManlyManly, 1997). These show the probability of each treatment strategy being cost-effective, contingent upon the value placed upon an additional depression-free week, or an additional QALY.
RESULTS
Recruitment
Referral rates to the study were lower than anticipated, and recruitment of practices had to be extended in five waves, corresponding to the five ethics committee areas. Between October 1999 and April 2002, a total of 87 general practitioners from 55 practices referred 388 patients, of whom 327 were randomly allocated to the three recommended classes (Fig. 1).

Fig. 1 Flow of participants through the trial (LOF, lofepramine; SSRI, selective serotonin reuptake inhibitor; TCA, tricyclic antidepressant).
Allocation
Of 327 patients randomised, 92 patients were prescribed a different class of antidepressant to that of the allocated treatment. Doctor preference was the stated cause for this in 48 cases and patient preference in 24 cases (no cause stated in 20). The proportions prescribed a different class differed significantly between allocated classes: TCAs, 47/113 (42%); lofepramine, 28/105 (27%); SSRIs, 17/109 (16%); χ2=18.7, d.f.=2, P<0.001. Following initial prescription from the allocated drug class, 81 patients later switched class. The proportions switching also differed significantly: lofepramine, 36/77 (46%); TCAs, 23/66 (35%); SSRIs 22/92 (24%); χ2=9.71, d.f.=2, P=0.008. Median daily dosages prescribed were amitriptyline 50 mg, dosulepin 75 mg, imipramine 100 mg, fluoxetine 20 mg, paroxetine 20 mg, sertraline 50 mg and lofepramine 140 mg.
Follow-up rates
Assessments of outcome were completed with 254 patients at 3 months (78%), 203 (62%) at 6 months, 188 (58%) at 9 months and 171 (52%) at 12 months, with no significant difference in completeness between groups (Fig. 1). Two patients died, but their deaths were not related to depression or its treatment. One patient was removed from the study for personal reasons, not related to the protocol.
Participants recruited
The demographic characteristics of the 327 randomised patients are given in Table 1, and show that almost all were White, and there were more female than male patients, as expected. Table 2 shows the ICD–10 diagnoses (World Health Organization, 1992) generated by the CIS–R. Of the 327 patients randomised, 239 (73%) received a primary diagnosis of a depressive disorder, 40 (12%) a primary diagnosis of an anxiety disorder and 48 (15%) no identifiable psychiatric diagnosis.
Table 1 Characteristics of patients randomised

| TCA group (n=113) | SSRI group (n=109) | Lofepramine group (n=105) | All patients (n=327) | |
|---|---|---|---|---|
| n | n | n | n (%) | |
| Gender | ||||
| Male | 37 | 38 | 33 | 108 (33) |
| Female | 76 | 71 | 72 | 219 (67) |
| Age range | ||||
| 17-59 years | 94 | 92 | 99 | 285 (87) |
| 60+ years | 19 | 17 | 6 | 42 (13) |
| Social class | ||||
| I, III-NM | 58 | 57 | 55 | 170 (52) |
| III-M, IV, V | 42 | 41 | 42 | 125 (38) |
| Uncertain/missing | 13 | 11 | 10 | 34 (10) |
| Employment status | ||||
| Employed | 69 | 65 | 65 | 199 (61) |
| Housewife/student/retired | 27 | 28 | 31 | 86 (26) |
| Unemployed | 9 | 9 | 7 | 25 (8) |
| Disabled | 4 | 5 | 7 | 16 (5) |
| Other/uncertain/missing | 4 | 2 | 5 | 11 (3) |
| Marital status | ||||
| Married/cohabiting | 68 | 62 | 58 | 188 (57) |
| Widowed/separated/divorced | 23 | 24 | 26 | 73 (22) |
| Single | 20 | 21 | 18 | 59 (18) |
| Uncertain/missing | 2 | 2 | 3 | 7 (2) |
| Ethnicity | ||||
| White | 111 | 108 | 103 | 322 (98) |
| Black Caribbean | 0 | 0 | 1 | 1 (0.3) |
| Chinese | 1 | 0 | 0 | 1 (0.3) |
| Other Asian | 1 | 0 | 0 | 1 (0.3) |
| Missing | 0 | 1 | 1 | 2 (0.6) |
| Educational attainment | ||||
| No qualifications | 33 | 32 | 24 | 89 (27) |
| Up to A level or equivalent | 64 | 59 | 60 | 183 (56) |
| Degree or equivalent | 12 | 15 | 17 | 44 (13) |
| Other/uncertain | 4 | 3 | 4 | 11 (3) |
Table 2 Diagnoses at baseline derived from the Clinical Interview Schedule – Revised

| Primary diagnosis | Secondary diagnosis | |||
|---|---|---|---|---|
| n | (%) | n | (%) | |
| ICD—10 psychiatric diagnosis | ||||
| Mixed anxiety and depressive disorder | 123 | (37.6) | ||
| Moderate depressive episode | 50 | (15.3) | 0 | (0) |
| Severe depressive episode | 45 | (13.8) | 0 | (0) |
| Mild depressive episode | 21 | (6.4) | 0 | (0) |
| Panic disorder | 13 | (4.0) | 9 | (2.8) |
| Agoraphobia | 13 | (4.0) | 13 | (4.0) |
| Social phobia | 12 | (3.7) | 12 | (3.7) |
| Obsessive—compulsive disorder | 0 | (0) | 4 | (1.2) |
| Specific (isolated phobia) | 2 | (0.6) | 5 | (1.5) |
| No identifiable psychiatric diagnosis | 48 | (14.7) | 0 | (0) |
Clinical outcomes
Table 3 shows the values obtained for the clinical outcomes over 12 months for the three groups, on an intention-to-treat basis. All three groups improved to a similar extent, with most improvement occurring in the first 3 months. No significant difference between groups was demonstrated. The sensitivity analysis, including only those who received an initial prescription from the class to which they were randomised, also demonstrated no significant difference.
Table 3 Outcome measures at baseline and over 12 months of follow-up (all patients randomised, regardless of whether they received a drug of the allocated class)

| TCA group | SSRI group | Lofepramine group | |||||||||||||
|---|---|---|---|---|---|---|---|---|---|---|---|---|---|---|---|
| Month | Month | Month | Month | Month | Month | Month | Month | Month | Month | Month | Month | Month | Month | Month | |
| 0 | 3 | 6 | 9 | 12 | 0 | 3 | 6 | 9 | 12 | 0 | 3 | 6 | 9 | 12 | |
| Patients assessed | 113 | 90 | 70 | 65 | 62 | 109 | 82 | 71 | 63 | 58 | 105 | 82 | 62 | 60 | 51 |
| HADS—D score: mean (s.d.) | 10.4 (4.1) | 6.0 (4.2) | 5.0 (4.4) | 4.7 (4.0) | 3.8 (3.3) | 10.5 (3.6) | 6.4 (4.4) | 4.6 (3.6) | 4.3 (3.7) | 4.3 (3.9) | 10.5 (3.9) | 7.0 (4.1) | 5.2 (3.8) | 4.8 (3.9) | 5.0 (4.7) |
| Patients with HADS—D score <8, % | 22 | 65 | 71 | 71 | 82 | 19 | 62 | 80 | 76 | 74 | 19 | 54 | 74 | 75 | 72 |
| CIS—R score: mean (s.d.) | |||||||||||||||
| Total score | 23.6 (11.2) | 11.9 (10.1) | 9.3 (10.4) | 7.5 (9.1) | 7.7 (8.7) | 23.8 (9.7) | 13.7 (11.4) | 10.4 (10.6) | 11.3 (11.6) | 8.3 (9.6) | 23.7 (11.0) | 12.1 (10.2) | 10.0 (10.1) | 7.6 (8.3) | 8.7 (11.4) |
| Depression score | 2.2 (1.3) | 0.7 (1.0) | 0.7 (1.2) | 0.5 (0.9) | 0.4 (0.9) | 2.4 (1.3) | 0.9 (1.2) | 0.7 (1.0) | 0.7 (1.2) | 0.4 (0.7) | 2.3 (1.4) | 0.9 (1.1) | 0.8 (1.2) | 0.6 (1.0) | 0.8 (1.3) |
| Depressive ideas score | 3.1 (1.3) | 2.5 (1.4) | 2.3 (1.5) | 2.3 (0.8) | 2.5 (0.9) | 2.9 (1.3) | 2.6 (1.5) | 2.3 (1.6) | 2.4 (1.2) | 1.8 (1.5) | 3.1 (1.2) | 2.1 (1.3) | 2.3 (1.0) | 1.4 (1.0) | 2.8 (1.6) |
| SF—36 score: mean (s.d.) | |||||||||||||||
| Mental health score | 35.1 (17.7) | 58.8 (19.5) | 64.6 (20.7) | 67.6 (19.6) | 71.9 (16.3) | 36.8 (16.6) | 60.3 (20.2) | 65.1 (16.4) | 69.1 (17.2) | 70.0 (18.1) | 37.4 (16.1) | 59.4 (20.2) | 65.7 (18.3) | 65.7 (20.0) | 65.1 (23.8) |
| General health perception score | 56.8 (22.8) | 65.8 (21.2) | 65.0 (23.0) | 67.7 (21.3) | 67.7 (22.2) | 52.7 (21.8) | 59.9 (22.3) | 65.6 (19.6) | 64.5 (23.7) | 66.6 (23.6) | 53.0 (22.5) | 57.4 (25.1) | 65.9 (22.9) | 67.6 (23.0) | 61.1 (25.3) |
| Unadjusted EuroQol EQ—5D tariff score: mean (s.d.) | 0.58 (0.27) | 0.76 (0.25) | 0.77 (0.25) | 0.79 (0.24) | 0.81 (0.21) | 0.61 (0.28) | 0.73 (0.25) | 0.74 (0.27) | 0.79 (0.24) | 0.82 (0.20) | 0.57 (0.27) | 0.74 (0.22) | 0.76 (0.23) | 0.79 (0.19) | 0.70 (0.31) |
Practice records of resource use and at least one post-baseline HADS–D score were obtained for 264 patients. The mean numbers of depression-free weeks for these patients were not significantly different between groups: 25.3 weeks (95% CI 21.3–29.0) for the TCA group, 28.3 weeks (95% CI 24.3–32.2) for the SSRI group and 24.6 weeks (95% CI 20.6–28.9) for the lofepramine group (Kruskal–Wallis test: χ2=2.23, P=0.327). The repeated-measures ANOVA gave estimated mean numbers of depression-free weeks over the full 12 months of 36.6 weeks for SSRIs, 35.5 weeks for TCAs and 34.8 weeks for lofepramine. These differences were not statistically significant: SSRIs ν. TCAs, 1.1 depression-free weeks (95% CI –4.0 to 6.3); TCAs ν. lofepramine, 0.7 week (95% CI –4.6 to 5.9); and SSRIs ν. lofepramine, 1.8 weeks (95% CI –3.5 to 7.1). No significant difference was demonstrated through sensitivity analyses, either including only those who received the randomised class, or when using the higher HADS–D cut-off score of 11.
Resource use
There was no statistically significant difference in non-drug resource use over 12 months (Table 4). The most frequent contacts were with general practitioners at the surgery, followed by contacts with practice nurses. Contacts with community psychiatric nurses and psychiatrists in out-patient clinics were much less frequent. Day centre attendances and in-patient stays were relatively uncommon.
Table 4 Non-drug resource use in the 12 months following randomisation

| Number of contacts:mean (s.d.) | ||||||
|---|---|---|---|---|---|---|
| TCA group (n=111) | SSRI group (n=109) | Lofepramine group (n=104) | All patients (n=324) | χ2 | P 1 | |
| Visit to GP at surgery | 8.35 (4.84) | 10.10 (7.14) | 8.74 (5.39) | 9.08 (5.90) | 2.32 | 0.31 |
| Contact with GP by telephone | 0.66 (1.89) | 1.19 (3.07) | 0.54 (1.11) | 0.80 (2.20) | 3.52 | 0.17 |
| Home visit by GP | 0.34 (1.23) | 0.48 (1.51) | 0.55 (2.55) | 0.45 (1.84) | 0.15 | 0.93 |
| Contact with practice nurse at surgery | 1.18 (1.73) | 1.78 (2.93) | 1.32 (2.09) | 1.43 (2.31) | 1.39 | 0.50 |
| Home visit by district nurse | 0.77 (6.87) | 0.33 (2.30) | 0.05 (0.32) | 0.39 (4.24) | 0.05 | 0.98 |
| Contact with CPN | 0.03 (0.16) | 0.06 (0.31) | 0.30 (1.99) | 0.13 (0.15) | 0.10 | 0.95 |
| Visit to counsellor | 0.21 (0.79) | 0.41 (1.51) | 0.36 (1.21) | 0.33 (1.20) | 0.54 | 0.76 |
| Attendance at day centre | 0.45 (3.41) | 0 (0) | 0.42 (3.41) | 0.29 (2.78) | 0.14 | 0.93 |
| Attendance at non-psychiatric hospital clinic | 0.80 (1.54) | 1.17 (2.33) | 0.88 (1.51) | 0.95 (1.84) | 0.49 | 0.79 |
| Contact with psychiatrist | 0.18 (0.79) | 0.04 (0.27) | 0.17 (0.70) | 0.13 (0.63) | 0.69 | 0.71 |
| Visit to A&E | 0.12 (0.48) | 0.22 (0.63) | 0.20 (0.56) | 0.18 (0.56) | 1.29 | 0.53 |
| Psychiatric in-patient stay, days | 0.56 (4.67) | 0 (0) | 0.09 (0.88) | 0.22 (2.78) | 0.05 | 0.97 |
| All in-patient stays, days | 1.31 (5.65) | 0.61 (2.76) | 1.24 (7.01) | 1.05 (5.40) | 3.97 | 0.14 |
Costs
Table 5 summarises cost data over 12 months. Costs were skewed, and so mean and median values are presented. Mean non-drug service use costs were around £650 per patient, with no statistically significant difference demonstrated between groups. Statistically significant differences in costs were found for all drug prescriptions, and for the costs of antidepressant prescriptions alone, but not for mean total costs. However, antidepressant prescriptions accounted for less than a tenth of total costs in each group.
Table 5 Summary of total service use costs to 12 months from randomisation

| Service use costs (£) | ||||||
|---|---|---|---|---|---|---|
| TCA group (n=111) | SSRI group (n=109) | Lofepramine group (n=104) | All patients (n=324) | χ2 | P 1 | |
| Non-drug service use | ||||||
| Mean (s.d.) | 646 (1291) | 627 (1342) | 676 (1822) | 649 (1493) | 1.44 | 0.49 |
| Median | 256 | 305 | 278 | 278 | ||
| All prescriptions | ||||||
| Mean (s.d.) | 116 (137) | 249 (405) | 192 (301) | 185 (305) | 18.90 | <0.001 |
| Median | 66 | 136 | 92 | 95 | ||
| Antidepressant prescriptions only | ||||||
| Mean (s.d.) | 52 (69) | 87 (83) | 74 (69) | 71 (75) | 23.58 | <0.001 |
| Median | 26 | 65 | 58 | 48 | ||
| Total costs | ||||||
| Mean (s.d.) | 762 (1336) | 875 (1566) | 867 (1907) | 834 (1610) | 4.78 | 0.09 |
| Median | 359 | 503 | 384 | 408 | ||
| 95% CI2 | 553-1059 | 675-1355 | 634-1521 | 691-1041 | ||
Cost-effectiveness
Mean total service use costs up to the last HADS–D assessment for these 264 patients were £712 for the TCA group (95% CI 486–1062), £809 (95% CI 590–1431) for the SSRI group and £593 (95% CI 459–772) for the lofepramine group. Although differences were not statistically significant, equivalence was not demonstrated (Kruskal–Wallis χ2=3.76, P=0.153). Incremental costs per depression-free week were £32 more for SSRIs ν. TCAs, £59 more for SSRIs ν. lofepramine and £183 more for TCAs ν. lofepramine. It was not possible to calculate reliable confidence intervals around these mean ratios as the small differences led to unstable results when bootstrapped. Therefore, cost-effectiveness planes and cost-effectiveness acceptability curves were computed to illustrate the uncertainty around these estimates. The cost-effectiveness planes for each comparison included points in all four quadrants (Figs 2, 3, 4) reflecting statistically non-significant differences in outcomes and costs.
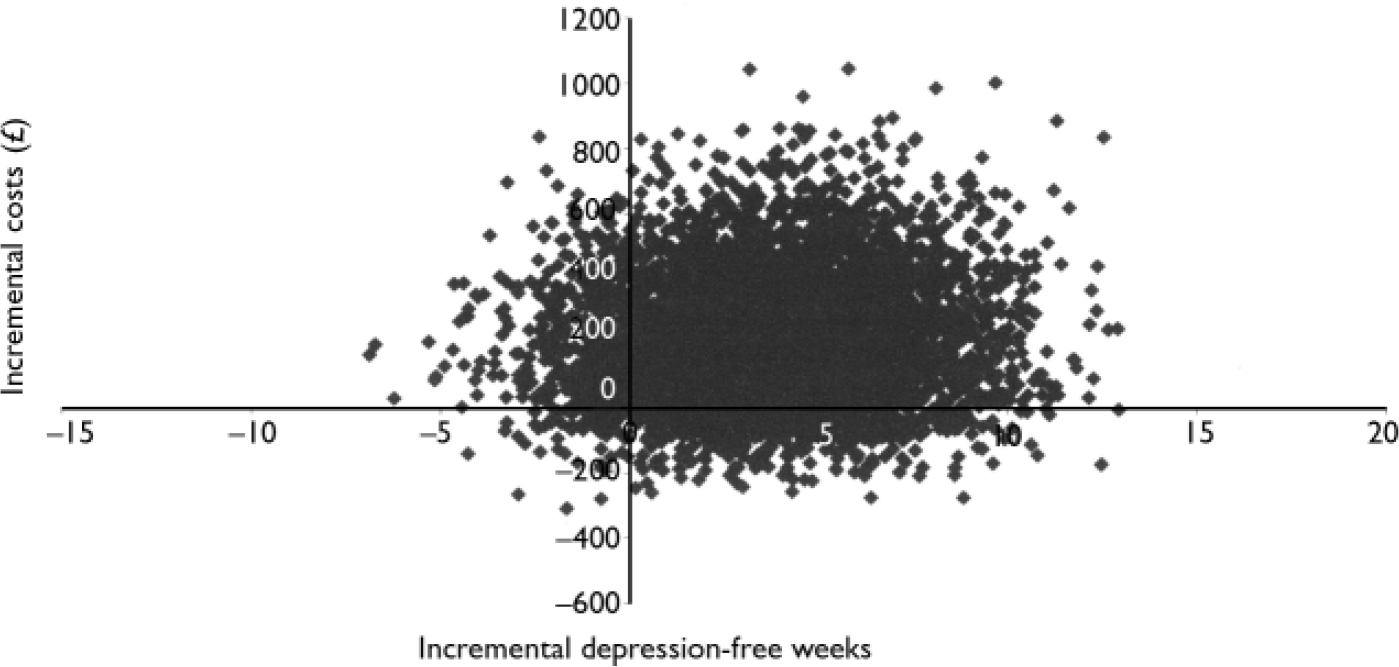
Fig. 2 Cost-effectiveness plane for selective serotonin reuptake inhibitors compared with lofepramine.

Fig. 3 Cost-effectiveness plane for tricyclic antidepressants compared with lofepramine

Fig. 4 Cost-effectiveness plane for selective serotonin reuptake inhibitors compared with tricyclic antidepressants.
Cost-utility
Practice and patient records of resource use and at least one post-baseline EQ–5D score were obtained for 261 patients. Among these, the mean numbers of QALYs, adjusted for baseline EQ–5D, were 0.55 (95% CI 0.48–0.61) for the TCA group, 0.59 (95% CI 0.52–0.64) for the SSRI group and 0.55 (95% CI 0.49–0.61) for the lofepramine group. Mean total service use costs for these 261 patients were £712 for the TCA group (95% CI 502–1103), £817 (95% CI 586–1486) for the SSRI group and £619 (95% CI 469–788) for the lofepramine group. Incremental costs per QALY between groups were £5686 more for SSRIs ν. lofepramine, £23 250 less for TCAs ν. lofepramine and £2692 more for SSRIs ν. TCAs. Cost-utility planes for each comparison again included points in all four quadrants, reflecting non-significant differences.
The cost-effectiveness acceptability curve (Fig. 5) shows (Fig. 5) shows that if an additional depression-free week were valued at less than £20, lofepramine would be likely to be most cost-effective and SSRIs least cost-effective. However, if it were valued at above £50, SSRIs would be likely to be most cost-effective and TCAs least cost-effective. However, differences between them were small. A similar curve was computed for the cost-utility results (Fig. 6). This shows that, for values placed on an additional QALY of more than £5000, the cost-utility of SSRIs was likely to be greatest, with little difference between the other two groups, although the probability of this did not rise above 0.6.
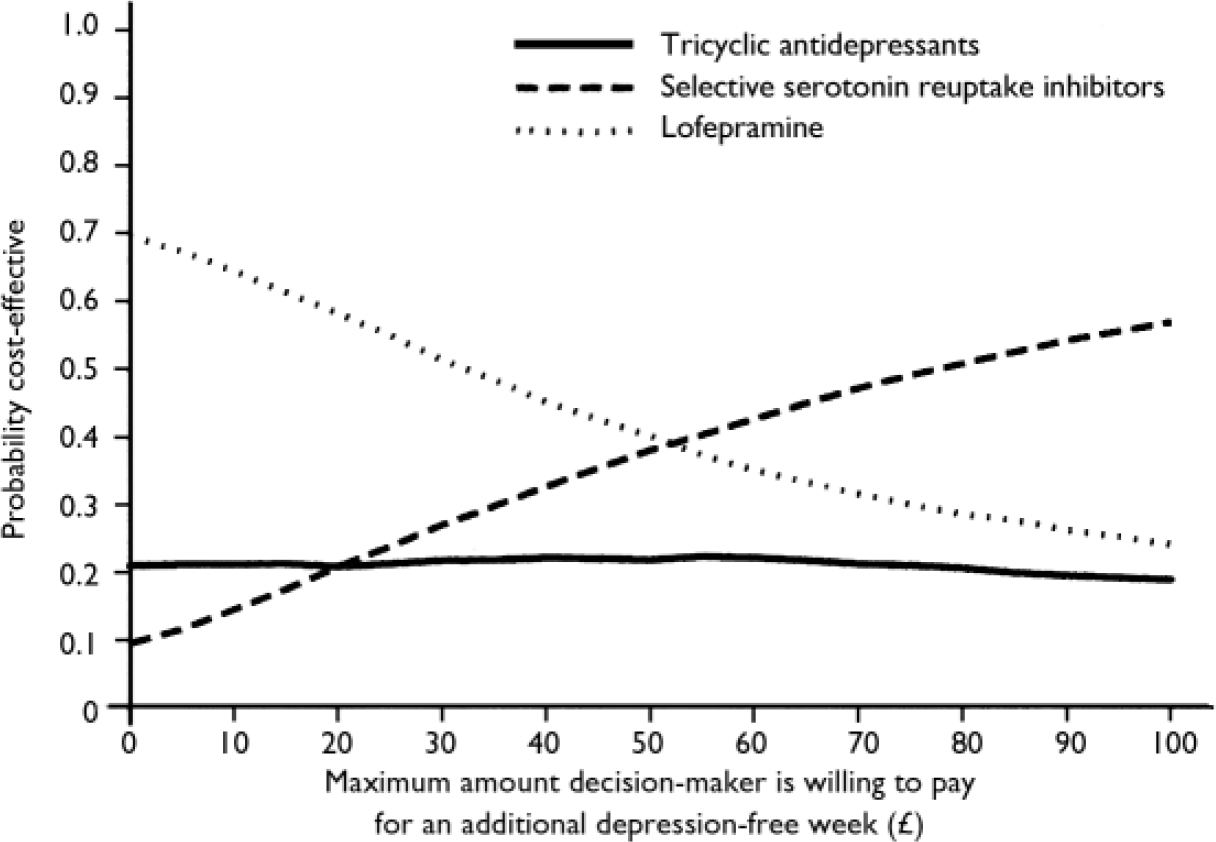
Fig. 5 Cost-effectiveness acceptability curve.

Fig. 6 Cost-effectiveness acceptability curve. QALY, quality-adjusted life-year.
DISCUSSION
Main findings
Clinical outcomes
We found no significant difference in effectiveness between the three classes of antidepressant on an intention-to-treat basis, although patients allocated to treatment with TCAs were significantly more likely to receive a different class of antidepressant, usually a result of doctor rather than patient preference, and those allocated to receive lofepramine were significantly more likely to switch drug class later.
Comparison of costs
The costs of the antidepressants prescribed represented less than a tenth of total health service costs over 12 months. The initial prescribing costs of offering a TCA were lowest, but no significant difference was found in overall service costs between classes. Considerable between-patient variability and skewed cost distributions produced wide confidence intervals. No significant difference was demonstrated in sensitivity analyses including only those who received an initial prescription from the randomised class, nor when using the higher HADS–D cut-off score of 11.
Cost-effectiveness
The sample we recruited was not large enough to demonstrate equivalence, and so it was appropriate to estimate incremental cost-effectiveness and cost-utility. These were broadly similar for the three comparisons, with bootstrapped simulation estimates of cost per depression-free week or cost per QALY, plotted on cost-effectiveness planes, clearly occupying all four quadrants in each paired comparison, but the cost-effectiveness acceptability curves suggest that, for values of an additional depression-free week over £50 or for a QALY over £5000, SSRIs were most likely – and TCAs least likely – to be the most cost-effective.
Comparison with previous studies
The findings are consistent with those of Simon et al (Reference Simon, von Korff and Heiligenstein1996) who found that over 40% of patients initially assigned to TCAs switched treatment, compared with 20% for fluoxetine. They also found no difference in effectiveness between fluoxetine and TCAs, that antidepressant costs were less than 10% of total service costs, and that the initial higher cost of fluoxetine was offset by lower out-patient and in-patient care costs, so that overall service costs were not significantly different (Reference Simon, von Korff and HeiligensteinSimon et al, 1996). Compared with the findings of Forder et al (Reference Forder, Kavanagh and Fenyo1996), our study suggests a more modest benefit for the SSRIs. However, the conclusions of the former study may be less reliable than those reported here owing to its non-experimental design, with masked, retrospective assessments of outcome.
Strengths of the study
The main strength of our study was its naturalistic general practice setting, which is likely to reflect usual clinical practice. Fewer than 30% of recruited patients had moderate or severe depressive episodes, which accords with other evidence that antidepressants are often prescribed for mild depression (Reference Kendrick, Stevens and BryantKendrick et al, 2001), despite a lack of evidence that they are more effective than placebo in such cases (Drug and Therapeutics Bulletin, 2003). The lower-than-recommended median dosages of TCAs prescribed also reflect usual practice. They reflect lower dosages given during the titration period, lower dosages which apparently worked and were continued, and lower dosages beyond which the patient could not tolerate the drugs and discontinued them. It is important to remember that we investigated the effect of recommending a treatment choice, as in a clinical guideline, rather than actual treatment delivery. The partial preference design permitted prescription of a different class of antidepressant, as a result of doctor or patient preference, and so we have data on patients who would not have been included if the trial had been limited to those accepting randomisation. Another strength of the study is that cost data were available for almost all patients over a 12-month period, from computerised practice records.
Limitations of the study
Sample size
The main limitation was the failure to recruit the desired sample because we received many fewer referrals per practitioner than anticipated. This suggests the patients referred might not be representative of all new patients with depression starting antidepressant therapy in general practice. We did ask the practitioners to record the number of eligible patients asked to take part in the study who declined, but this proved unsuccessful. Loss to follow-up over the 12 months further limited the power to detect differences in effectiveness between antidepressant classes. A shorter follow-up period might have reduced attrition, but risked missing important differences emerging after the initial treatment period. With the benefit of hindsight, attempting to demonstrate cost equivalence to within 5% was a rather strict criterion and led to a much larger target number of evaluable patients than we were able to recruit and follow-up. The greater uncertainty around our estimates, owing to the smaller than anticipated sample, is reflected in the relatively wide confidence intervals around costs. However, this uncertainty is taken into account in the computation of the cost-effectiveness acceptability curves.
Economic perspective
We adopted a health-service perspective for the economic analysis, and it is possible that the results might have differed had a societal perspective been included. For example, if one treatment enabled more patients to return to work, this might have altered the findings. However, given the lack of differences in effectiveness, we think this unlikely.
Implications for practice
It is difficult to judge whether a value of £50 per additional depression-free week is acceptably cost-effective. The National Institute for Clinical Excellence (2004) compares treatments with a benchmark level of around £20 000 to £30 000 per QALY, and at this level we can be approximately 60% sure that SSRIs are most cost-effective when compared with TCAs or lofepramine, whereas there is a less than 25% chance that either of the other two treatments are most cost-effective. The initial choice of an SSRI has therefore been shown to be more cost-effective at a reasonable level of probability, and this will increase as the relative cost of SSRIs falls, as their patents expire. Our results therefore tend to support the National Institute for Clinical Excellence guidelines on depression which recommend SSRIs as first-choice antidepressants in primary care (National Collaborating Centre for Mental Health, 2004).
APPENDIX
Recommended daily dosages of antidepressants
Tricyclic antidepressants
Age 18–65 years: 50 mg rising in 25 mg weekly steps to a maximum of 150 mg.
Age 65+ years: 25 mg rising in 25 mg weekly steps to a maximum of 120 mg.
Selective serotonin reuptake inhibitors
Fluoxetine: 20 mg daily dose throughout. Paroxetine: 20 mg increasing to 30 mg after 3 weeks and to a maximum of 40 mg after 6 weeks. Sertraline: 50 mg increasing after 3 weeks to 100 mg and after 6 weeks to a maximum of 150 mg.
Lofepramine
Daily dosage of 70 mg rising in weekly 70 mg increments in divided doses to a maximum of 210 mg.
Clinical Implications and Limitations
CLINICAL IMPLICATIONS
-
• Differences in antidepressant costs suggested that offering a tricyclic antidepressant might be the cheapest option, but differences in overall costs, cost-effectiveness and cost-utility were not significant.
-
• The cost-utility acceptability curve suggests that, for values placed on an additional quality-adjusted life-year of over £5000, selective serotonin reuptake inhibitors (SSRIs) were likely to be most cost-effective, although the probability of this did not rise above 0.6.
-
• Our findings tend to support the National Institute for Clinical Excellence recommendations that SSRIs should be the first choice of antidepressant in primary care.
LIMITATIONS
-
• We were unable to recruit a sample of the desired size, reducing the study's power to detect differences in effectiveness and costs.
-
• Loss to follow-up approaching 50% over12 months further limited the power.
-
• Many fewer referrals per practitioner were received than anticipated, and the patients referred may not be representative of all new patients with depression being treated in primary care.
Acknowledgements
We are grateful to all the general practitioners and patients who took part. The study was funded by the Health Technology Assessment programme of the National Health Service Research and Development Directorate. L.L. now works as a health technology analyst at the National Institute for Clinical Excellence, but this work was conducted while she was a research fellow at the Health Economics Research Group (HERG) at Brunel University. M.B.'s input was funded by HERG's programme grant from the Department of Health's Policy Research Programme.
T.K. has received fees for speaking at educational meetings from Pfizer, Lilly, Wyeth and Lundbeck. R.P. has received hospitality and fees for speaking at academic meetings from GlaxoSmithKline, Pfizer, Lilly, Merck, Wyeth, Lundbeck and Organon. He has also received support for research from Boots plc (makers of dosulepin). D.B. has attended advisory board meetings for Lilly, GlaxoSmithKline, Pfizer, Lundbeck and Asahi Kasei and has received fees for speaking at educational meetings from Lundbeck, Lilly, GlaxoSmithKline, Pfizer, Wyeth and Asahi Kasei. He has received grant funding for clinical trials from Lundbeck, Wyeth, Lilly, GlaxoSmithKline (and SmithKline Beecham) and Pfizer, and has received grants from Wyeth to prepare an expert report. C.T. is an executive director of the Priory Hospitals Group, and has acted as a consultant to Organon UK Pharmaceuticals, Lilly and Pfizer.
The views expressed in this paper are the authors’ and do not necessarily represent the views or stated policies of the Department of Health.


eLetters
No eLetters have been published for this article.