


Introduction
Inequality in biological standards of living in accordance with environmental conditions is one of the most fascinating topics in the fields of economic history and social science. In recent decades, an increasing number of studies have been carried out addressing the inequality in different environments based on anthropometric data and indices, although height continues to be the principal indicator to assess nutritional differences in populations of the past. Height data enable comparisons to be made between socioprofessional groups of different environments and allow us to analyze the inequality in biological welfare (Baten and Blum Reference Baten and Blum2012; Blum Reference Blum2013; Galofré-Vilà Reference Galofré-Vilà2018; Komlos and Kelly Reference Komlos and Kelly2016; Martínez-Carrión and Salvatore Reference Martínez-Carrión and Salvatore2019; Perkins et al. Reference Perkins, Subramanian, Davey Smith and Özaltin2016; Steckel Reference Steckel, Diebolt and Haupert2019).
Unlike the conventional indicators of living standards, such as per capita income, consumption, or real wages, anthropometric history reveals the hidden biological costs of industrialization and modern economic growth, showing nutritional differences between urban and rural areas from the beginning of the Industrial Revolution and urbanization (Cinnirella Reference Cinnirella2008a; Floud et al. Reference Floud, Fogel, Harris and Chul Hong2011; Haines Reference Haines2004; Heyberger Reference Heyberger2014; Komlos Reference Komlos1998, Reference Komlos2019; Komlos and Küchenhoff Reference Komlos and Küchenhoff2012; Steckel Reference Steckel1995; Steckel and Floud Reference Steckel and Floud1997; Treme and Craig Reference Treme and Craig2013). Many anthropometric studies show that the beginning of industrialization did not significantly improve the height of the working classes and affected the urban-industrial environment more than the rural world (Komlos and Baten Reference Komlos and Baten1998; Steckel and Floud Reference Steckel and Floud1997). The poor health and hygiene infrastructure, the high incidence of environmental diseases, the increase in relative food prices, the prevalence of child labor with hard and intense working hours in workshops and factories, in general, explain the existence of an “urban-industrial penalty” in many cities. The advantage of the rural height, however, would have been associated with better access to fresh food (or at least cheaper produce than in the cities) and a lower incidence of the diseases most prevalent in cities and industrial towns that were more prone to contagion caused by demographic pressure due to mobility, overcrowding, and urbanization (Komlos Reference Komlos1998). The deterioration of height during the first industrialization process is well documented in the economic history literature (Craig Reference Craig, Diebolt and Haupert2016).
In continental Europe, the anthropometric findings show a more diverse rural panorama. For example, until well into the nineteenth century, the less market-oriented inland Dutch rural regions enjoyed higher biological standards of living, but at the beginning of the twentieth century the urban penalty had disappeared and was replaced by the urban premium at least for the small and medium sized cities (Tassenaar Reference Tassenaar2019). There were situations of nutritional stress in many parts of rural Europe at least until the mid-nineteenth century. This was the case in some German states between the beginning and middle of the nineteenth century (Baten Reference Baten2000; Cinnerella Reference Cinnirella2008b; Ewert Reference Ewert2006). There was widespread poverty in the small villages of eastern Belgium, which would explain the very low average heights, at around 160 cm (Alter et al. Reference Alter, Neven and Oris2004), as was the case of many rural towns in Spain (Martínez-Carrión and Moreno Reference Martínez-Carrión and Moreno2007). In other cases, nutritional stress was the consequence of the impact caused by institutional changes in the rural world. For example, in Spain it has been shown that the privatization of communal lands in some regions (areas of Central and Southern of country) did not have positive effects, increasing inequality within rural communities. On the contrary, the persistence of common lands in other regions provided peasants with mechanisms different from the market and made the transition to a market economy more socially sustainable (Beltrán Tapia Reference Beltrán Tapia2015). From the mid-nineteenth century, the heights in the rural areas grew in almost all European regions and, despite the wide local variation, they converged in the early decades of the twentieth century (Heyberger Reference Heyberger2007; Martínez-Carrión and Pérez-Castejón Reference Martínez-Carrión, José Pérez-Castejón and Martínez-Carrión2002). However, we still know very little about the differences in biological welfare within the rural environment.
This article studies the diversity of biological welfare in the rural world of Mediterranean Europe during the modern economic growth period and generates unprecedented results from new analytical perspectives regarding nutritional inequality. It compares heights in different, well-characterized rural environments: irrigated areas (vegetable crops) with intensive agriculture systems and arid areas (drylands) with extensive agriculture systems. The comparison of the two areas with different agricultural yields seeks to analyze the influence of agricultural productivity on biological welfare and to explore whether lower heights prevailed in dry areas, where productivity was lower than in irrigated areas. The heights in the irrigated areas may have been taller given the greater provision of water resources and the specialization in intensive crops (horticultural), with higher earnings due to the demand of foreign markets. The comparative analysis is carried out in a group of rural towns in one of the most dynamic areas of Mediterranean Europe: the eastern coast of Spain. With a database of the heights of conscripts of the area of study (N = 146,041), it analyzes the health and nutritional differences among the cohorts born between the 1840s and 1960s.
The studies carried out show that, in some periods of the nineteenth century, the populations of the towns with irrigated agriculture were, on the whole, taller than those that practised dry farming. In southeast Spain, the differences were small (Martínez-Carrión Reference Martínez-Carrión, Floud, Foge, Harris and Hong2014). In rural Catalonia, there were large fluctuations between the two rural areas until the beginning of the twentieth century, but the results are not fully consistent due to the size and characteristics of the sample (Ramon-Muñoz Reference Ramon-Muñoz2009). In Andalusia, the data for the second half of the nineteenth century and first half of the twentieth century show a very small advantage of the irrigated areas (Cámara Reference Cámara2009). In other countries, such as rural France, the differences were substantial, reaching 2 and 5 cm in the mid-nineteenth century, showing the influence that variables such as the levels of capitalization, the yields obtained, the type of soil or the crop systems had on the evolution of height (Heyberger Reference Heyberger2007). In the case of the eastern coast of Spain, previous studies have confirmed the anthropometric advantage of the irrigated areas compared to the dry agriculture areas, where heights increased from the cohorts of 1870 (Ayuda and Puche Reference Ayuda and Puche2017; Puche et al. Reference Puche, Ayuda and Miguel Martínez-Carrión2018). Nevertheless, to date, no studies have been conducted that analyze the possible factors explaining these anthropometric differences between irrigated and dry farming areas in the context of Mediterranean rural Spain.
This article studies the topic in depth and generates unprecedented results regarding the determining factors that would explain the inequality in biological welfare between the different rural areas of Mediterranean Spain over the long term. It is structured into four sections: After this first section, which reviews the literature on the variability of heights in rural environments compared with the urban-industrial areas and defines the objective of the study, the second section describes the sources of the study, the anthropometric sample, the municipalities selected, and the methodology and hypotheses proposed. The third section presents the results and their discussion and analyzes the differential evolution of the average height of the conscripts among the cohorts between 1840 and 1965 in the irrigated and dry agriculture areas of the eastern coast of Spain. This section also examines the determining factors that could explain the nutritional differences in both rural contexts. The fourth section summarises the main conclusions.
Sources, Data, Methodology, and Hypothesis
The principal source of the study is the information referring to the heights of 146,041 conscripts at 21 years of age from 10 municipalities in Mediterranean Spain, a well-characterized region of Mediterranean rural Europe. The data have been drawn from the military recruitment records corresponding to each municipality from 1860. Unlike other countries with truncated data, the Spanish military conscripts comprised the whole of the population, incorporating all social groups. The sample of the study includes the cohorts born between 1840 and 1965 (conscripts called up from 1860 to 1986). We have divided the data into two subsamples in accordance with the type of agriculture practised in the municipalities analyzed (see table 1): 72,527 heights correspond to conscripts residing in municipalities with irrigated agriculture (49.7%) and 73,514 to conscripts residing in municipalities with dry agriculture (50.3%). Table 1 presents the number of conscripts of the sample per decade of birth, the average height (in cm), and the standard deviation, distinguishing between rainfed and irrigated areas.
Table 1. Data of the anthropometric sample

Source: Conscription and call-up records from municipalities composing the anthropometric sample.
The area of study is representative from a production and environmental point of view of Mediterranean rural Spain, enabling us to compare the heights of the conscripts from the irrigated and dry agriculture areas. Depending on the climate, altitude, and level of rainfall, we can broadly differentiate two large agricultural spaces (Piqueras Reference Piqueras1999): on the one hand, a humid coastline, with irrigation and a variety of horticultural crops and fruit trees and, on the other hand, a dry inland area, where cereals, mostly wheat and barley, wine, and olives are grown in the drylands (see map 1). Cereals, grapes, olives, citrus fruits and horticultural products prosper in the Spanish Mediterranean, a region that enjoys warm and dry summers and mild and rainy winters (Atlas Climático Ibérico 2011).

Map 1. Altitude of Mediterranean Spain. Irrigated municipalities (i): 1. Villarreal; 2. Alzira; 3. Sueca; 4. Gandía; 5. Pego. Dry framing municipalities (df): 6. Requena; 7. Almansa; 8. Yecla; 9. Villena; 10. Jumilla.
Source: Spanish National Geographic Institute. http://www.ign.es/web/ign/portal
Five towns where irrigated agriculture is practised were chosen (from north to south): Villarreal, Alzira, Sueca, Gandía, and Pego (see table 2). Between 1850 and 1930, these municipalities, with low altitudes, experienced an intense process of agricultural growth, sustained, on the one hand, by the expansion of intensive crops (e.g., oranges, rice, horticultural products) and, on the other hand, by the modernization of the agro-food sector (Ayuda and Puche Reference Ayuda and Puche2017). The expansion of intensive agriculture was based on efficient irrigation systems (first, riversides, ditches and aquifers, from the eighteen century, and second, wells and the use of machinery to extract underground water, from the nineteen century) and on high-yield crops that were grown alongside subsistence crops (Calatayud Reference Calatayud2011; Calatayud and Millán Reference Calatayud and Millán2010; Garrido Reference Garrido2004). The comparative advantage of the horticultural crops stimulated exports to growing European markets and the nearby urban centers (Pinilla and Ayuda Reference Pinilla, Ayuda and Pinilla2009, Reference Pinilla and Ayuda2010).
Table 2. Municipalities analyzed
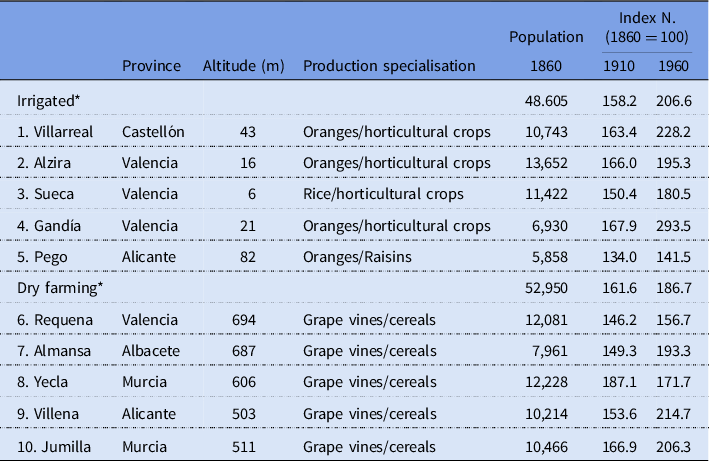
* Location on Map 1.
Source: Puche (Reference Puche2011), Ayuda and Puche (Reference Ayuda and Puche2017), and the Spanish Statistical Office (https://www.ine.es/intercensal/).
For the dry agriculture, five municipalities were also selected that practised (from north to south): Requena, Almansa, Yecla, Villena, and Jumilla (see table 2). In all of them, with altitudes ranging from 500 m to almost 700 m, there was a clear specialization in cereal, olive, and particularly grape crops. The expansion of wine growing was the most noteworthy phenomenon in the agriculture of the Spanish Mediterranean in the second half of the nineteenth century, with a particular prominence in the rainfed areas. The impact of phylloxera in France during the 1870s and 1880s caused a spectacular increase in the area dedicated to the production and export of wine (Piqueras Reference Piqueras2000).
With agricultural specialization, the population of the 10 municipalities analyzed increased between 1860 and 1910 and continued to grow with the demographic transition in the first half of the twentieth century (see table 2). In 1910, all the municipalities analyzed, except one, exceeded 10,000 inhabitants, although they did not become urbanized until the mid-twentieth century. They were Mediterranean “agro-towns” as the majority of the population was still employed in the agricultural sector. Until the mid-twentieth century, Spain’s economy continued to be based predominantly on agriculture with a fairly small industrial sector (Maluquer de Motes Reference Maluquer de Motes2014; Prados de la Escosura Reference Prados de la Escosura2017).
As well as analyzing the evolution of the average height and the coefficient of variation (CV), several econometric models are estimated (dummies for municipalities have been included in all of them as well as the variables that appear in the tables). This has a double objective; first, to verify the existence or not of biological differences between the dry farming and irrigated areas and, second, to analyze in depth the determinants of the rural biological welfare in accordance with the agricultural specialization. When making these estimates we have only considered the cohorts born between 1898 and 1949, as these are the cohorts for whom we have information about the variables considered in the models. The dependent variable is the height of the recruits and the explanatory variables are different dummy variables referring to (1) the decade of birth of the recruits, distinguishing five decades from 1898–1909 to 1940–49; (2) the type of agriculture (irrigated or dry farming); (3) the professional category according to the HISCLASS classificationFootnote 1 that measures the degree of qualification of the conscripts at the time of measurement, distinguishing five professional categories: His1 (nonmanual skilled), His2 (nonmanual semiskilled), His3 (farmers), His4 (manual workers), and His5 (farmer workers); (4) the health and poverty status or the family situation of the conscripts based on the allegations made to legally evade military service, distinguishing four categories: declared fit to serve, no appeal (excluded), physical appeal (excluded), and social appeal (excluded); (5) the level of education (literate and illiterate); and (6) place of birth, distinguishing between native recruits (those measured in the municipality of birth) and immigrants. Within the immigrants we have distinguished between those born in other municipalities of the Region of Valencia; the ones born in Andalusia, Castilla-La Mancha, and Murcia; and the rest of immigrants.
Three models have been estimated for the period corresponding to the cohorts of 1898–1949. The first takes into account the information of the conscripts of both rural areas (41,057 conscripts) and includes an additional dummy variable to distinguish between dry agriculture and irrigated areas. As this dummy variable is highly significant, another two models have been estimated, one for each rural area (irrigated area with 21,670 conscripts, 52.8 percent of the sample; and the dry farming area, with 19,387 conscripts, 47.2 percent of the sample). The econometric analysis also contemplates the nutritional inequalities according to the type of agriculture and examines the possible convergence or divergence between the two rural areas. To do this, models for three groups of cohorts have been estimated: 1898–1915, 1916–29, and 1930–49, distinguishing in each period between irrigated and dry farming areas. All the models have been estimated with heteroskedasticity robust estimators, as, given the omission of relevant variables such as genetics,Footnote 2 the models had heteroskedasticity problems.
On a methodological level, three considerations are necessary.
1. The height data analyzed do not have any social representativeness biases or truncation problems due to the requirement of a minimum height. This is because the Spanish Army established a universal military recruitment system from 1835 that guaranteed that the majority of the youths of military age were measured, except for those who had emigrated or had been declared as fugitives for attempting to elude military service. As a result, the histogram in figure 1, which shows the distribution of the frequencies of the heights of the 146,041 recruits analyzed, reveals a normal distribution, confirming the absence of truncation. The same may be observed in the histograms of the irrigated and dry farming areas (see appendix figure A1 in the supplementary materials).

Figure 1. Distribution of frequencies of the heights of the recruits from Mediterranean rural Spain; birth cohorts of 1840–1965.
Source: Conscription and call-up records from municipalities composing the anthropometric sample.

2. The anthropometric sample is made up of a majority of autochthonous recruits. Of the 146,041 heights analyzed, 66.9 percent are of recruits born in the same municipalities as where they were measured. The percentages in the irrigated and dry farming areas are 68.0 percent and 65.9 percent, respectively. This high proportion of autochthonous recruits is positive, as the results of the study are not affected by cultural or genetic factors as the populations are homogeneous.
3. The height data have been standardized at the age of 21. This is due to the changes made to the recruitment age in Spain in the second half of the nineteenth century, which was 20 years between 1857 and 1885, falling to 19 years between 1885 and 1899, rising again to 20 between 1901 and 1905 and remaining at 21 years from 1907 until 1970. For the standardization we have calculated height averages on the basis of the 50th percentile (P50) of three generations of youths who were measured at different ages but close in time: those conscripted between 1895 and 1899, measured at 19 years of age; those conscripted between 1901 and 1905, measured at 20 years of age; and those conscripted between 1907 and 1911, measured at 21 years of age. Subsequently, we obtained the height differences between the three age groups. The result can be seen in table 3: In the group from irrigated areas, the average height at ages 19 and 20 increased by 1.5 cm and 0.7 cm respectively and in the dry agriculture areas 1 cm and 0.2 cm, respectively. The height series of Mediterranean rural Spain for the conscripts of 1860–1905 have been constructed based on the arithmetic mean of the standardized series of the irrigated and dry farming areas.
In the following text we will describe the hypothesis of our study. One of the key elements of the nutritional status advantage of the conscripts from irrigated areas over those from dry farming areas lies in the greater availability of water resources. This favored the productivity of intensive agriculture and could have had beneficial effects on health, hygiene, and diet. The populations of irrigated areas had a more varied diet, rich in proteins and nutrients, consistent with a more fertile and diverse agriculture. In addition to a wide range of fruit and vegetable products and cereals (rice, wheat, and corn), studies on the Spanish Mediterranean Levant have shown that the irrigated areas also had cattle that produced milk and meat (Martínez Carrión Reference Martínez-Carrión1991; Obiol Menero Reference Obiol Menero1992). A more diversified and protein-rich diet could have had positive effects on child growth and adult height. The availability of irrigation water in the “Huertas” areas and a greater fertilization of agricultural soils, allowed maximum advantage to be taken of the favorable climate conditions (mild temperature and sunlight). Water and climate constituted the comparative advantage of the irrigated areas over the dry farming areas on Spain’s eastern coast (Calatayud Reference Calatayud2011).
From an anthropometric approach, this article suggests that agricultural productivity influenced biological welfare and the nutritional differences in irrigated and dry farming areas of the Spanish Mediterranean. Contrary to the rainfed areas that were less fertile and with a predominance of traditional crops, the higher productivity of the irrigated areas, which produced a wider range of products and generated higher levels of income, could have had positive effects on the nutritional status and physical growth of the resident populations. To confirm this hypothesis, the average heights of the cohorts of 1840 and 1965 from the irrigation and dry farming areas of Spain’s eastern coast are compared. Finally, the econometric models estimate the existence or not of biological differences between the two rural areas, the influence of the environmental context of residence (irrigation or dry agriculture), the socioeconomic status and other variables on these differences and whether these differences increase or decrease in the period of study.
Results and Discussion: Secular Trend and Rural Differences
Figure 2 presents the 10-year averages of the heights of the conscripts from Mediterranean rural Spain with 95 percent confidence intervals and the CV for the birth decades of the 1840s and 1960s. The average height increased by 9.1 cm with an average per decade of 0.75 cm. Physical growth was moderate in the second half of the nineteenth century, it improved at the beginning of the twentieth century, deteriorated slightly among the cohorts of the 1920s due, most likely, to the impact of the Spanish Civil War and the immediate postwar period and accelerated with the cohorts of 1930s. Between the 1920s and 1960s the average height grew by 7 cm. The CV shows that the inequality in height was very pronounced in the mid-nineteenth century, diminished at the end of this century and the beginning of the twentieth century and increased again among the cohorts between the 1920s and 1950s during the military conscriptions of the Franco dictatorship.
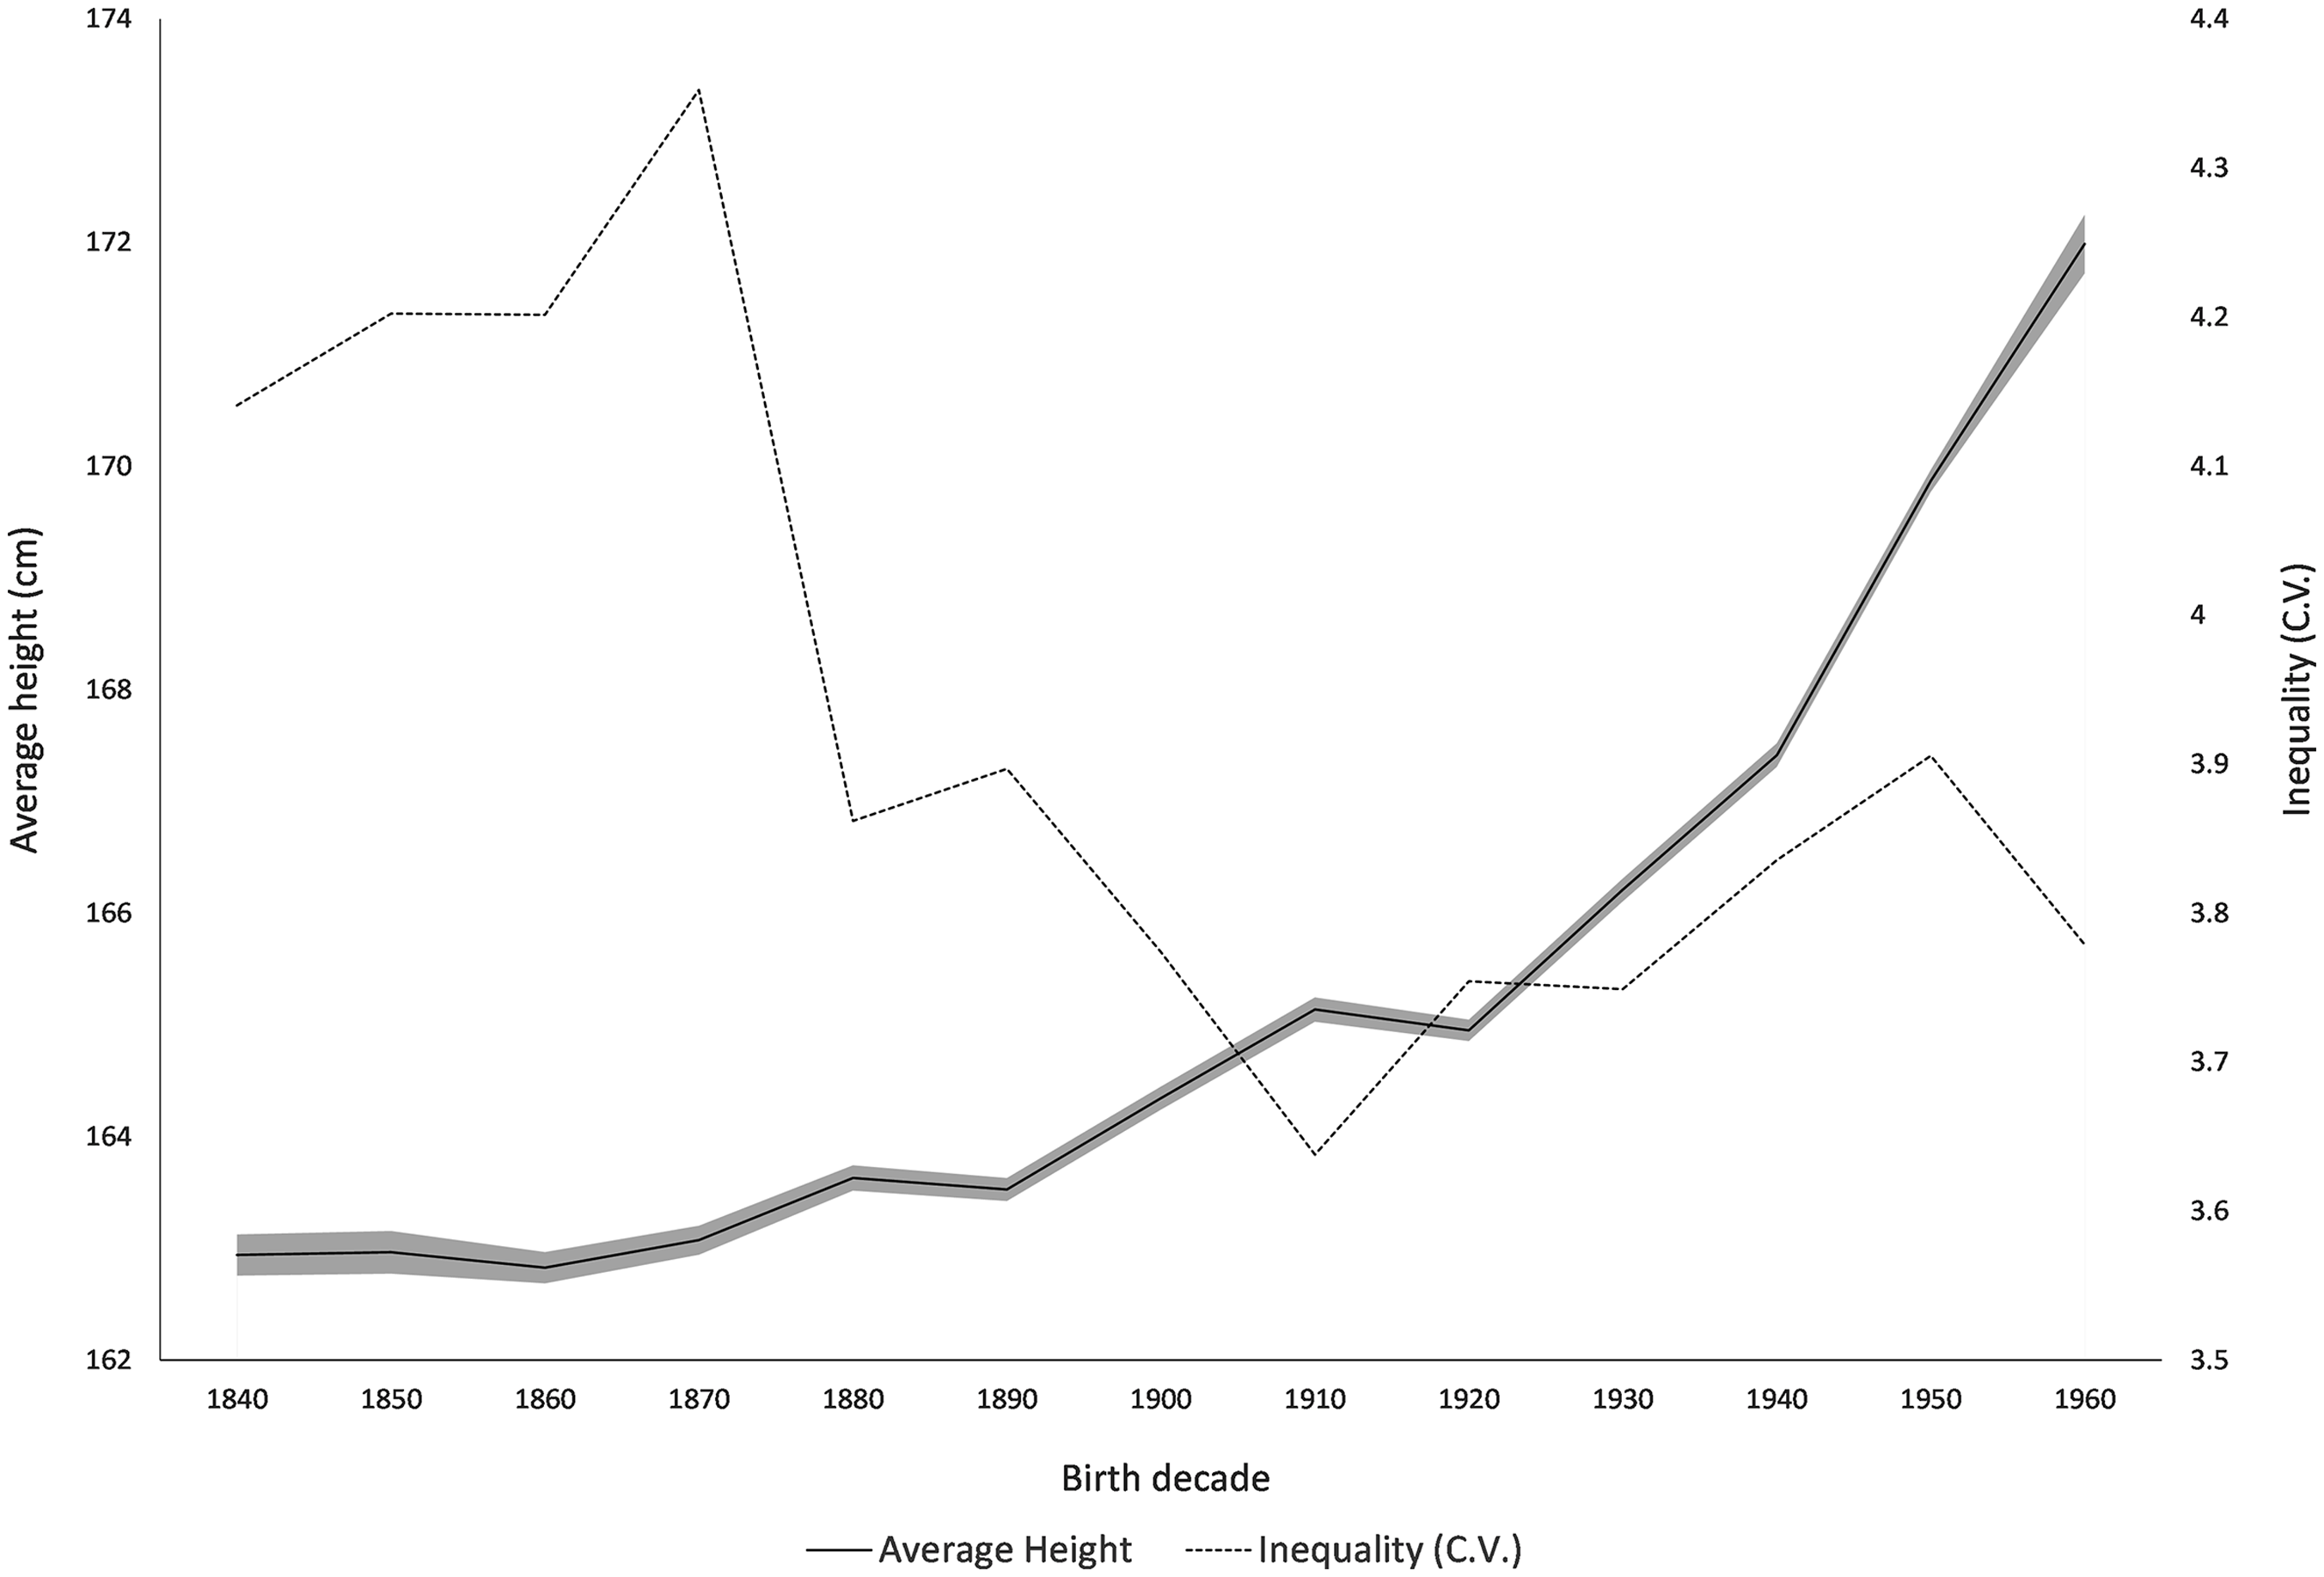
Figure 2. Average height by decade with 95 percent confidence intervals and CV in Mediterranean rural Spain; birth cohorts of 1840–1965.
Source: Conscription and call-up records from municipalities composing the anthropometric sample.
Figure 3 compares the average heights by irrigation and dry agriculture areas among the cohorts of the 1840s–1960s. The conscripts from the irrigated area were taller than those from the dry farming areas throughout the whole period. With the expansion of irrigation, a secular penalty in biological welfare can be observed in the dry agriculture areas, more prominent at the beginning of agricultural capitalism in the mid nineteenth century. In part, the deterioration of the nutritional status in dry farming areas could also be explained by the negative effects caused by the privatization of common lands, which generally affected the areas with the highest concentration of landownership (Beltran Tapia, Reference Beltrán Tapia2015). The expansion of irrigated agriculture was based on high-yield crops that coexisted with subsistence crops and, most of all, on the growing use of the factor markets. As a result, the irrigated areas generated more prosperity in terms of employment and wealth. In fact, there was a low incidence of emigration among the people from the irrigated area and its economy displayed higher growth rates (Ayuda and Puche Reference Ayuda and Puche2017). From the end of the nineteenth century, the conscripts residing in the irrigated and dry farming areas experienced an improvement in their biological welfare which, however, deteriorated slightly in the dry areas in the 1920s as a likely result of the Civil War and Franco’s autarchy. From the 1930s, the heights in both rural areas grew again and a process of relative convergence can be observed. This convergence process can also be appreciated if we observe the evolution of the annual height averages (see appendix figure A2 in the supplementary materials).

Figure 3. Average height by decade with a 95 percent confidence interval and differences in average height between the irrigated and dry farming areas of Mediterranean Spain; birth cohorts of 1840–1965.
Source: Conscription and call-up records from municipalities composing the anthropometric sample.
Which factors explain the biological advantage of populations living irrigated areas? We believe that one of the key factors could reside in the fact that the populations of irrigated areas had a good diet. Based on horticultural crops with a high vitamin and calorie content and certain basic cereals such as wheat and rice, the most fertile land of the Spanish Mediterranean was located in the irrigated areas with a greater availability of water resources and better unit yields. Table 4, which compares the average wheat and corn productions per hectare in dry farming and irrigated areas of the five provinces analyzed for several biennia of the twentieth century, shows that the production capacity of wheat and corn per hectare was greater in irrigated areas. Table 5 shows the same result for the case of some spring and autumn legumes (chickpeas and broad beans). In the specific case of wheat, particularly noteworthy are the municipalities of the provinces of Castellón and Valencia, in the Region of Valencia. The evidence coincides with the observations in the regional literature, which indicates that, with more than 20 quintals per hectare (qm/ha), the yields of the wheat crops grown in the irrigated area of Valencia were comparable to those of the best cereal-growing regions in the wet areas of Europe at the beginning of the twentieth century (Mateu and Calatayud Reference Mateu, Calatayud, Azagra, Mateu and Vidal1996: 108–9). Furthermore, table 4 not only shows the fall in agricultural yields during the Franco autarchy of the 1940s, greater in dry farming areas, but also that the yields in irrigated areas were slightly higher on the eastern coast of Spain than for Spain as a whole, at least in the case of wheat.
Table 3. Standardization of the height of the conscripts at age 21 in the irrigated and dry agriculture areas of Mediterranean Spain, birth cohorts of 1876–1890
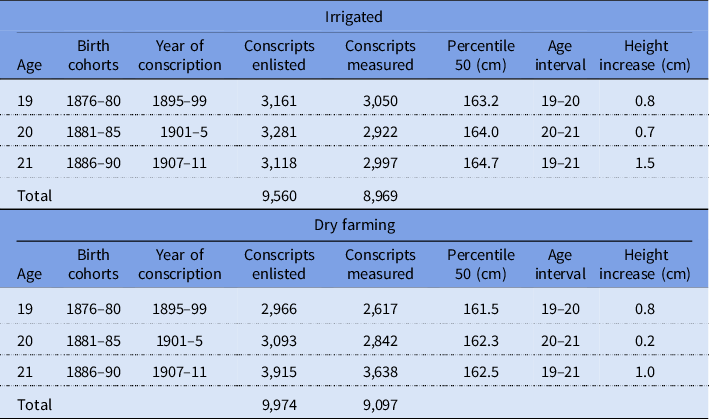
Source: Conscription and call-up records from municipalities composing the anthropometric sample.
Table 4. Differences in the average wheat and corn productions per hectare in dry farming and irrigated areas of the provinces analysed of the east coast of Spain and Spain as a whole, biennia 1904–5/1964–66 (qm/ha)

a East coast of Spain: provinces of Alicante, Castellón, Murcia, and Valencia.
Source: Annual Agricultural Statistics (https://www.mapa.gob.es/app/biblioteca/articulos/rev_numero.asp?codrevista=AEA).
Table 5. Differences in the average in some spring (chickpeas) and autumn (beans) legumes productions per hectare in dry farming and irrigated areas of the provinces analysed of the east coast of Spain and Spain as a whole, biennia 1928–29/1962–63 (qm/ha)

a East coast of Spain: provinces of Alicante, Castellón, Murcia, and Valencia.
Source: Annual Agricultural Statistics (https://www.mapa.gob.es/app/biblioteca/articulos/rev_numero.asp?codrevista=AEA).
One of the determinants contributing to the higher agricultural productivity of the irrigated area is the greater availability of water resources. Two elements intervened in the period analyzed: rainfall and the technical change that improved the capture of underground water for irrigation. With regard to rainfall, figure 4 reveals that large rainfall differences existed in Mediterranean rural Spain at the end of the twentieth century: between the fruit and vegetable producing areas such as Gandía (district of La Safor) and Pego (district of Marina Alta), with 800–700 mm per year and the dry farming areas, such Almansa, Jumilla, Yecla, or Villena, where the rainfall was no more than 400–300 mm per year. These disparities in rainfall in general could have been similar in the nineteenth century and beginning of the twentieth century. In the dry farming areas, the scarce rainfall and the high temperatures in summer significantly limited not only the crops that could be grown but also the yields obtained. In contrast to the aridity of the dry farming area, at the end of the nineteenth century, irrigation water was applied to 25 percent of the cultivated area in Valencia’s irrigated area, a higher proportion than in any other Spanish region. These irrigated areas were used for growing commercial crops (fruit and vegetables, pulses) and also to reinforce the yields of traditional crops such as basic cereals (Calatayud Reference Calatayud2011).

Figure 4. Average annual rainfall of the municipalities analyzed, 1971–2000.
Source: Atlas climático Ibérico (2011: 67). http://www.aemet.es/documentos/es/conocermas/recursos_en_linea/publicaciones_y_estudios/publicaciones/Atlas-climatologico/Atlas.pdf
As it would be expected, the differences in production had an effect on diets. According to the testimonies gathered by doctors in the medical topographies of different populations of rural Valencia at the end of the nineteenth century, there were considerable differences in diet between the fruit and vegetable growing areas, the dry farming areas, the seaside villages, and the urban centers. The doctors indicated that the climate conditions and the production specialization exercised a determining influence on the diets of the different populations. Therefore, unlike the dry farming areas that had a less diverse dietary pattern predominantly based on cereals, the diet of the populations in irrigated areas was more varied and richer. It was preferentially based on pulses, vegetables, cereals, and a wide range of fruit in addition to animal products such as pork and lamb. It also included cereals such as rice which has a high nutritional value (Barona Reference Barona2004).
The medical topographies indicate that at the beginning of the twentieth century the markets of the city of Valencia and the towns close to the irrigated areas were well stocked with meat, which came from the interior regions of the country, as well as eggs and milk (ibid.: 78–79). Although the diet in the irrigated areas of the eastern coast of Spain was essentially plant-based (e.g., cereals, vegetables, legumes, tubers), the consumption of eggs, milk, and dairy products was also significant (ibid.: 79). The incorporation of these animal-based foods was gradual within the context of the Spanish nutritional transition process (Collantes Reference Collantes2020; Hernández Adell Reference Hernández-Adell2012; Hernández Adell et al. Reference Hernández-Adell, Muñoz-Pradas and Pujol-Andreu2019). In the case of milk, the studies carried out reveal that between the end of the nineteenth century and the first third of the twentieth century there were regional differences in terms of the production and consumption of milk, depending on the type of cattle. In our area of study, that of the eastern coast of Spain, in general there was a predominance of the production and consumption of goat’s milk, which had a lower nutritional value compared to cow’s milk. This is because the acclimatization of foreign breeds of cows (Swiss and Dutch) was difficult due to the environmental limitations, such as the lower availability of pastureland (Hernández Adell Reference Hernández-Adell2012: 130–31, 188–89, 193–94). The provinces of Castellón and, most of all, Valencia were exceptions to this pattern. According to the data available from the historical statistics on Spanish agricultural production, in the period 1923–33, the average production of cow’s milk for fresh consumption in these two provinces was 58.6 percent and 84.3 percent, respectively, and 40.9 percent for the Spanish eastern coast as a whole (Grupo de Estudios de Historia Rural 1991: 412–13, 1094–95). This production, in general, was located in the large municipalities, such as the city of Valencia, with more than 300,000 inhabitants in 1930, and its surrounding areas with a predominance of irrigated agriculture. Some studies for the nineteenth century show that the proximity to sources of basic foods such as cereals, vegetables, milk, or meat products had positive effects on height. This largely explains the biological advantage of some rural communities in central Europe (Baten Reference Baten2009).
In addition to the variety and quality of the diet, we should also consider the consumption of foods per household to assess the influence of the family structure. Recent studies reveal that if there are many individuals in a family unit, the amount of available resources (e.g., income, food, medical attention, dedication to the children, patience) per individual is lower, which could affect biological well-being (Öberg Reference Öberg2017). Using population data and the number of households of the municipalities analyzed, figure 5 shows the evolution of the average number of individuals per household in the irrigated and dry farming areas of Mediterranean Spain between the mid-nineteenth century and the mid-twentieth century. We can observe that, within a long-term decreasing trend due to the drop in fertility, the average number of people per household in Mediterranean rural Spain was always higher in the dry farming areas from the beginning of the twentieth century. This was not the case in the mid-nineteenth century where the average number of people per household was slightly higher in the irrigated areas, leveling out at the end of the century. The fact that the number of members in a household was always higher in the dry farming areas from the beginning of the twentieth century suggests that this situation could affect the average consumption of food within these households, being reflected in a lower average height compared with the members of the households in irrigated areas.

Figure 5. Average number of individuals per household in the irrigated and dry farming areas of Mediterranean Spain, 1857–1960.
Source: Population censuses of Spanish Statistical Office. https://www.ine.es/intercensal/www.ine.es
Another factor that could explain the biological advantage of the populations in the irrigated areas was the better endowment of land transport infrastructures, particularly the railway. The studies carried out have shown that the construction of the railway on Spain’s eastern coast advanced more quickly in the fruit and vegetable growing areas from the 1850s (Piqueras Reference Piqueras1999: 220–21). This was fundamental for the expansion of commercial agriculture in the second half of the nineteenth century and beginning of the twentieth century. In around 1900, the railway network covered a good part of the Valencian coastline, enabling not only the expansion of intensive crops to other towns but also the arrival of goods from the main ports to the farms, such as fertilizers. For example, the imports of guano were particularly prominent. It was imported from Peru and northern Chile. Valencia was the first Spanish region to import it to increase the profitability of the irrigated crops (ibid.: 219). Instead, in the dry farming areas the railway network was less dense than in the irrigated areas, although it was fundamental for the articulation of certain inter-district markets, such as wine (Piqueras Reference Piqueras1999).
Results and Discussion: Nutritional Inequalities and Determinants
Where was there greatest nutritional differences? In the irrigated or dry farming areas? A first response to this question can be seen in figure 6, which shows the differences in the CV in the two rural environments among the cohorts of 1840s–1960s. The data show that, in general, the nutritional inequality (CV) was greater in the dry farming areas. The inequalities were higher in the mid-nineteenth century and greater in the dry farming areas. They diminished at the turn of the century until the 1910s and increased again among the cohorts of 1920s–50s, but this time they were greater in the irrigated areas. At the end of the period analyzed, the nutritional inequality in the irrigated areas diminished significantly (see figure 6). The increase in the nutritional inequality in the irrigated areas among the cohorts of 1940s could be partly associated with the increase in immigration that took place in the years 1950s–60s mainly originating in Andalusia, Castilla-La Mancha, or Murcia, regions with a lower economic development and biological welfare (Quiroga Reference Quiroga2010; Riquer Reference Riquer2010). Figure 7 shows that the populations of all the municipalities making up the sample of the irrigated area increased between 1960 and 1970 when they began to attract immigrants as a result of the agro-industrial development. However, in the dry farming municipalities, the increase in the population was much lower, with even some towns losing inhabitants.

Figure 6. CV in the irrigated and dry agriculture areas of Mediterranean Spain; birth cohorts of 1840–1965.
Source: Conscription and call-up records from municipalities composing the anthropometric sample

Figure 7. Evolution of the resident population in the municipalities analyzed between 1960 and 1970.
Source: Spanish Statistical Office. www.ine.es
To analyze the nutritional inequalities, several econometric models have been estimated, but only for the birth cohorts from 1898 to 1949 as there is insufficient information available about the variables included in the models for the rest of the cohorts of the period of study. Furthermore, it should be noted that all of the regression models that have been estimated include dummies for municipalities.
Table 6 shows the estimates for three models. One model with all of the conscripts (column 2: All) which includes a dummy variable (Dry Farming) to test whether there were significant differences in average height between the conscripts of the irrigated and dry farming areas. As this variable is highly significant, we have estimated another two models: one for the conscripts from the irrigated areas and another for those from the dry farming areas (columns 3 and 4: Irrigated and Dry Farming, respectively). If we examine the model with all the individuals (All), the estimates reveal (1) that the cohorts born in the 1940s were, on average, almost 2.5 cm taller than the cohorts born at the end of the nineteenth century and beginning of the twentieth century. There was, however, a slight stagnation in the cohorts of the 1920s, most likely attributable to the negative effects of the Spanish Civil War and the Franco autarchy of the 1940s (Puche Reference Puche2011); (2) that the conscripts residing in the irrigated areas of the Spanish Mediterranean were taller than the conscripts from the dry farming areas; on average approximately 2 cm taller; (3) that higher professional qualifications implied a taller average height; the conscripts with nonmanual semiskilled professions (His2), farmers (His3), manual workers (His4), and farmer workers (His5) were, on average, approximately 1.6 cm, 2.6 cm, 3.1 cm, and 3.4 cm shorter, respectively, than the conscripts with nonmanual professions (His1); (4) that the conscripts who were declared apt for military service were taller than those who were excluded due to physical problems, who were, on average, 1.2 cm shorter than the useful recruits; a greater anthropometric difference (2.6 cm) can be observed with respect to the excluded conscripts who, however, did not make any allegations because in general they were rejected for not having the minimum height required by the Spanish military legislation; (5) that the literate recruits were taller than the illiterate ones; approximately 1 cm taller; and (6) that, in comparison with the native recruits of the sample, the immigrant recruits born in Andalusia, Castilla-La Mancha, and other territories were shorter.
Table 6. Regression results: determinants of height and nutritional inequality in Mediterranean rural Spain; birth cohorts of 1898–1949. (Dependent variable: height at 21 years, in centimeters; with dummies for municipalities)
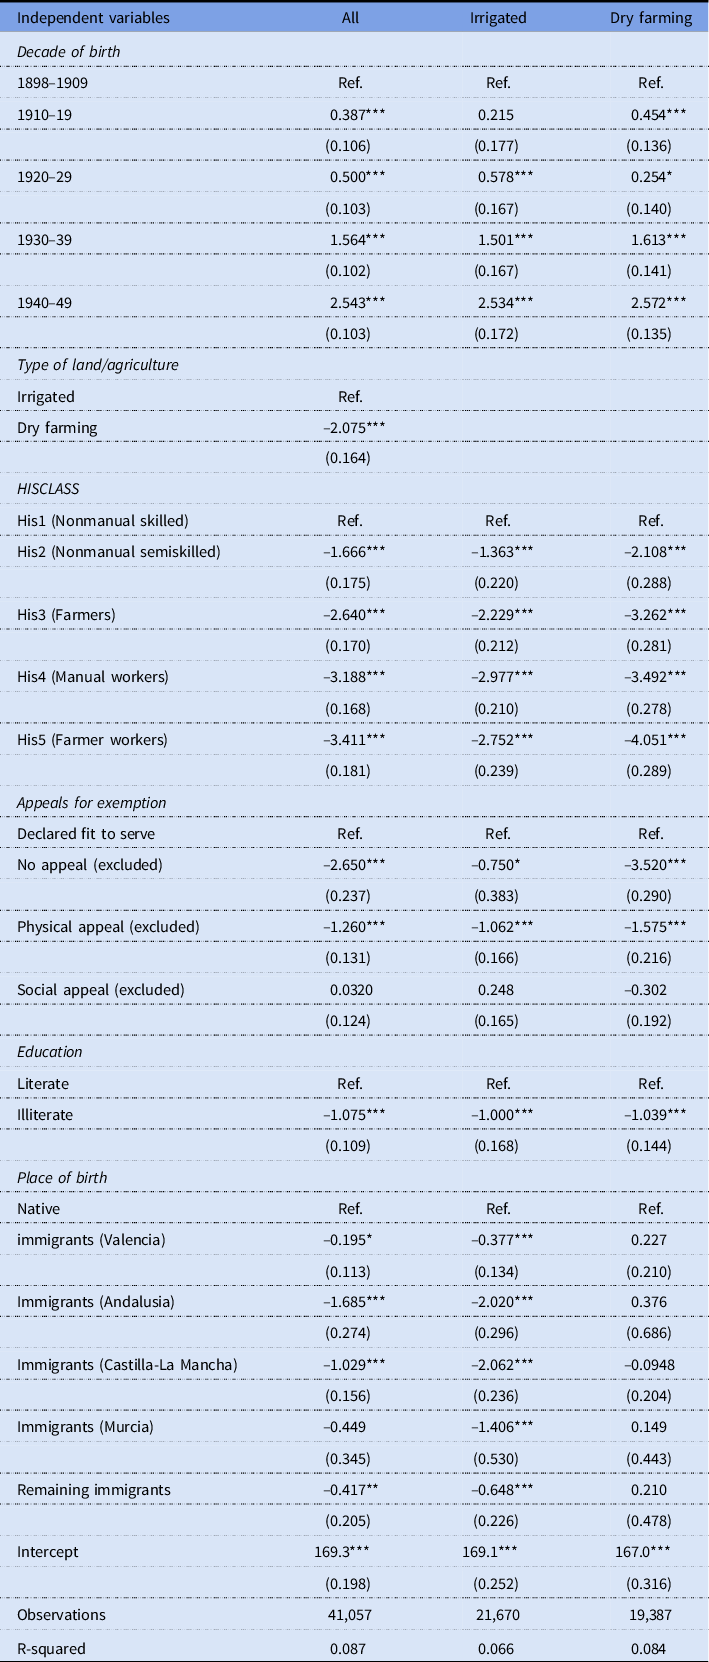
Robust standard errors in parenthesis.
***p < 0.01; **p < 0.05; *p < 0.1.
Source: Conscription and call-up records from municipalities composing the anthropometric sample.
What nutritional differences are estimated if we analyze the populations of the irrigated and dry farming areas separately? According to the results in table 6 (columns for Irrigated and Dry farming), the estimates suggest that the dry farming areas had higher levels of nutritional inequality than the irrigated areas. The growth in the average height for the whole period, estimated at approximately 2.5 cm, was similar in both agricultural areas. However, there were differences depending on the decade analyzed. For example, and contrary to what occurred in the irrigated area, the growth in height of the cohorts of the 1920s decelerated in the dry farming areas. The evidence is consistent with the hypothesis that the impact of the Civil War and the Franco autarchy of the 1940s was greater in the dry farming areas. After the postwar period, the generations born in the 1930s experienced a higher growth in the dry farming areas that started at very low levels.
Analyzing the type of profession in which the conscripts were engaged, the estimates reveal that the differences in height between the HISCLASS categories were greater in the dry farming areas than in the irrigated area, probably due to the existence of a more unequal income distribution. The case of the farm workers (His5) is illustrative. The conscripts in this category from the irrigated area were approximately 2.7 cm shorter than their counterparts in the category of nonmanual skilled (His1). In the dry farming area, this estimated difference increased to up to 4 cm, suggesting a greater economic inequality between social classes in the dry agriculture area. This is apparent in the difference observed in the wages paid to the agricultural workers in the dry farming and irrigated areas of the east coast of Spain. The available data show that at the end of World War I, the wages paid to the day laborers in irrigated areas were, in relative terms, higher than those in dry farming areas (Calatayud Reference Calatayud1986: 279; Martínez Soto Reference Martínez-Soto and Martínez-Carrión2002: 647–48, 652). Within the irrigated area, the highest wages were paid in the rice-growing areas (Alcázar Reference Alcàzar1989: 173). In general, the data suggest that the income distribution in Mediterranean rural Spain was more balanced in irrigated areas.
If we consider the “allegations for exclusion,” the anthropometric differences between apt recruits and excluded recruits were also greater in the dry farming areas. While in the irrigated areas the recruits excluded for physical reasons were, approximately 1 cm shorter than the apt recruits, in the dry farming areas this physical gap was as much as 1.5 cm. We can find larger differences between the excluded recruits who did not present any type of allegation. While in the irrigated areas, these excluded recruits were approximately 0.7 cm shorter than the apt recruits, in the dry farming area the difference was much larger, almost 3.5 cm shorter with respect to the apt recruits. If we consider that the majority of these recruits were excluded for being shorter than the minimum height, we can infer that stunting was more widespread in the dry farming areas.
With respect to the “education” factor, the estimates suggest that, both in the irrigated and dry farming areas, the illiterate recruits were approximately 1 cm shorter than the literate recruits. Finally, and with respect to the “place of birth,” we can observe that the immigration movements had greater significance in the irrigated areas. The evidence is consistent with the greater employment opportunities and wealth in the irrigated areas. In these areas, the immigrant conscripts from other towns in Valencia were, approximately 0.3 cm shorter. This difference increases considerably when the comparison is made with the immigrant conscripts born in the regions of Andalusia, Castilla-La Mancha, and Murcia, who were, approximately 2 cm, 2 cm, and 1.4 cm shorter, respectively.
Although the estimates in table 6, on the whole, reveal that the nutritional inequalities according to the HISCLASS categories were greater in the dry farming areas than in the irrigated areas, table 7 presents five new models, one for each HISCLASS category. The principal objective of this exercise is to determine which professional categories were most affected by nutritional inequality. If we consider the variable “type of land/agriculture,” the estimates obtained show a very revealing result: In the gap documented between the irrigated areas and dry farming areas, the nutritional differences were only present in the farmers (His3), manual workers (His4), and farm workers (His5) categories. The recruits in the dry farming areas in these three categories were, approximately 2.0 cm, 2.6 cm and 3.3 cm shorter than their counterparts from irrigated areas. On the contrary, the estimates suggest that these nutritional inequalities in nonmanual professions (His1) and nonmanual semiskilled professions (His2) were not significant. The econometric evidence, therefore, reveals that, in the long term, among the birth cohorts of the first half of the twentieth century, dry farming penalized the biological well-being of farmers, manual workers and farm workers, but not that of the other occupational groups that did not depend directly on farming.
Table 7. Regression results: determinants of height and nutritional inequality in Mediterranean rural Spain by categories HISCLASS; birth cohorts of 1898–1949. (Dependent variable: height at 21 years, in centimeters; with dummies for municipalities)

Robust standard errors in parenthesis.
***p < 0.01; **p < 0.05; *p < 0.1.
Source: Conscription and call-up records from municipalities composing the anthropometric sample.
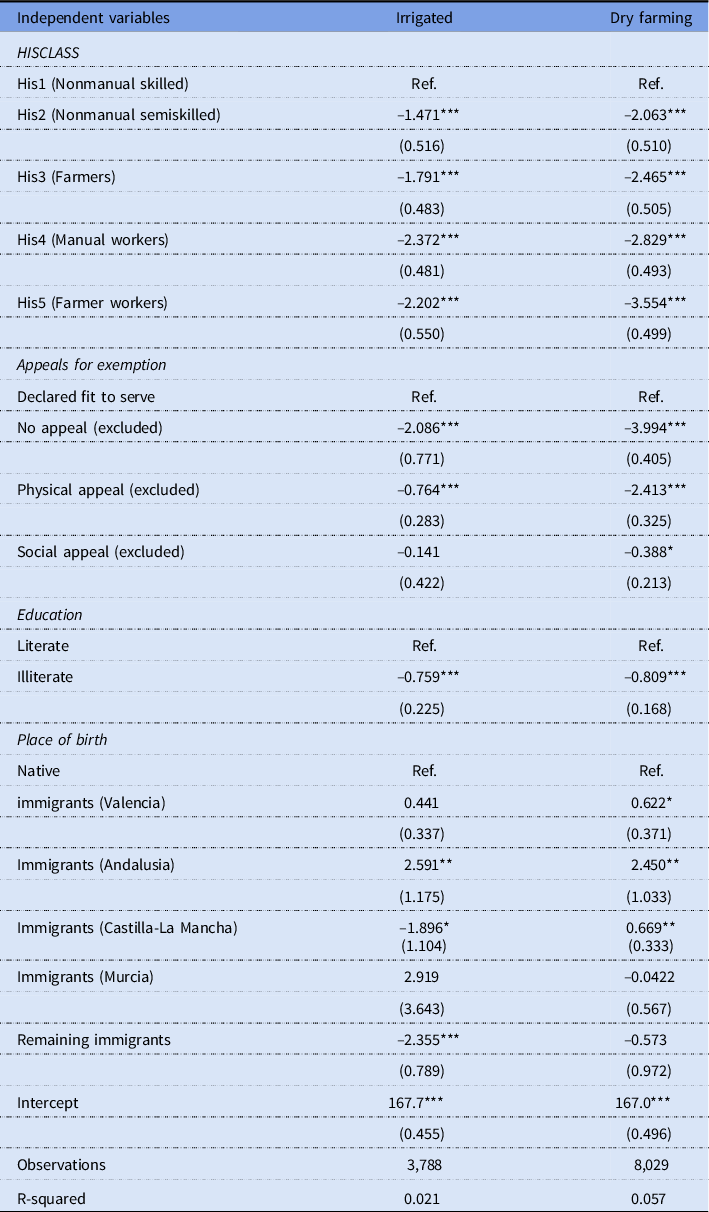
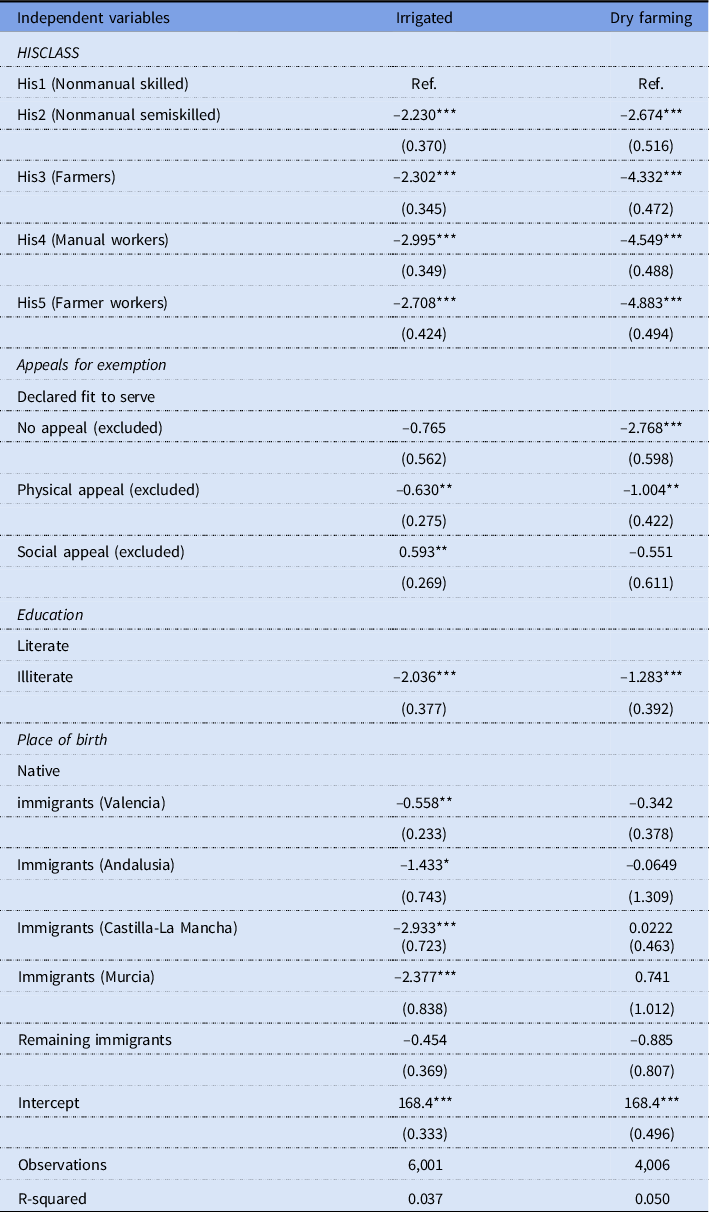
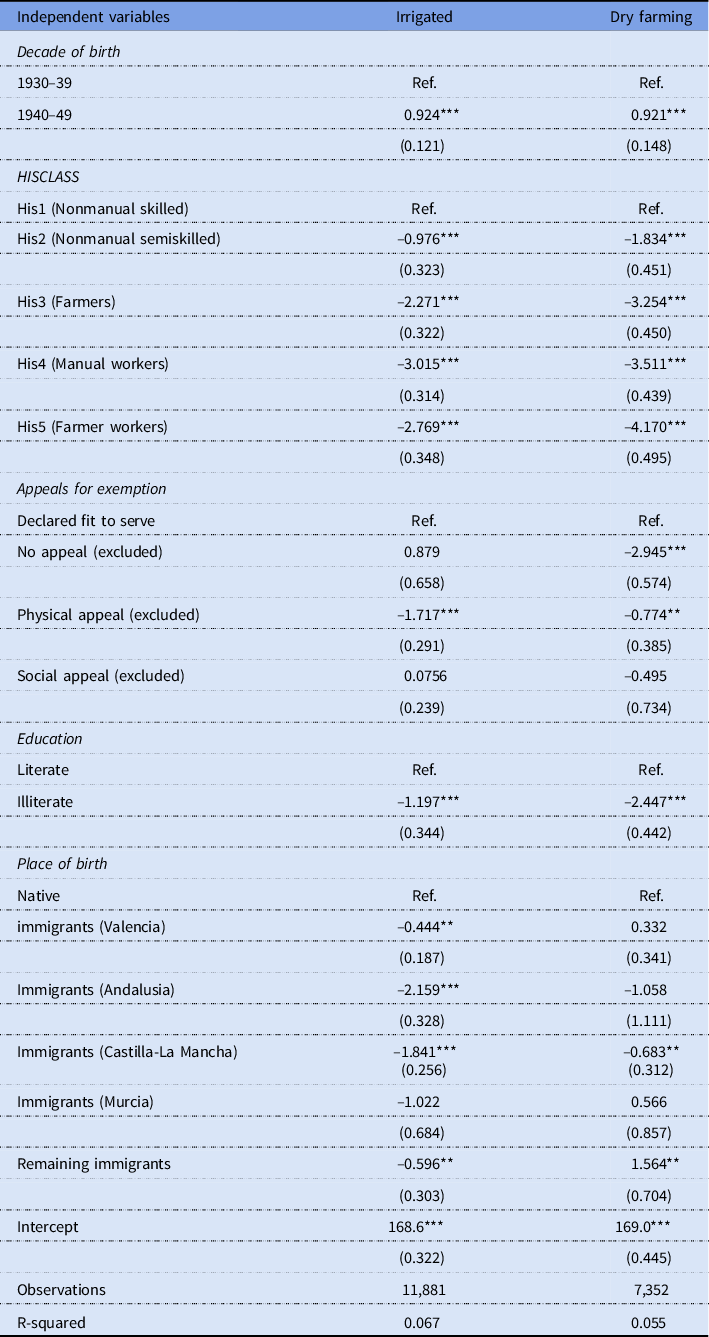
Tables 8, 9, and 10 show the estimates of the models for the birth cohorts of 1898–1915, 1916–29, and 1930–49, respectively, distinguishing between irrigated and dry farming areas. The reason for this periodization is to determine whether the nutritional inequalities in the two types of agriculture of the Spanish Mediterranean reduced over time or whether, on the contrary, they increased. Two main conclusions can be drawn from the results obtained in the three regressions: First, the nutritional inequalities were always greater in the dry farming areas than in the irrigated areas: the estimates of the parameters accompanying the variables for “HISCLASS,” “exemption allegations,” and “education” suggest this (see tables 8, 9, and 10); and second, we can observe that the nutritional inequality increased during the Franco dictatorship; compared to the first subperiod selected (birth cohorts of 1898–1915), the nutritional inequalities in the irrigated and dry farming areas increased among the cohorts of 1916–29 and 1930–49, coinciding with the military conscriptions of the Civil War and the Franco dictatorship; the estimates of the parameters accompanying the variables for “HISCLASS” and “education” suggest this (see tables 9 and 10 compared to table 8); the estimates seem to confirm that the increase in the nutritional inequality during the Franco dictatorship was greater among the more disadvantaged social classes, with less professional skills and a lower level of education, as revealed by other recent anthropometric studies (Cámara and Martínez-Carrión Reference Cámara and Miguel Martínez-Carrión2018; Cámara et al. Reference Cámara, Miguel Martínez-Carrión, Puche and Maria Ramon-Muñoz2019; Cañabate and Martínez-Carrión Reference Cañabate and Miguel Martínez-Carrión2018; Martínez-Carrión and Puche Reference Martínez-Carrión and Puche2009); this result coincides with the evolution analyzed in the CV in rural Mediterranean Spain and its different agricultures from the cohorts born in the 1920s (see figures 2 and 6).
Table 8. Regression results: determinants of height and nutritional inequality in the irrigated and dry farming areas of Mediterranean Spain; birth cohorts of 1898–1915. (Dependent variable: height at 21 years, in centimeters; with dummies for municipalities)
Robust standard errors in parentheses.
***p < 0.01; **p < 0.05; *p < 0.1.
Source: Conscription and call-up records from municipalities composing the anthropometric sample.
Table 9. Regression results: determinants of height and nutritional inequality in the irrigated and dry farming areas of Mediterranean Spain; birth cohorts of 1916–29. (Dependent variable: height at 21 years, in centimeters; with dummies for municipalities)
Robust standard errors in parentheses.
***p < 0.01; **p < 0.05; *p < 0.1.
Source: Conscription and call-up records from municipalities composing the anthropometric sample.
Table 10. Regression results: determinants of height and nutritional inequality in the irrigated and dry farming areas of Mediterranean Spain; birth cohorts of 1930–49. (Dependent variable: height at 21 years, in centimeters; with dummies for municipalities)
Robust standard errors in parentheses.
***p < 0.01; **p < 0.05; *p < 0.1.
Source: Conscription and call-up records from municipalities composing the anthropometric sample.
Finally, and with respect to the “place of birth,” the estimates obtained confirm that the immigrant recruits were, on average, shorter than the native conscripts. The models estimated for the three periods considered confirm that these differences were more significative in the irrigation areas than in the dry farming areas. These migratory movements were the result of the differences in the economic dynamism and biological welfare of the different Spanish regions (Quiroga Reference Quiroga2010; Riquer Reference Riquer2010). If we observe the estimates for the irrigated farming municipalities corresponding to the cohorts of 1930–49 (called up during the 1950s and 1960s and with the highest proportion of internal migrations), we can see that the recruits born in Andalusia and Castilla-La Mancha were, approximately, 2.1 cm and 1.8 cm shorter, respectively, than the native recruits (see table 10). These anthropometric differences can also be seen from the cohorts of 1916–29, during the military conscriptions of the Civil War and the Franco autarchy of the 1940s (see table 9).
Conclusions
Four decades of anthropometric history have produced significant findings regarding the impact of the industrialization processes on biological welfare. However, we know little about the biological welfare in the rural environment and less still about the differences within the rural world depending on the types of agriculture from the beginning of modern economic growth. This article offers unprecedented results on the topic which may be of interest to policy makers in low income and developing countries. Based on the diversity that characterises European Mediterranean agriculture, this article analyzes the dynamics of heights in the dry farming and irrigation areas of Mediterranean Spain, studying the scope of the nutritional inequality in relation to some of its determining factors.
Using a broad database of heights and other characteristics of the conscripts of the eastern coast of Spain, the results reveal two important findings. First, that the populations in the intensive irrigation areas were taller than those in the dry farming areas although these differences fluctuated throughout the period. The Mediterranean fruit and vegetable growing areas, contrary to the dry farming areas, had comparative advantages in the production of goods. The greater availability of irrigation water was fundamental. The supply of water was regular and its availability enabled more intensive use and higher yields in traditional crops and livestock. The irrigation water, which was obtained, first from the surface of the rivers and then from underground through the drilling of wells, was used to irrigate commercial crops (e.g., oranges, rice, vegetables, fruit) and improve the yields of traditional crops such as cereals. The favorable conditions of mild temperatures and sunlight were also influential and the impact of these two factors on the productivity of the cultivated land was decisive. As a result, improved productivity in irrigated areas was reflected in the food supply and a more varied diet, rich in vitamins, protein, and calories.
Second, the analysis of the coefficient of variation and the econometric models show that the nutritional inequality was higher in the dry farming areas, probably explained by a less equal distribution of property of land, relatively lower agricultural wages, and, in short, a more unequal distribution of income. The greater differences in height among the professional categories of the HISCLASS (especially in the farmers [His3], manual workers [His4], and farm workers [His5], professional categories directly related to the agricultural sector and manual occupations) in the dry farming areas suggest this. The inequalities in height were high in the mid-nineteenth century, greater in the dry farming areas. They fell at the end of this century and the beginning of the twentieth century and increased again with the cohorts of 1920s–50s, this time greater in the irrigated areas, coinciding with the military recruits of the Franco dictatorship. The estimates corroborate the increase in the nutritional inequality during the Franco dictatorship which particularly affected the most disadvantaged social groups with scarce economic and educational resources.
Supplementary Material
To view supplementary material for this article, please visit https://doi.org/10.1017/ssh.2022.11
Acknowledgments
We are grateful for the support and funding received from the Ministry of Science and Innovation of the Government of Spain (Projects PID2020-113793GB-I00, PID2019-106822RB-I00, PID2019-109470GB-I00, PGC2018-095529-B-I00, HAR2016-76814-C2-2-P, and Research Network RED2018-102413-T); and from the Government of Aragon and the European Regional Development Fund (ERDF) (Research Groups S55_20R and S40_20R). Preliminary versions of the paper were discussed at the universities of Murcia and Zaragoza (2018). The comments made by the reviewers significantly improved the initial version.


 Open access