


Introduction
The Hagberg–Perten Falling Number (FN) method was developed to measure starch degradation by α-amylase enzyme activity in wheat grain resulting from preharvest sprouting (Hagberg, Reference Hagberg1960; Perten, Reference Perten1964; Ross and Bettge, Reference Ross, Bettge and Carver2009; Delwiche et al., Reference Delwiche, Vinyard and Bettge2015). Preharvest sprouting is the initiation of grain germination on the mother plant when rain occurs before harvest. α-amylase is produced during late germination and after germination per se to mobilize starch into sugars to fuel seedling growth. α-amylase cleaves starch into shorter starch chains with lower gelling capacity, leading to poor end-use quality. The wheat industry uses the FN test to measure gelling capacity. During the FN test, a water and wheat meal mixture is heated with mixing in a 100°C water bath to form a paste, then the time required for a stirrer to fall through the mixture is measured in seconds to obtain the ‘falling number’. The more α-amylase activity present in a sample, the less well the mixture gels, causing the stirrer to fall faster, resulting in a lower FN. Buyers purchase grain with an FN below 300 s at a discounted price because a low FN is associated with a higher risk of poor end-use quality, including cakes that fall and sticky noodles or bread. In addition to preharvest sprouting, elevated α-amylase can result from genetic susceptibility to late maturity α-amylase (LMA), the induction of α-amylase by cool or high temperatures during late grain maturation (Derkx and Mares, Reference Derkx and Mares2020; Barrero et al., Reference Barrero, Porfirio, Hughes, Chen, Dillon, Gubler and Ral2020). LMA is sometimes considered a defect in late grain development because α-amylase is produced during grain filling, a time in development when α-amylase levels are usually low and when the endosperm is accumulating rather than breaking down starch (Barrero et al., Reference Barrero, Mrva, Talbot, White, Taylor, Gubler and Mares2013).
LMA differs from germination and preharvest sprouting in two respects: the location of α-amylase expression and the effect on end-product quality. During germination, α-amylase expression is first induced in the scutellum and aleurone layer at the embryo-proximal end of the grain because gibberellin (GA) hormone from the embryo is the signal inducing α-amylase expression (reviewed by Jacobsen et al., Reference Jacobsen, Gubler, Chandler and Davies1995). During LMA, α-amylase is expressed throughout the aleurone, apparently associated with randomly spaced patches of cell death (Mrva et al., Reference Mrva, Wallwork and Mares2006). Some studies suggest that low FN/high α-amylase due to LMA does not impact end-use quality as strongly as high α-amylase due to preharvest sprouting in bread and in cakes (Ral et al., Reference Ral, Whan, Larroque, Leyne, Pritchard, Dielen, Howitt, Morell and Newberry2016; Kiszonas et al., Reference Kiszonas, Engle, Pierantoni and Morris2018; Newberry et al., Reference Newberry, Zwart, Whan, Mieog, Sun, Leyne, Pritchard, Daneri-Castro, Ibrahim, Diepeveen, Howitt and Ral2018). Other hydrolytic enzymes expressed during germination are likely responsible for the stronger impact on end-product quality after preharvest sprouting. Unfortunately, the FN method cannot differentiate between these two causes of low FN. Thus, farmers experience financial losses regardless of whether low FN is caused by LMA or preharvest sprouting. For this reason, it is important to understand the genetic mechanisms governing LMA. LMA susceptibility has been detected in Australian, UK and German wheat germplasm (Farrell and Kettlewell, Reference Farrell and Kettlewell2008; Mares and Mrva, Reference Mares and Mrva2008; Börner et al., Reference Börner, Nagel, Agacka-Mołdoch, Gierke, Oberforster, Albrecht and Mohler2018). While LMA has been well characterized in Australian germplasm, much remains to be learned about the scope of the LMA problem in the USA (reviewed in Mares and Mrva, Reference Mares and Mrva2014). Low FN without rain has led to severe financial losses in the northwestern USA, suggesting that there is LMA susceptibility in U.S. wheat (Sjoberg et al., Reference Sjoberg, Carter, Steber and Garland-Campbell2020).
Previous studies have characterized LMA in Australian, UK and International Maize and Wheat Improvement Center (CIMMYT) germplasm (Mrva and Mares, Reference Mrva and Mares2001a; McNeil et al., Reference McNeil, Diepeveen, Wilson, Barclay, McLean, Chalhoub and Appels2009; Emebiri et al., Reference Emebiri, Oliver, Mrva and Mares2010; Farrell et al., Reference Farrell, Kettlewell, Simmonds, Flintham, Snape, Werner and Jack2013). Two major LMA loci were mapped to the centromeric region of chromosome 3B and to the distal end of the long arm of chromosome 7B (Mrva and Mares, Reference Mrva and Mares2001a; McNeil et al., Reference McNeil, Diepeveen, Wilson, Barclay, McLean, Chalhoub and Appels2009; Emebiri et al., Reference Emebiri, Oliver, Mrva and Mares2010). Other LMA-associated loci have been mapped to chromosomes 2DL, 3A, 3B, 3D, 4B, 4D, 5B, 5D and 6B (Emebiri et al., Reference Emebiri, Oliver, Mrva and Mares2010; Tan et al., Reference Tan, Verbyla, Cullis, Martin, Milgate and Oliver2010). Elevated LMA susceptibility has been associated with the tall/wild-type alleles of the reduced height (Rht) genes, Rht-B1a and Rht-D1a, and with the 1B/1R translocation in UK and Australian germplasm (Mrva et al., Reference Mrva, Cheong, Yu, Law and Mares2009; Farrell et al., Reference Farrell, Kettlewell, Simmonds, Flintham, Snape, Werner and Jack2013).
Genome-wide association studies (GWASs) have been a useful tool to identify putative marker-trait associations based on historical recombination events in a panel of loosely related lines (reviewed in Hayes, Reference Hayes, Gondro, van der Werf and Hayes2013; also, Emebiri et al., Reference Emebiri, Oliver, Mrva and Mares2010; Martinez et al., Reference Martinez, Godoy, Huang, Zhang, Carter, Garland Campbell and Steber2018). This approach benefits from higher allelic recombination rates than typically found in the F5:F7 biparental recombinant-inbred line populations. Principal component analysis and kinship matrices are used to reduce false positives when calculating marker-trait associations (Marchini et al., Reference Marchini, Cardon, Phillips and Donnelly2004; Liu et al., Reference Liu, Huang, Fan, Buckler and Zhang2016). Associations identified can later be validated in biparental populations segregating for the quantitative trait locus (QTL) of interest.
The goal of this study was to examine the scope of the LMA problem in North American wheat by characterizing LMA susceptibility in a hard spring wheat association mapping panel representing ten North American breeding programmes. The Triticeae Coordinated Agricultural Project (TCAP) developed this panel to map disease resistance and agronomic traits using a genome-wide association mapping approach (https://www.triticeaecap.org; Narayanan and Vara Prasad, Reference Narayanan and Vara Prasad2014; Wang et al., Reference Wang, Wong, Forrest, Allen, Chao, Huang, Maccaferri, Salvi, Milner, Cattivelli and Mastrangelo2014; Bajgain et al., Reference Bajgain, Rouse, Bulli, Bhavani, Gordon, Wanyera, Njau, Legesse, Anderson and Pumphrey2015; Godoy et al., Reference Godoy, Gizaw, Chao, Blake, Carter, Cuthbert, Dubcovsky, Hucl, Kephart, Pozniak and Prasad2018). Given that the LMA screening method is labour-intensive, identifying LMA-linked markers could greatly facilitate breeding for LMA resistance in North American wheat germplasm. The resulting data were used to compare LMA resistance across breeding programmes, to examine sources of variability in LMA testing results and to perform a preliminary GWAS to identify marker-trait associations.
Materials and methods
Germplasm
The association panel was composed of 251 hard-red and hard-white spring wheat varieties from ten North American wheat breeding programmes assembled as part of the TCAP (https://www.triticeaecap.org). This panel was successfully used to characterize root morphology traits, to identify stem rust and stripe rust resistance loci and to map loci linked to agronomic traits (Narayanan and Vara Prasad, Reference Narayanan and Vara Prasad2014; Bajgain et al., Reference Bajgain, Rouse, Bulli, Bhavani, Gordon, Wanyera, Njau, Legesse, Anderson and Pumphrey2015; Godoy et al., Reference Godoy, Gizaw, Chao, Blake, Carter, Cuthbert, Dubcovsky, Hucl, Kephart, Pozniak and Prasad2018). The panel included elite lines representing North American wheat breeding programmes including: (1) the CIMMYT programme located in Mexico; (2) Canadian programmes at Agriculture and Agri-Food Canada (Ag-Canada) Manitoba, Ag-Canada Saskatchewan and Ag-Canada Alberta and (3) the U.S. programmes at Montana State University (MSU), South Dakota State University (SDSU), the University of California-Davis (UCD), the University of Idaho (UI), the University of Minnesota (UMN) and Washington State University (WSU). The propagule of wheat is a caryopsis that will be referred to as ‘grain’ in this paper.
Greenhouse LMA evaluation
Greenhouse LMA-induction experiments, GH2017, GH2018 and GH2019, were conducted in the Plant Growth Facility, Pullman, WA. GH2018 and GH2019 were performed using conditions optimized for germplasm with variable developmental rates (Liu, Reference Liu2019; Liu et al., Reference Liu, Tuttle, Garland-Campbell, Pumphrey and Steber2021). For each genotype, two pots containing two plants each were grown in a glasshouse (22–24°C day/15–17°C night) with natural light supplemented with sodium lamps as needed to reach a 16 h photoperiod with 400 μmol quanta m−2 s−1 light. The first three tillers of each pot were tagged when florets in the centre of the spike reached anthesis. Not all wheat tillers and not all wheat florets within a spike reach the LMA-susceptible soft dough stage at the same time because wheat flowers asynchronously (Mares and Mrva, Reference Mares and Mrva2008). The first three tillers were LMA-treated because they tend to flower within a few days of each other. If the timing of anthesis differed too much between these tillers, then only two spikes were LMA-treated leading to occasional missing data. The florets within a spike reach anthesis somewhat asynchronously. Florets were opened with a pair of tweezers to identify the stage when florets in the centre of the spike shed pollen. The rationale for treating a spike as a single sample was that there should be some grains a little older and some a little younger in the spike, increasing the chances of detecting a possible LMA event within the spike. The spike-to-spike variability in enzyme activity was not decreased by assaying only 20 grains from the bottom third of the spike (Liu et al., Reference Liu, Tuttle, Garland-Campbell, Pumphrey and Steber2021).
After tagging at anthesis, pots were moved to a warm growth chamber (Conviron™ GR96) with a 25°C day/18°C night thermocycle, 45–65% relative humidity and a 16 h day/8 h night photoperiod. Pot positions in growth chambers were rotated weekly to reduce positional effects. Plants were moved to the cool chamber at the soft dough stage of grain development (Zadock 85; Zadocks et al., Reference Zadoks, Chang and Konzak1974; Barrero et al., Reference Barrero, Mrva, Talbot, White, Taylor, Gubler and Mares2013). The LMA-susceptible stage was expected to occur between 430 and 516 Growing Degree Days post-anthesis (GDDpa) [20–28 days post-anthesis (dpa) when incubated at 25°C day/18°C night temperature] (Miller et al., Reference Miller, Lanier and Brandt2001; Liu et al., Reference Liu, Tuttle, Garland-Campbell, Pumphrey and Steber2021). Wheat grain is LMA-susceptible at the soft dough stage of grain development: when the endosperm is soft but not fluid, the grain is transitioning from green to beige, and the vascular bundle is green, not yet yellow or purple (Zadock 85; Zadocks et al., Reference Zadoks, Chang and Konzak1974; Barrero et al., Reference Barrero, Mrva, Talbot, White, Taylor, Gubler and Mares2013; Liu et al., Reference Liu, Tuttle, Garland-Campbell, Pumphrey and Steber2021). Because individual lines in the population showed a good deal of variability for the length of time required to transition from anthesis to the LMA-susceptible soft dough stage, the LMA window was confirmed based on the inspection of a grain from the spike at 16–29 dpa. As the wheat approached 430–516 GDDpa, a single grain was removed from the centre of tagged spikes that had lost most green colouration but were not yet dry. If the grain appeared to be at the correct stage, then the plant was subjected to cold temperature treatment. For each genotype, one pot was left in the warm chamber (25°C day/18°C night) as an untreated control, and one pot was treated for 7 d in a cool chamber (Conviron™ GR48 with high-pressure sodium lamps) for LMA induction at 18°C day/7.5°C night with a 16 h photoperiod. After the 7-d cold treatment, plants were returned to the warm chamber and allowed to mature at 25°C day/18°C night for 3–4 weeks. Three treated and three untreated spikes that reached anthesis within a 3-d range were hand-harvested and threshed. The three spikes from a single pot were considered to be three samples for statistical analysis. Due to the limited availability of controlled environment chamber space, the two experiments (expt) were divided into three (GH2018) or two (GH2019) runs.
Greenhouse LMA-induction experiment GH2017 was conducted in a single run using a detached-tiller method based on Mrva and Mares (Reference Mrva and Mares2001a), except that the cold treatment was conducted at 18°C day/7.5°C night instead of 18°C d/12°C. Briefly, two pots containing two plants each were grown in a warm glasshouse (22–24°C day/15–17°C night). Three spikes per pot were tagged at anthesis. At 26 dpa (~507 GDDpa), tillers were cut at the first internode and placed in a bucket of water. Untreated controls remained in the glasshouse, while cold-treated spikes were incubated for 7 d in a cool chamber (Conviron™ GR48) for LMA induction at 18°C day/7.5°C night with a 16 h photoperiod. After the cold treatment, tillers were returned to the glasshouse until fully mature within 3–4 weeks.
For GH2017, GH2018 and GH2019, all of the grains from each single spike were ground separately with a coffee grinder, and α-amylase enzyme activity determined with the Phadebas™ amylase assay adapted for use in a 96-well format (Kiszonas et al., Reference Kiszonas, Engle, Pierantoni and Morris2018; Liu et al., Reference Liu, Tuttle, Garland-Campbell, Pumphrey and Steber2021). The Phadebas™ assay uses a water-insoluble starch substrate that is hydrolyzed by α-amylase to form water-soluble blue starch fragments. The α-amylase activity was measured in absorbance units (Au) at 620 nm (A 620) because Au is a direct function of α-amylase activity (Mares et al., Reference Mares, Mrva and Panozzo1994; Liu et al., Reference Liu, Tuttle, Garland-Campbell, Pumphrey and Steber2021). Untreated and treated samples were assayed in separate 96-well plates. Replicate spikes or plots were assayed separately, as three or two complete blocks. Every 96-well plate contained three standards to control plate-to-plate variation. These samples were from field-grown soft white winter wheat of known FN obtained from Washington State University Variety Testing. These samples included a high FN 431 s standard ‘Eltan’ 2014, an FN 300 s standard ‘Stephens’ 2011 and an FN 244 s standard ‘Bruehl’ 2013. The average enzyme activity of these standards was calculated over 36 repetitions in Liu et al. (Reference Liu, Tuttle, Garland-Campbell, Pumphrey and Steber2021): FN 431 s was 0.04 Au (SD 0.02), FN 300 s was 0.21 (SD 0.07) and FN 244 s was 0.61 (SD 0.24). A linear regression was performed using the stated standard Au values as y and the standard Au values from a specific plate as x (R 2 0.98–1.0) and was used to adjust experimental values on each plate.
Field LMA evaluation
A detached-tiller LMA-induction protocol based on the procedure of Mrva and Mares (Reference Mrva and Mares2001a,Reference Mrva and Maresb) was used to test field-grown material. Two complete blocks of 213 TCAP lines were planted as single head rows in the last week of April 2018 at the Spillman Agronomy Farm, Pullman, WA. Space limitations did not allow the propagation of the entire populations of 251 lines in that season. Occasional irrigation was applied before anthesis. The anthesis date was defined as the day when at least 50% of the spikes were at anthesis. When the lines reached between 430 and 520 GDDpa, rows were examined every other day to identify plots where most of the tillers were at the LMA-susceptible stage based on the predominance of kernels in the soft dough stage of grain filling. At this stage, 40 tillers were collected from each head row by cutting near the soil line with scissors. Wheat bouquets were placed in buckets of water immediately after cutting. Water was changed as needed. In total, 20 tillers were left out of doors as an untreated control, and 20 tillers were cold treated at 18°C day/7.5°C night, 55–75% relative humidity and 16 h photoperiod for 7 d (Reliance™ incubator with EvaDry dehumidifier). A dehumidifier was included to ensure that α-amylase expression resulted from LMA because the humidity rose to over 90% at night and visible sprouting was observed in a preliminary LMA experiment. After the cold treatment, the wheat bouquets in water were left to mature out of doors. Wheat bundles of 20 spikes were bulked and threshed using a head-thresher (Precision Machine Co., Inc #WHTA0100001), then 20 g samples were milled with a Udy Cyclone Sample Mill with a 0.5 mm screen (www.udyone.com). The FN test was performed as in Martinez et al. (Reference Martinez, Godoy, Huang, Zhang, Carter, Garland Campbell and Steber2018). Phadebas α-amylase enzyme assays were performed using 0.2 g of meal as described above.
Greenhouse LMA time course
A single preliminary LMA time course experiment was conducted to compare the developmental timing of the LMA-induction window in five cultivars from the TCAP population: ‘UC1599’, ‘Glencross’, ‘Lillian’, ‘GP069’ and ‘Scarlet’. Plants were grown at 25°C day/18°C night. Spikes were moved to a cold chamber 18°C day/7.5°C night for 7 d beginning at indicated time points ranging from 17 to 32 dpa.
Genotyping and marker data
Single-nucleotide polymorphisms (SNPs) were genotyped in 242 of the 251 lines in the panel as described in Godoy et al. (Reference Godoy, Gizaw, Chao, Blake, Carter, Cuthbert, Dubcovsky, Hucl, Kephart, Pozniak and Prasad2018). The panel was genotyped using the Illumina iSelect 90 K SNP chip array at the USDA-ARS genotyping laboratory in Fargo, SD (Wang et al., Reference Wang, Wong, Forrest, Allen, Chao, Huang, Maccaferri, Salvi, Milner, Cattivelli and Mastrangelo2014). Allele calls were made using GenomeStudio v2011.1 (Illumina). Complete genotype information for 34,137 SNPs in the TCAP90K_SpringAM_panel was obtained from the Triticeae Toolbox (https://triticeaetoolbox.org/wheat/). SNPs with a minor allele frequency (MAF) below 0.05 were eliminated from the dataset to reduce the potential for mapping false positives (Tabangin et al., Reference Tabangin, Woo and Martin2009). As a result, 19,192 SNP markers were used for genome-wide association mapping. The marker positions were obtained from the wheat genome consensus map (Wang et al., Reference Wang, Wong, Forrest, Allen, Chao, Huang, Maccaferri, Salvi, Milner, Cattivelli and Mastrangelo2014). Principal components (PCs) of the 242 lines were analysed using the prcomp function in R (v3.6) based on the 19,192 SNP markers. To visualize the population structure, genetic variation explained by PC1 was plotted against PC2 using the plot function in R. To examine the effect of population structure, GWAS was performed without and with the first or first two PCs fitted into the model as fixed effects.
The population was genotyped for specific alleles of the plant height (Rht-B1 and Rht-D1), photoperiod (Ppd-A1, Ppd-B1 and Ppd-D1) and vernalization (Vrn-A1, Vrn-B1 and Vrn-D1) genes by Godoy et al. (Reference Godoy, Gizaw, Chao, Blake, Carter, Cuthbert, Dubcovsky, Hucl, Kephart, Pozniak and Prasad2018). The Kompetitive Allele-Specific Polymerase Chain Reaction (KASP) markers, KASP-wMAS000001 and KASP-wMAS000002, were used to distinguish the tall rht-B1a rht-D1a and semi-dwarf Rht-B1b and Rht-D1b alleles of Rht-1. Marker KASP-Ppd-A1prodel was used for Ppd-A1, KASP-wMAS000027 and KASP-TaPpdBJ003 for Ppd-B1, and KASP-wMAS000024 for Ppd-D1. Vernalization alleles were differentiated using markers KASP-wMAS000033 and KASP-wMAS000035 for Vrn-A1, KASP-VrnB1_I_D, KASP-wMAS2000037 and KASP-VrnB1_C for Vrn-B1, and KASP-wMAS000039 for Vrn-D1 (Ellis et al., Reference Ellis, Rebetzke, Azanza, Richards and Spielmeyer2005; Grogan et al., Reference Grogan, Brown-Guedira, Haley, McMaster, Reid, Smith and Byrne2016). Primer sequences were as reported by Grogan et al. (Reference Grogan, Brown-Guedira, Haley, McMaster, Reid, Smith and Byrne2016).
Statistical analysis
Multistep data normalization as well as comparisons among replications and experiments were performed in R (v3.6). Both the greenhouse and the field LMA experiments showed a Poisson distribution for α-amylase activity after cold treatment, where values were highly skewed towards low Au values. Based on a Box–Cox normality plot, a log10 transformation was chosen to obtain a more normal distribution and was used for all subsequent statistical analyses. In the GH2018 and GH2019 experiments, three treated and three untreated spikes were collected for each genotype. These were treated statistically as samples because they came from two plants in the same pot.
An ANOVA was performed using the lme4 package (Bates et al., Reference Bates, Mächler, Bolker and Walker2014). Based on the lambda from a Box–Cox power transformation implemented in the R MASS package in R3.6, a log10 transformation was used to normalize Au data (Sakia, Reference Sakia1992; Butler et al., Reference Butler, Tan and Cullis2009). A mixed linear model (MLM) was performed for the Field 2018 data in the lme4 package with genotype as a fixed effect and run by genotype interaction as a random effect and used to generate best linear unbiased estimators (BLUEs) for GWAS (Henderson, Reference Henderson1975; lme4 v1.1-21). BLUEs of both greenhouse and field experiments were used to examine correlations between independent experiments. Restricted Maximum Likelihood (REML) was used to fit an MLM for the combined GH2018 and GH2019 datasets such that genotype, experiment and run were examined as random effects on α-amylase activity in cold-treated samples (lme4 v1.1-21). The MLM for GH2018 and GH2019 was used to calculate best linear unbiased predictors (BLUPs) using the lmer command in lme4, and the resulting variances were used to calculate repeatability as an estimate of broad-sense heritability (H 2) using the following equation:
 $$H^2 = \displaystyle{{V_{{\rm genotype}}} \over {V_{{\rm genotype}} + ( {V_{{\rm residual}}/\# {\rm expt}} ) }}$$
where V genotype refers to the variability associated with genotype and V residual refers to the residual error in the model (supplementary Table S4). The #expt refers to the number of experiments. BLUPs of the GH2018 and GH2019 experiments and BLUEs of the field experiment were used to perform a GWAS.
Genome-wide association study
FarmCPU (Fixed and random model Circulating Probability Unification, v1.02) was used to identify significant marker-trait associations using default parameters except that the p.threshold was set to 0.05 instead of the default of 0.01 (Liu et al., Reference Liu, Huang, Fan, Buckler and Zhang2016). The p.threshold divided by the number of markers, in this case 19,192, determines the number of SNPs considered significant in the first iteration of marker-SNP associations. It is considered appropriate to increase the p.threshold to 0.05 or 0.1 to increase the likelihood of detecting QTL in smaller populations like the TCAP. LMA was mapped using BLUPs calculated from log10 transformed cold-treated plant Phadebas Au values. Untreated plant α-amylase enzyme activity was not used for mapping. The resulting BLUPs were used as dependent variables in the GWAS. Markers were identified as significantly associated with the trait after a 1% Bonferroni multiple test correction (P < 5.21 × 10⁻⁷; −log10(P) > 6.28). The inputs for Farm CPU included a phenotypic file, marker file, marker position file and PC file. Up to two PCs were used in the analysis. A Manhattan plot, a Quantile–Quantile (Q–Q) plot, an association table and an effect of covariate table, if any PCs were included in the analysis, were the outputs. More information, such as the chromosome number, genome position, P-value and MAF, were obtained from the association table. Only QTL with an MAF above 0.05 were reported.
Results
Population structure
LMA susceptibility was examined in an association mapping panel of 242 lines selected to represent ten North American hard spring wheat breeding programmes (Bajgain et al., Reference Bajgain, Rouse, Bulli, Bhavani, Gordon, Wanyera, Njau, Legesse, Anderson and Pumphrey2015). The panel was previously genotyped for 90,000 gene-based SNPs. A total of 251 lines were characterized for LMA phenotype. The population genotype structure was previously analysed by Bajgain et al. (Reference Bajgain, Rouse, Bulli, Bhavani, Gordon, Wanyera, Njau, Legesse, Anderson and Pumphrey2015) using PCs and hierarchical clustering (supplementary Fig. S1). Briefly, the first PC explained 8.9%, and the second 4.6% of the genotypic variation. There were two major clusters. The first mainly included Canadian and upper-midwestern U.S. varieties: Saskatchewan, Alberta, Manitoba, Minnesota, Montana and South Dakota. The second cluster mainly included CIMMYT and the western U.S. varieties: Idaho, Washington and California.
LMA phenotyping of a North American spring wheat panel
LMA-induction experiments were conducted three times in the greenhouse and once in the field. A single LMA field induction was performed where it was not possible to control temperature conditions prior to the LMA-inducing cold treatment to examine the feasibility of screening field-grown plants for LMA susceptibility in future breeding efforts. Both GH2017 and F2018 experiments were performed using detached tillers, whereas GH2018 and GH2019 experiments were performed using intact plants (Mrva and Mares, Reference Mrva and Mares2001a,Reference Mrva and Maresb). The cold treatment in GH2017 was performed at 26 dpa for all varieties. GH2017 did not show good LMA induction based on a comparison of untreated and cold-treated spikes (Fig. 1). This likely occurred because there were strong varietal differences in the length of time required after anthesis to reach the soft dough stage of grain maturation (Zadoks growth stage 85) (supplementary Fig. S2). Some varieties from the TCAP reached the soft dough stage and optimal LMA induction window much earlier than 26 dpa, for example, Glencross induced LMA between 18 and 21 dpa. LMA induction was improved in the GH2018, GH2019 and F2018 experiments by adjusting the timing of cold treatment based on the visual inspection of grains to identify the late soft dough stage (Liu, Reference Liu2019; Liu et al., Reference Liu, Tuttle, Garland-Campbell, Pumphrey and Steber2021; Fig. 1). The untreated samples displayed lower α-amylase activity (in Au) and lower variation than the treated samples. However, given that an FN of 300 s averaged 0.2 Au, it was clear that many untreated samples sometimes showed elevated α-amylase activity. The field experiment, F2018, showed successful LMA induction compared with the untreated control, indicating that LMA induction was possible under field-screening conditions.
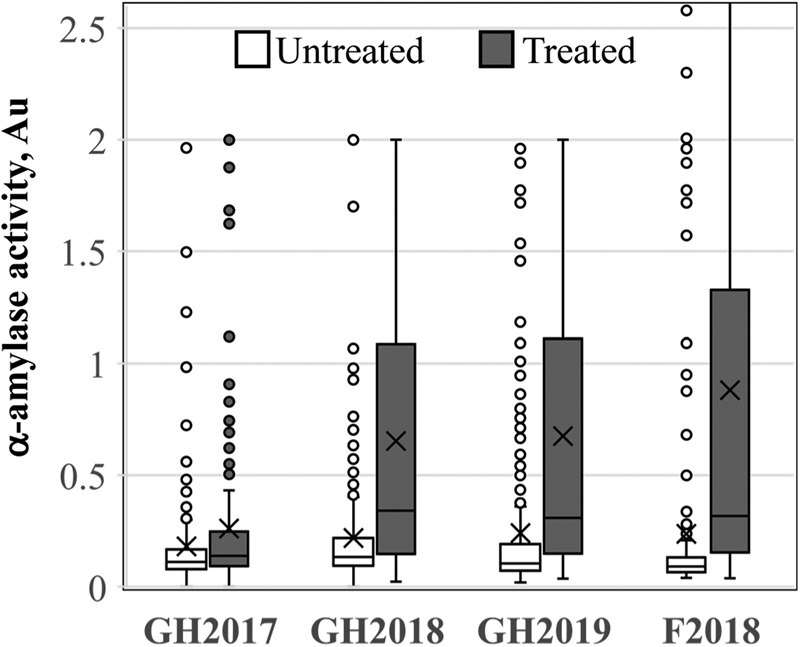
Fig. 1. LMA induction. The distribution of α-amylase activity in untreated (white) and cold-treated (grey) samples of the association panel. Three greenhouse (n = 251) and one field (F, n = 213) LMA experiments were performed in 2017, 2018 or 2019.
To assess the reproducibility of LMA induction in each greenhouse experiment, we examined correlations between the three samples from GH2018 and GH2019. LMA is a highly variable trait such that not all tillers on a plant and not all grains in a spike may induce the phenotype in a given experiment (reviewed in Mares and Mrva, Reference Mares and Mrva2008). There was a weak but significant correlation between samples in GH2017 (r 2 = 0.24, P = 1.2 × 10⁻¹¹). The correlations between samples in GH2018 and GH2019 were improved, ranging from an r 2 value of 0.26 to 0.43 (Table 1). Similar correlations were observed between untreated samples (supplementary Table S2). Thus, samples were moderately correlated. The two replicated plots in F2018 showed a very weak correlation for treated (r 2 = 0.048, P = 0.001) and untreated samples (r 2 = 0.130, P = 5.10 × 10⁻⁸).
Table 1. Correlations between treated replications (n = 251)

Limited correlation was observed between independent greenhouse and field LMA-induction experiments based on a comparison of BLUEs (Fig. 2; 0.04 < r 2 < 0.13). Stronger correlations were obtained when the data were restricted to the highest and lowest tails of α-amylase values in GH2018 and GH2019, suggesting that the more extreme LMA resistant and susceptible phenotypes were more reproducible (Table 2).
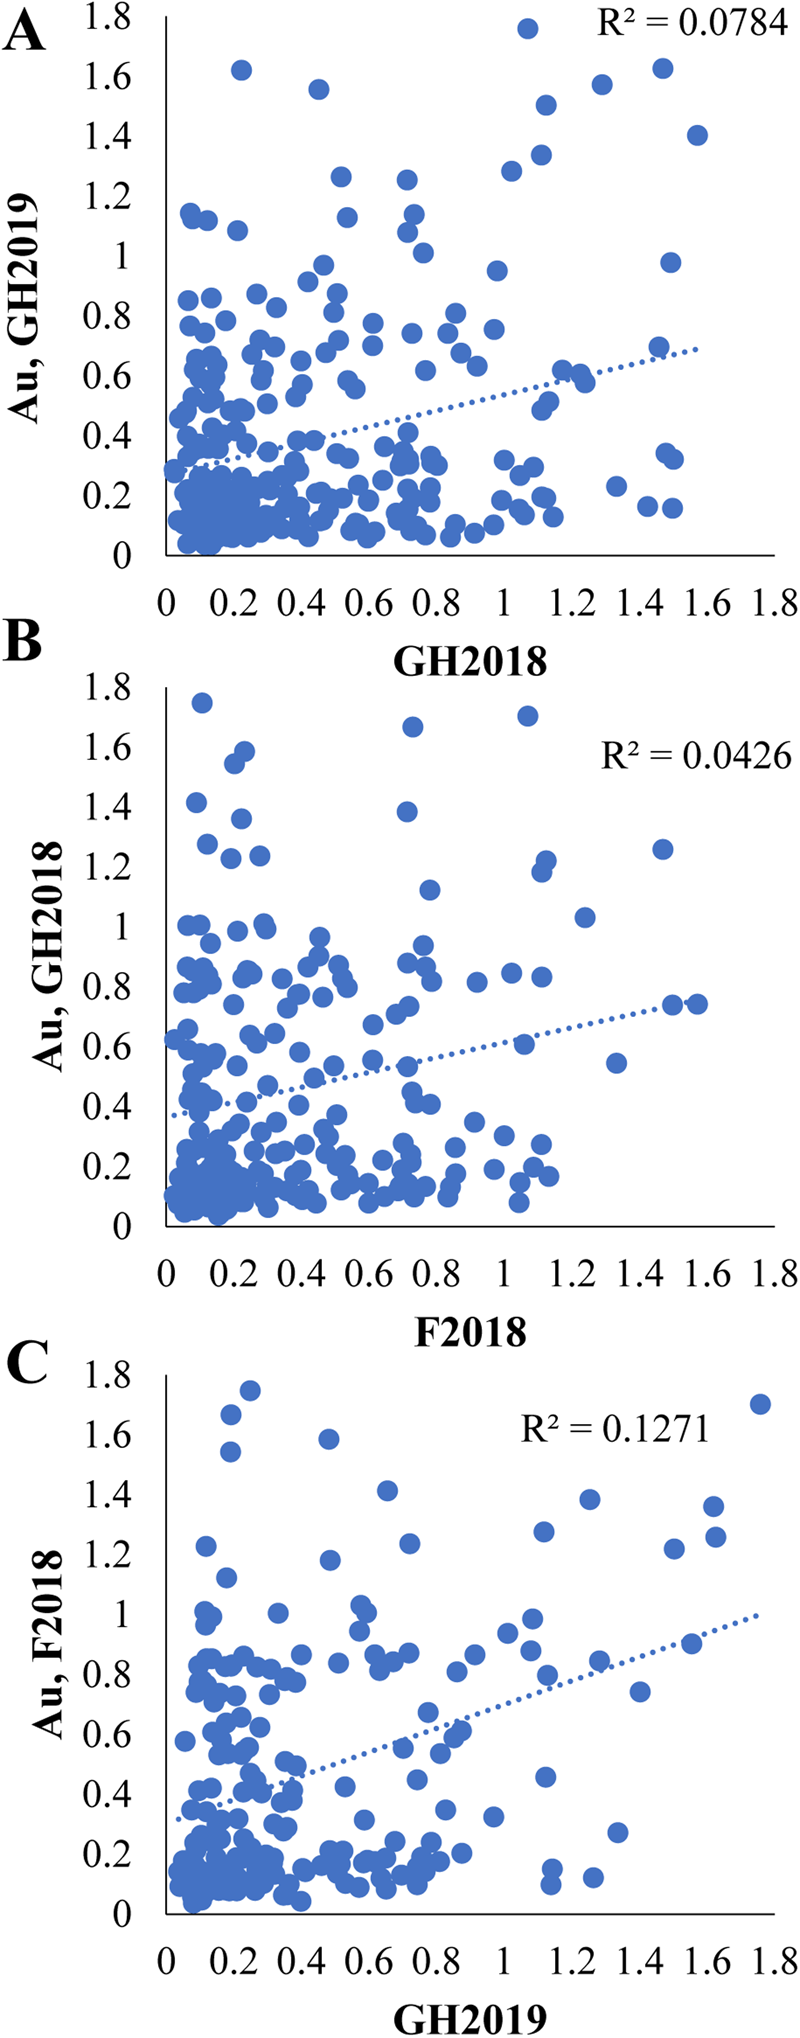
Fig. 2. Comparison of independent LMA-induction experiments. Linear regression and scatter plots comparing BLUEs of treated α-amylase activity (Au) in the three independent LMA-induction experiments: (A) GH2018 versus GH2019 (P < 7.2 × 10⁻⁶), (B) GH2018 versus F2018 (P = 0.0025), (C) GH2019 versus F2018 (P < 1.4 × 10⁻⁷).
Table 2. Correlations between the BLUEs of GH2018 and GH2019 when 100% of data or 15, 25 and 35% tails were considered

LMA screening of the association mapping panel allowed us to evaluate susceptibility in ten North American breeding programmes. Varieties were placed in categories based on the number of times that LMA was cold induced out of the eight replicates, three each from the two greenhouse experiments and two replicates from the field experiment F2018 (supplementary File 2). A line was considered to have LMA induction when a cold-treated sample had more than 0.2 Au in the α-amylase enzyme assay because standard samples with an FN of 300 s had an average of 0.15 Au (SD ±0.02) and because F2018 TCAP samples with an FN of 295–305 had an average of 0.205 Au (SD ±0.04, n = 12) in these experiments. Based on this, there were 67 LMA ‘Resistant’ lines that induced LMA in 25% or less of replicates, 62 LMA ‘Susceptible’ lines that induced LMA in more than 70% of replicates and 115 inconsistent ‘Moderate’ lines that induced LMA in 26–70% of replicates (Fig. 3a). When these data were examined by breeding programme, SDSU and CIMMYT had the smallest fraction of LMA resistant varieties, whereas the UMN and Ag-Canada in Alberta and Manitoba had the largest fraction of LMA resistant lines (Fig. 3b). The Au of all cold-treated samples are shown in supplementary Table S1.
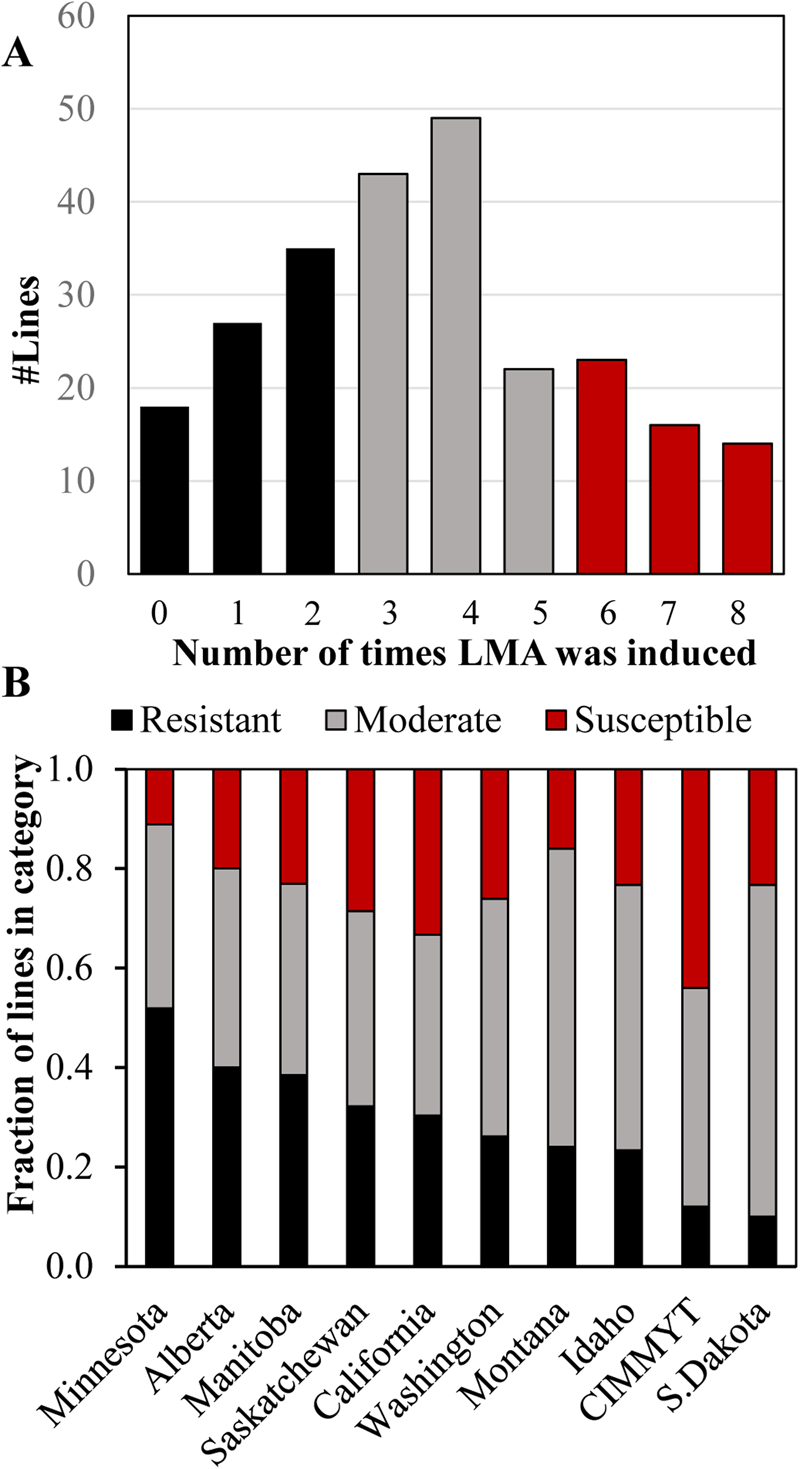
Fig. 3. The distribution of LMA phenotypic categories in the panel, representing ten North American breeding programmes. (A) The number of lines in which LMA was induced in 0 to 8 replications out of 8 over the GH2018, GH2019 and F2018 experiments. The resistant phenotypic category is in black, moderate is in grey and susceptible is in red. LMA induction was defined as an α-amylase activity Au ≥ 0.25. (B) The fraction of lines in each LMA phenotypic category separated by breeding programme based on 244 lines for which 6 to 8 replications were available. Categories were defined as LMA was induced in <25% of replicates in resistant lines, 26–70% in moderate lines and >70% in susceptible lines.
Sources of variation in LMA phenotype
Since there was a very limited correlation between replicates and experiments, the factors contributing to variation between experiments GH2018 and GH2019 were examined using REML with dpa included as a fixed effect (supplementary Table S3; Gilmour et al., Reference Gilmour, Thompson and Cullis1995). The dpa at which the LMA induction was performed did not significantly contribute to the variance in α-amylase activity (P = 0.48). While Genotype explained more of the variation than Run or Experiment, the residual error was quite high (supplementary Table S3). Since Run was nested within Expt, and dpa did not significantly contribute to the variation, Genotype and Expt were used as factors in the MLM used to calculate BLUPs for GWAS and repeatability (supplementary Table S4). The repeatability of 0.40 calculated as an estimate of broad-sense heritability (H 2) suggests that it should be possible to detect associations in a genome-wide association mapping study.
Much of the unexplained residual variation may be due to problems with variability in the timing or magnitude of LMA induction in different experiments or runs of those experiments. While cold treatment at Zadock stage 85 based on the physical inspection of the plants and grains improved LMA induction (Fig. 1), it clearly did not result in consistency since some varieties induced LMA in one experiment but not the other (Fig. 2). It is possible that the timing of the cold treatment was better in one experiment than the other. Indeed, the timings of LMA induction in the GH2018 and GH2019 experiments were not significantly correlated (P = 0.42; supplementary Fig. S3A). The GH2019 experiment had a narrower range of LMA treatment dates than GH2018 because GH2019 was conducted in two runs that were only 1 month apart, whereas GH2018 was conducted in three runs spanning 11 months (supplementary Fig. S3B). It is possible that seasonal variation in the glasshouse prior to transfer to 25°C day/18°C night at anthesis impacted subsequent grain development leading to differences in development rates between runs performed at different times. Alternatively, the wide range of variation for flowering time in this population may have led to a wide range of variation in the timing of LMA susceptibility (Godoy et al., Reference Godoy, Gizaw, Chao, Blake, Carter, Cuthbert, Dubcovsky, Hucl, Kephart, Pozniak and Prasad2018).
Preliminary GWAS of LMA in North American wheat
A preliminary GWAS was performed to identify potential QTLs associated with LMA resistance and susceptibility in the panel of North American hard spring wheat in FarmCPU (Liu et al., Reference Liu, Huang, Fan, Buckler and Zhang2016). FarmCPU was designed to analyse large datasets and to reduce false positive and false negative results by adapting kinship and population structure as covariates in an MLM. The number of PCs used for mapping were selected based on Q–Q plots (supplementary Fig. S4). BLUPs from GH2018 and GH2019 were mapped using two PCs, and BLUEs from F2018 were mapped using zero PC. A single significant QTL, QLMA.wsu.3B, was detected on chromosome 3B using BLUPs derived from GH2018 and GH2019 for the entire genotyped population (n = 242) (Table 3; supplementary Fig. S5A). Since there was a greater correlation between the tails of GH2018 and GH2019 than the entire population (Table 2), a GWAS was performed using BLUPs for the top and the bottom 25% of the treated population (n = 120). Given the smaller population size, the Bonferroni p.threshold was increased from α = 0.05/number of markers (19,192) to α = 0.1/number of markers, resulting in the detection of loci on chromosomes 1A and 6B (Table 3; supplementary Fig. S5B). Three LMA-associated loci were detected on chromosomes 3A, 7B and 7D using BLUEs of α-amylase enzyme activity in Au from F2018 (n = 206) (Table 3; supplementary Fig. S5C). A single significant locus was detected on chromosome 7A using the average FN of LMA-treated grain from F2018 (Table 3; supplementary Fig. S5D). FN failed to detect the QTL identified based on enzyme activity in F2018, although FN below 300 s appeared to depend on α-amylase enzyme activity for this hard-red spring panel (supplementary Fig. S6). None of the loci detected were present in more than one dataset.
Table 3. Putative significant QTL from GWAS for LMA

GH, greenhouse.
a For enzyme activity, a positive effect value indicates that the QTL is associated with higher α-amylase levels and a more LMA-susceptible phenotype. For FN, a positive effect value indicates that the QTL is associated with higher FN and less LMA susceptibility.
b The allele associated with lower LMA susceptibility is in bold.
Associations to known genes Rht, Vrn and Ppd
The Rht-1 genotype of the panel was used to examine whether the tall rht-B1a rht-D1a genotype is associated with higher LMA susceptibility compared with the semi-dwarf alleles, Rht-B1b or Rht-D1b, because previous work showed an association between higher LMA susceptibility and the recessive tall alleles at the Rht-1 loci, rht-B1a rht-D1a (supplementary File 2; Mrva et al., Reference Mrva, Cheong, Yu, Law and Mares2009; Farrell et al., Reference Farrell, Kettlewell, Simmonds, Flintham, Snape, Werner and Jack2013; Derkx and Mares, Reference Derkx and Mares2020). This was examined using the one-way ANOVA of BLUPs from the cold-treated and untreated GH2018 and GH2019 experiments. There was a weak association between the taller rht-B1a rht-D1a genotype (vs lines carrying the semi-dwarf Rht-B1b and/or Rht-D1b alleles) and LMA susceptibility in treated samples (P = 0.053), and a stronger association between the tall rht-B1a rht-D1a genotype and LMA susceptibility in untreated samples (P < 0.0001). This may be because the rht-B1a rht-D1a genotype is associated with an LMA-constitutive phenotype, where cold treatment is not needed to express the LMA phenotype (reviewed in Mares and Mrva, Reference Mares and Mrva2014). Next, we examined individual genotypes to determine whether the LMA-constitutive genotype was strictly associated with the rht-B1a rht-D1a genotype (supplementary Table S1). While there were seven rht-B1a rht-D1a lines with a constitutive LMA phenotype, there was one Rht-D1b (‘UC1110’) and one Rht-B1b (UC1599) line with a constitutive LMA phenotype. Thus, it is possible to observe an LMA-constitutive phenotype in a semi-dwarf variety. Conversely, some rht-B1a rht-D1a genotypes expressed LMA only with cold induction, such as ‘Hollis’, ‘Briggs’, ‘SD3997’, ‘Rescue’ and ‘Thatcher’. Thus, not all rht-B1a rht-D1a genotypes express LMA constitutively.
Since the developmental window for LMA induction varied between genotypes, we hypothesized that genes governing the response of flower development to the environment might influence LMA susceptibility. Thus, we examined whether LMA phenotype was associated with Vrn-A1 vernalization and Ppd-1 photoperiod sensitivity alleles. The population showed variation for the Ppd-D1 allele, but not for Ppd-A1 or Ppd-B1. The photoperiod insensitive versus sensitive allele at Ppd-D1 did not significantly affect α-amylase expression in treated (Ppd-D1a vs Ppd-D1b, P = 0.47) or untreated (P = 0.17) samples. Moreover, variation for Vrn-A1 alleles was not significantly associated with LMA phenotype in treated (P = 0.92) or untreated samples (P = 0.65).
Discussion
Breeding for LMA resistance is important because farmers receive substantial discounts for low FNs due to LMA (reviewed by Mares and Mrva, Reference Mares and Mrva2014). Australian breeders are required to maintain a high level of LMA resistance in newly released varieties. However, little was known about the degree of LMA resistance in U.S. wheat. This study revealed a substantial degree of LMA susceptibility in a panel of 251 elite hard spring varieties, representing ten major North American wheat breeding programmes (Fig. 3). In fact, only 27% of varieties ranked as resistant, whereas 48% showed moderate and 25% strong susceptibility. This distribution suggested that there has been little selection for LMA resistance in North America. The fact that over 50% of lines from the UMN have clear resistance suggests that improved LMA resistance is possible. We speculate that regions with frequent preharvest sprouting may generally select for higher FNs resulting in increased LMA as well as preharvest sprouting tolerance. CIMMYT has a low fraction of LMA resistant and a high fraction of LMA-susceptible germplasm. This may be because Mexico is a dry growing environment and because CIMMYT has greater interest in breeding for subsistence farming than for end-use quality. Future research could use the resistant and susceptible varieties identified in this study in making breeding decisions or to identify parents for biparental mapping populations.
The FN method does not differentiate between LMA and preharvest sprouting as causes of low FNs due to high grain α-amylase activity. Recent evidence suggests that low FN due to preharvest sprouting has a more profound effect on end-use quality than LMA (Ral et al., Reference Ral, Whan, Larroque, Leyne, Pritchard, Dielen, Howitt, Morell and Newberry2016; Kiszonas et al., Reference Kiszonas, Engle, Pierantoni and Morris2018; Newberry et al., Reference Newberry, Zwart, Whan, Mieog, Sun, Leyne, Pritchard, Daneri-Castro, Ibrahim, Diepeveen, Howitt and Ral2018). However, until the wheat industry adopts an approach that can differentiate between the two causes of low FN, LMA will continue to be an important breeding objective to avoid financial loss. In fact, farmers in Washington state received an estimated $140 million in discounts in 2016, partly due to problems with LMA-induced low FN, and have continued to receive discounts for LMA-affected grain (Steber et al., Reference Steber, Pumphrey and Carter2018; D. Herron, personal communication).
One difficulty in breeding for LMA tolerance is the high variability of the phenotype (Fig. 2). It is difficult to achieve early generation selection for a trait if a high degree of replication is needed to confidently determine the phenotype. Previous studies have tried to develop approaches to overcome the inconsistency of the LMA phenotype. An enzyme-linked immunosorbent assay (ELISA) assay specific for high pI α-amylase was developed in order to differentiate between the high pI α-amylase induced during LMA and preharvest sprouting and low pI α-amylases expressed during development (Verity et al., Reference Verity, Hac and Skerritt1999; Barrero et al., Reference Barrero, Mrva, Talbot, White, Taylor, Gubler and Mares2013; Mieog et al., Reference Mieog, Janeček and Ral2017; Derkx and Mares, Reference Derkx and Mares2020). It may be the case that this improves LMA phenotyping, given that Emebiri et al. (Reference Emebiri, Oliver, Mrva and Mares2010) calculated a heritability of 86.6% in their association mapping study of 91 lines compared with the heritability of 40% in the current study of 242 lines. Unfortunately, this ELISA assay is unavailable to researchers outside of Australia. The highly sensitive ELISA assays also allowed researchers to use a categorical system to rank varieties for LMA phenotype by determining the number of single grains out of seven that show increased α-amylase levels (Mrva and Mares, Reference Mrva and Mares2001a). Improved statistical methods for dealing with highly variable LMA phenotype data have also been developed (Butler et al., Reference Butler, Tan and Cullis2009; Tan et al., Reference Tan, Verbyla, Cullis, Martin, Milgate and Oliver2010). The most likely explanation for the variability in LMA phenotype in the current study was that varieties in the panel showed considerable variation in flowering time and in the timing of the LMA-induction window during grain maturation (supplementary Figs. S2 and S3). Future efforts to map LMA should make the use of either biparental mapping populations or association mapping panels containing varieties with very similar phenology, including specific vernalization and photoperiod loci. When practical, it would be beneficial to grow the lines for greenhouse LMA induction at the same time to avoid seasonal differences causing variation in the rate of grain development (supplementary Fig. S3).
Given the low correlation between independent LMA experiments in this study, the genome-wide association mapping study must be considered an exploratory approach (Fig. 2). Future work will need to validate the effectiveness of the markers in selecting LMA tolerance within breeding programmes or in biparental mapping populations that have been characterized for LMA phenotype. However, the GWAS approach applied here appears to be valid since at least two of the QTL detected were previously reported in mapping studies performed using CIMMYT and Australian germplasm.
Several previous studies mapped loci controlling the LMA phenotype (Mrva and Mares, Reference Mrva and Mares2001a; Tan et al., Reference Tan, Mrva, Mares, Pallotta and Sharp2004, Reference Tan, Verbyla, Cullis, Martin, Milgate and Oliver2010; McNeil et al., Reference McNeil, Diepeveen, Wilson, Barclay, McLean, Chalhoub and Appels2009; Emebiri et al., Reference Emebiri, Oliver, Mrva and Mares2010). Significant loci were detected on chromosomes 6B and 7B in an association study of 91 CIMMYT lines (Emebiri et al., Reference Emebiri, Oliver, Mrva and Mares2010), and significant QTLs were mapped on chromosome 3B and 7B using the Australian Cranbrook/Halberd doubled haploid population of 158 lines (Mrva and Mares, Reference Mrva and Mares2001a,Reference Mrva and Maresb; McNeil et al., Reference McNeil, Diepeveen, Wilson, Barclay, McLean, Chalhoub and Appels2009). The positions of QTL identified in the current study were compared with the genetic map positions of QTL from previous studies (Maccaferri et al., Reference Maccaferri, Ricci, Salvi, Milner, Noli, Martelli, Casadio, Akhunov, Scalabrin, Vendramin and Ammar2015; Martinez et al., Reference Martinez, Godoy, Huang, Zhang, Carter, Garland Campbell and Steber2018). QLMA-wsu.1A, QLMA-wsu.7D and QLMA-wsu.7A appear to be unique since there are no previously reported LMA QTLs on these chromosomes (Mrva and Mares, Reference Mrva and Mares2001a; Tan et al., Reference Tan, Mrva, Mares, Pallotta and Sharp2004, Reference Tan, Verbyla, Cullis, Martin, Milgate and Oliver2010; McNeil et al., Reference McNeil, Diepeveen, Wilson, Barclay, McLean, Chalhoub and Appels2009; Emebiri et al., Reference Emebiri, Oliver, Mrva and Mares2010). The previously identified 3B LMA QTL was quite large, associating with different markers in different studies, sometimes on the long and sometimes on the short arm of chromosome 3B (Mrva and Mares, Reference Mrva and Mares2001a; McNeil et al., Reference McNeil, Diepeveen, Wilson, Barclay, McLean, Chalhoub and Appels2009; Tan et al., Reference Tan, Verbyla, Cullis, Martin, Milgate and Oliver2010). Unfortunately, the sequence position of only one marker associated with this LMA QTL is known, gwm644 (Wang et al., Reference Wang, Wong, Forrest, Allen, Chao, Huang, Maccaferri, Salvi, Milner, Cattivelli and Mastrangelo2014). The QLMA.wsu.3B locus was 47.72 cM away from the QTL at gwm644, suggesting that it may be a unique QTL. However, we cannot rule out the possibility that QLMA.wsu.3B is part of the large previously identified QTL or cluster of QTLs in this region. QLMA.wsu.7B, on the other hand, is located between flanking markers delineating the large LMA QTL detected by Emebiri et al. (Reference Emebiri, Oliver, Mrva and Mares2010) on chromosome 7BL, 18.4 cM from wPt-3723 and 15.8 cM from wPt-0884. QLMA.wsu.6B is located 0.78 cM away from the significant loci, wPt-5176 and wPt-1541, detected by Emebiri et al. (Reference Emebiri, Oliver, Mrva and Mares2010). The co-localization of QTL from the current study with LMA loci previously mapped in Australian and CIMMYT germplasm suggests that LMA in North American wheat shares genetic mechanisms with previously reported examples of LMA. Emebiri et al. (Reference Emebiri, Oliver, Mrva and Mares2010) is an association mapping study of CIMMYT synthetic lines, and the current association panel included 25 lines from the CIMMYT breeding programme as well as lines with CIMMYT germplasm in the pedigree. Thus, it is unsurprising that similar loci were identified.
Given that FN was developed as an autolytic assay for α-amylase enzyme activity, it was interesting that different QTLs were detected using FN and α-amylase enzyme activity data from the same F2018 samples (Table 3; supplementary Fig. S5; Perten, Reference Perten1964). Although FN is largely a function of α-amylase activity, it is not a perfect relationship because FN is also dependent upon grain protein levels and upon starch characteristics (supplementary Fig. S6; Graybosch et al., Reference Graybosch, Gang and Shelton2000; Ross et al., Reference Ross, Flowers, Zemetra and Kongraksawech2012; Kiszonas et al., Reference Kiszonas, Engle, Pierantoni and Morris2018; Derkx and Mares, Reference Derkx and Mares2020). Given that LMA is defined as the induction of α-amylase by low or high temperature during grain filling, it is likely that enzyme activity is the better metric for measuring LMA susceptibility. However, FN is favoured in the wheat industry because it is considered to better reflect how the flour will behave during baking.
There were differences in the QTLs detected using the intact plant versus detached-tiller methods. QLMA.wsu.7B was detected in the field 2018 experiment but not in GH2018 and GH2019. The F2018 experiment used the detached-tiller LMA testing method, whereas GH2018 and GH2019 made the use of intact plants. The LMA QTL on chromosome 7BL has been mapped in five studies including the current study, using four independent mapping populations (Table 3; Mrva and Mares, Reference Mrva and Mares2001a; Tan et al., Reference Tan, Mrva, Mares, Pallotta and Sharp2004; McNeil et al., Reference McNeil, Diepeveen, Wilson, Barclay, McLean, Chalhoub and Appels2009; Emebiri et al., Reference Emebiri, Oliver, Mrva and Mares2010). All five of these mapping studies made use of the detached-tiller LMA testing method. Future work will need to examine whether some LMA QTLs are more likely to be detected with the detached-tiller than intact plant screening methods. The F2018 experiment also had a more distinct separation between absorbance values from the cold-treated versus untreated controls. This may have been the result of warmer field growth conditions compared with the 25°C day/18°C night used in the greenhouse method. It is interesting, however, that LMA-susceptible varieties sometimes have elevated α-amylase activity without cold treatment (Fig. 1), suggesting that cold treatment enhances a general tendency towards elevated grain α-amylase activity. LMA can also be induced by a high temperature treatment during late grain maturation (Farrell and Kettlewell, Reference Farrell and Kettlewell2008; Barrero et al., Reference Barrero, Porfirio, Hughes, Chen, Dillon, Gubler and Ral2020). Differences in sensitivity to high and low temperature enhancement of LMA may also provide clues as to whether LMA is governed by multiple genetic mechanisms (Liu et al., Reference Liu, Tuttle, Garland-Campbell, Pumphrey and Steber2021).
The examination of LMA phenotypes in lines differing for Rht-1 genotype raised the possibility that there are Rht-dependent and Rht-independent mechanisms governing LMA. Most modern wheat varieties carry one of the two semi-dominant semi-dwarfing alleles, Rht-B1b or Rht-D1b (reviewed by Phillips, Reference Phillips2016). These alleles are GA-insensitive mutations in the wheat DELLA gene, resulting in decreased plant height through reduced GA hormone signalling. The Rht-B1b and Rht-D1b semi-dwarfism provides increased resistance to lodging due to thicker and shorter stems, as well as increased harvest index due to partitioning of a larger proportion of photosynthetic energy to grain production versus to plant biomass. Previous work showed that having Rht-B1b or Rht-D1b alleles also provides improved LMA tolerance (Mrva et al., Reference Mrva, Cheong, Yu, Law and Mares2009; Farrell et al., Reference Farrell, Kettlewell, Simmonds, Flintham, Snape, Werner and Jack2013; Derkx and Mares, Reference Derkx and Mares2020). Moreover, individuals with the tall rht-B1a rht-D1a genotype sometimes exhibit elevated α-amylase without cold temperature treatment, an LMA-constitutive phenotype (Barrero et al., Reference Barrero, Mrva, Talbot, White, Taylor, Gubler and Mares2013). Consistent with this, the rht-B1a rht-D1a genotype was significantly associated with elevated α-amylase in both treated and untreated samples. This was not entirely expected since breeding programmes might have selected against the LMA-constitutive phenotype given that FNs above 300 s are an important receival standard. Interestingly, the LMA-constitutive phenotype was not entirely dependent on the rht-B1a rht-D1a genotype. It was possible to observe an LMA-constitutive phenotype in both tall rht-B1a rht-D1a and semi-dwarf Rht-B1b or Rht-D1b lines. The existence of both Rht-dependent and Rht-independent mechanisms for controlling the LMA-constitutive phenotype suggests that LMA can result from multiple genetic mechanisms. Barrero et al. (Reference Barrero, Mrva, Talbot, White, Taylor, Gubler and Mares2013) found that the LMA-constitutive phenotype was associated with elevated levels of GA hormone precursors in de-embryonated rht-B1a rht-D1a grains. This together with the DELLA-dependence of the phenotype suggests that GA signalling is involved in LMA.
Future work should examine whether the Rht-dependent and Rht-independent LMA result from different genetic mechanisms. This could be achieved through the QTL analysis of two biparental mapping populations segregating for the two different forms of LMA-constitutive phenotype. Mapping an LMA-constitutive phenotype is one way to overcome the problem with the high variability in LMA induction. Moreover, screening for LMA-constitutive phenotypes can be performed in early generation breeding material using simple α-amylase enzyme assays. This would remove this most extreme form of LMA phenotype from breeding programmes and could provide insights into possible LMA susceptibility in sibling breeding lines.
Supplementary material
To view supplementary material for this article, please visit: https://doi.org/10.1017/S0960258521000064.
Acknowledgements
The authors thank Wycliffe Nyongesa, Tracy Harris and Sheri Rynearson for expert technical support. Thanks are due to members of the Pumphrey and Garland Campbell lab field crews for assistance with sample collection. We are grateful to members of the Steber, Pumphrey and Garland Campbell labs for insightful suggestions on the research and the manuscript. This research was funded by the Washington Grain Commission, a Washington State University Emerging Research Issues in Agriculture grant and the USDA-ARS.
Author contributions
C.M.S., C.L., M.O.P. and R.S.P. designed the experiments. R.S.P. performed the LMA time course and the GH2017 LMA experiment; R.S.P. and C.L. performed the GH2018 and GH2019 LMA experiments and C.L. performed the Field 2018 LMA experiment. K.G.C., S.R.R. and M.O.P. provided advice on statistical analyses. Statistical analyses were performed by C.L. and S.R.R. The manuscript was written by C.L. and C.M.S.
Conflicts of interest
None declared.


 Open access