


1. Introduction
Dictionary illustrations are ostensive definitions whereby a word is explained by pointing to an object (Landau, Reference Landau2001: 168). They help clarify meaning, disambiguate between senses, group or distinguish between words from one semantic field, and convey information on culture-specific words that might be difficult to explicate verbally (Gangla-Birir, Reference Gangla-Birir2015: 47; Heuberger, Reference Heuberger2000: 36). Their basic role, however, is to elucidate the verbal definition (Svensén, Reference Svensén2009). Recent eye-tracking studies show that illustrations do not marginalize the traditional definition. Rather, they complement it, as both the definition and illustrations are looked at (Kemmer, Reference Kemmer and Müller-Spitzer2014; Lew, Kaźmierczak, Tomczak & Leszkowicz, Reference Lew, Kaźmierczak, Tomczak and Leszkowicz2018). Yet, being more explicit than text, illustrations are believed to enhance information retrieval (Gangla-Birir, Reference Gangla-Birir2015: 40). They are also said to have an aesthetic value and make the dictionary more appealing (Heuberger, Reference Heuberger2000: 36; Klosa, Reference Klosa and Durkin2015: 516). This is not a negligible function, considering the proliferation of (and competition between) dictionaries on the internet. No wonder, then, that illustrations, which are unfortunately absent from many online dictionaries, are considered “a welcome addition” (Lew & Szarowska, Reference Lew and Szarowska2017: 157).
A variety of illustration categories have been distinguished (Hupka, Reference Hupka1989, Reference Hupka and Hartmann2003; Ilson, Reference Ilson1987; Stein, Reference Stein1991; Svensén, Reference Svensén2009). Among them are single pictures and line drawings, dealt with below. Showing precisely one object, they are most common in dictionaries (Klosa, Reference Klosa and Durkin2015: 519), where their function is to support comprehension (Lew et al., Reference Lew, Kaźmierczak, Tomczak and Leszkowicz2018: 54). Obviously, not all lexical items lend themselves to illustration. Those picturable ones include concrete nouns and (less often) verbs, adjectives, and prepositions (Klosa, Reference Klosa and Durkin2015; Stein, Reference Stein1991). Abstract nouns are typically outside this range.
Lexicographers need to decide not only what to illustrate, but also how to do it. Digital cameras give photographs a big advantage over drawings because of speed, cost, and availability. Pictures seem superior to drawings also because they are more realistic (Heuberger, Reference Heuberger2000: 36). Yet, they tend to get out of date quickly and may pose problems in the light of the prototype theory, because “realistic is not the same thing as typical” (Svensén, Reference Svensén2009: 301). Nesi (Reference Nesi and Tickoo1989: 131) argues that “dictionary illustrations usually need not, and often should not, be very realistic.” In her view, a drawing that represents a model of reality may be more informative than a faithful representation. For example, a cross-section of an eye, when drawn, makes all the components more easily identifiable than a picture. Besides, pictures include visual noise, or non-criterial, peripheral features irrelevant to the particular context, some of which may be erroneously taken to be (proto)typical for the concept being defined (Zgusta, Reference Zgusta1971: 56). This limitation does not apply to more timeless hand drawings, where virtually each line is motivated, irrelevant details are removed, and the background is retained only if it has informative value (Heuberger, Reference Heuberger2000: 36). They can also be manipulated to remove non-essential details competing for the learner’s attention or accentuate focal elements, like part of a whole without which the part cannot be illustrated (e.g. a fin of a fish; Lew, Reference Lew2010: 300). Yet current software solutions make it possible to manipulate photographs and, for example, blur or remove the background or add arrows pointing to the designate.
Color is another issue related to dictionary illustrations. Although it adds to their realism and makes them more appealing, it can encourage sweeping generalizations (e.g. “all roses are red”; Langridge, Reference Langridge, de Beaugrande, Grosman and Seidlhofer1998: 73). Color illustrations are readily used in e-dictionaries, but it is not known whether they are more beneficial than greyscale ones. This is a valid question; e-dictionaries are often consulted on devices with color displays, but those accessed on e-book readers and handheld portables are usually in greyscale. Heuberger (Reference Heuberger2000: 50) thus rightly notes that greyscale pictures are by no means anachronistic. Besides, “there is no evidence that full-colour illustrations are in fact more effective in dictionaries than the more traditional simple iconic line drawings” (Lew, Reference Lew2010: 299). Even though line drawings are claimed to have the same informative value as illustrations in color (Heuberger, Reference Heuberger2000: 43), no empirical studies on dictionary use have verified this assumption yet.
In fact, there is little research on the actual usefulness of illustrations in dictionaries. The existing empirical evidence suggests that they enhance meaning comprehension and retention. Nesi (Reference Nesi1998) found that learners of English who had problems with understanding meaning of concrete nouns on the basis of dictionary definitions and examples had little problem with identifying the same objects shown in pictures. This implies that illustrations should be added to dictionary entries to improve comprehension. Gumkowska (Reference Gumkowska2008) investigated meaning retention on the basis of bilingual entries with and without illustrations. Her findings indicate that illustrations significantly enhance vocabulary acquisition.
Lew et al. (Reference Lew, Kaźmierczak, Tomczak and Leszkowicz2018: 75) suggest that “it might be instructive to introduce entries with no pictorial illustration so as to assess how the presence of illustration affects the consultation time.” Results are difficult to predict. On the one hand, illustrations are viewed as “a scaffolding tool to help students quickly associate unfamiliar words with concepts” (Baker, Reference Baker2015: 3). On the other hand, pictures do not provide support automatically. Without due engagement, cognitive schemata of everyday knowledge, necessary to understand illustrations, may not be activated (Schnotz, Reference Schnotz2002: 116). It has been established so far that when entries feature illustrations, 40% of consultation time is spent on illustration analysis (Lew et al., Reference Lew, Kaźmierczak, Tomczak and Leszkowicz2018). However, no comparison was made with illustration-free entry lookup time.
The positive role of dictionary illustrations on meaning retention (Gumkowska, Reference Gumkowska2008) can be explained by the dual coding theory (Paivio, Reference Paivio1990). The theory assumes that cognition engages two functionally independent but interconnected cognitive subsystems (codes or stores): verbal and visual. Linguistic stimuli are processed in the former, whereas nonverbal objects and events are processed in the latter. Their functional independence means that they can be activated separately or jointly, depending on the task (Paivio, Reference Paivio2010: 208). They also have an additive effect on retention. Paivio (Reference Paivio2006: 4) explains that humans tend to covertly name objects in pictures, which means that pictures create two memory traces: visual and verbal. In other words, two separate but interconnected memory traces are laid down, one in each store. People can also evoke mental images of concrete words, and thus create a dual verbal-nonverbal memory trace, too, but this is less common. The interconnection between the two subsystems (visual and verbal) has a positive influence on recall; when both are activated at the same time, an additive effect is produced, which results in better memory. Yet, the nonverbal code has a greater mnemonic strength, because it contributes more to the additive memory benefit than the verbal one (Paivio & Lambert, Reference Paivio and Lambert1981).
The (limited) capacities of the verbal and visual systems of working memory are connected with the cognitive load that a learner experiences (Sweller, Reference Sweller1994). This has important consequences for the design of instructional materials. To facilitate knowledge acquisition, they should not place any unnecessary load on working memory. This is a basic assumption of the cognitive load hypothesis; learning is optimized when the unnecessary cognitive load on working memory is minimized (Sweller, Reference Sweller1994). This load, referred to as extraneous cognitive load, is related to the way in which information is presented. Ineffective and unnecessarily complex presentation reduces germane load, or the capacity of working memory for learning. Sweller (Reference Sweller2010) defines germane cognitive load as working memory resources that are necessary to deal with intrinsic cognitive load in order to learn. Intrinsic cognitive load, in turn, is inherent in the natural complexity of the information to be learnt and cannot be modified. Ideally, extraneous load should be reduced and germane load increased, so that more working memory resources can be invested in processing unalterable intrinsic load rather than wasted on dealing with an inappropriate design (Sweller, Reference Sweller and Mayer2005: 27–28).
The question thus arises as to how dictionary illustrations should be best designed to reduce extraneous cognitive load and enhance learning. As previously noted, it is by no means certain that color pictures contribute more to decoding and retention than greyscale ones or line drawings. Too many colors in graphics may impose a significant load on working memory and cancel any beneficial effect of color-coding (Kalyuga, Chandler & Sweller, Reference Kalyuga, Chandler and Sweller1999: 366). Keller and Grimm (Reference Keller, Grimm, Tergan and Keller2005: 180) found that color-coded visualizations support knowledge acquisition only marginally better than monochromatic ones. Langridge (Reference Langridge, de Beaugrande, Grosman and Seidlhofer1998: 73) points out that it is not so much color as form that is “the more decisive carrier of information in both colour and black-and-white illustrations,” and concludes that color cannot have a prominent role in comprehension and memory. Yet, color remains the basic, automatically processed element of visual perception and an important memory retrieval clue (Hanna & Remington, Reference Hanna and Remington1996), which can be used to manipulate learning (Brünken, Plass & Leutner, Reference Brünken, Plass and Leutner2003).
The discussion above shows that it is worthwhile to see whether dictionary pictures in color, greyscale, or line drawings are more useful for reception and retention. It is also advisable to compare entries with and without illustrations, as it is not known if illustrations affect consultation time.
In related research into computer-based multimodal second language (L2) vocabulary learning, especially relevant to the current paper are experiments involving verbal-visual conditions. Chun and Plass (Reference Chun and Plass1996) observed that annotations showing text and pictures stimulated lexical recall much more than text alone or text combined with video. Al-Seghayer (Reference Al-Seghayer2001), by contrast, established that a combination of text and video helped more in vocabulary learning than a combination of text and picture, and both combinations were more helpful than text-only definitions. Plass, Chun, Mayer and Leutner (Reference Plass, Chun, Mayer and Leutner1998, Reference Plass, Chun, Mayer and Leutner2003), in turn, concluded that vocabulary acquisition was best when both visual (pictorial or video) and verbal annotations were consulted, and moderate when only one mode was selected. The advantage of text-plus-picture glosses over textual ones in vocabulary learning was also attested to by Yeh and Wang (Reference Yeh and Wang2004) or Yoshii (Reference Yoshii2006). Yet, other studies provided no evidence to support textual-pictorial glosses over text-only (Acha, Reference Acha2009) or picture-only ones (Warren, Boers, Grimshaw & Siyanova-Chanturia, Reference Warren, Boers, Grimshaw and Siyanova-Chanturia2018).
Interestingly, as regards long-term vocabulary learning effects, Yoshii and Flaitz (Reference Yoshii and Flaitz2003) found that dually coded annotations (text and pictures) stimulated much better immediate vocabulary retention than singly coded ones (either text or picture), but the advantage was not observed in delayed retention. Similarly, in the experiment by Jones and Plass (Reference Jones and Plass2002) most vocabulary was learnt when both verbal and pictorial annotations were available. Yet, pictures proved more valuable for long-term retention. The results were not confirmed in Jones’s (Reference Jones2004) study, where dually coded (written and pictorial) and singly coded (written or pictorial) annotations yielded comparable learning effects in the long run. Akbulut (Reference Akbulut2007), in turn, found that definitions combined with visuals (pictures or videos) produced much better vocabulary learning effects (both immediate and delayed) than definitions alone.
Overall, many of the above-mentioned studies indicate that verbal-visual clues tend to have an advantage over singly-coded ones in vocabulary learning, although the long-term benefits of dual coding are less clear. Besides, different formats of static illustrations were not dissected.
It is worthwhile to indicate the relevance of the present research to current learning and teaching practices. First, the pedagogy of multiliteracies needs to be mentioned, “in which language and other modes of meaning are dynamic representational resources, constantly being remade by their users” (The New London Group, 1996: 64). Obviously, multiple verbal and non-verbal (auditory, visual, gestural, and spatial) modes of meaning-making should be closely integrated to help learners construe meaning. Online dictionaries have a great potential to accommodate multimodal meaning representations (speech, sound, written text, images, or videos). To achieve coherence between verbal and visual modes in online dictionaries, multiple meaning-making solutions in textual design and visual design of illustrations should be appreciated. It is selected aspects of the latter (illustration formats) that the current study explores.
Making online dictionaries coherent and user-friendly is important, as L2 learners often leave them aside and use multifarious mobile apps and Web 2.0 technologies instead, such as social networking sites, YouTube, computer-mediated communications (chats, blogs, discussion forums, wikis), translation software (Google Translate), online language games and exercises, conjugation websites, or even virtual worlds (Conole, de Latt, Dillon & Darby, Reference Conole, de Latt, Dillon and Darby2006; Steel & Levy, Reference Steel and Levy2013). A recent pan-European survey reveals that “a general web search engine is increasingly the first port of call” through which even online dictionaries happen to be accessed (Kosem et al., Reference Kosem, Lew, Wolfer, Müller-Spitzer and Silveira2019: 111). To overcome a lexical deficit, people turn to the web (rather than an online dictionary) for help, and the tendency is growing. However, online dictionaries remain the essential resource for learners in Australia (Levy & Steel, Reference Levy and Steel2015). Even so, the online dictionary of today transcends traditional boundaries and labels. Not only does it offer multimodal meaning representations, but also actively engages users (in drills, games, exercises, discussion forums/communities, content generation). It is also unrecognizably built into other tools (mobile apps, web translators, or conjugation software), thereby converging into a new entity (Levy & Steel, Reference Levy and Steel2015). No wonder, then, that the word dictionary is often used to describe technologies (even discussion forums) that are not dictionaries, and vice versa (Levy & Steel, Reference Levy and Steel2015, Lew & Szarowska, Reference Lew and Szarowska2017).
The multimodal content and participatory opportunities of online dictionaries might go a long way towards bridging the longstanding gap between the cognitive and sociocultural approaches to language learning (cf. Hult, Reference Hult2019). Meaning-making and language learning have become multimodal, interactive, dialogic, participatory, and collaborative (Tour, Reference Tour2015). The “Web 2.0 turn” (Reinhardt & Thorne, Reference Reinhardt, Thorne, Arnold and Ducate2019: 211), with the resulting proliferation of linguistic resources online and diversified information-seeking patterns, has redefined literacy. Digital literacies are now needed to access, interact with, and benefit from the multifarious digital platforms, media, and modes (Hafner, Chik & Jones, Reference Hafner, Chik and Jones2015; Reinhardt & Thorne, Reference Reinhardt, Thorne, Arnold and Ducate2019). Internet users should also develop critical skills to carefully appraise web content and tools (cf. Conole, Reference Conole2008: 134). Unfortunately, “evaluation skills and criticality lag, as an overabundance of information frequently inculcates users to presume veracity” (Reinhardt & Thorne, Reference Reinhardt, Thorne, Arnold and Ducate2019: 221–222). Hopefully, research into illustration formats in online dictionaries may develop an orientation towards critical skills when using linguistic technologies and digital resources.
2. Aim
The aim of the paper is to investigate the effect of graphic illustrations (color pictures, greyscale pictures, and line drawings) in monolingual English learners’ dictionaries on language reception and learning. The following questions are posed:
-
1. Do color pictures, greyscale pictures, and line drawings in English dictionaries for foreign learners affect meaning comprehension?
-
2. Is the time of meaning comprehension on the basis of dictionary consultation dependent on the presence and type of graphic illustrations in entries?
-
3. Do color pictures, greyscale pictures, and line drawings influence dictionary-based meaning retention (both immediate and delayed)?
Thus, the study goes much beyond Lew and Szarowska’s (Reference Lew and Szarowska2017: 157) claim that dictionaries “would benefit from pictorial illustrations”; it dissects illustration categories and empirically tests their usefulness for reception and retention.
3. Methodology
3.1 Materials
To answer the research questions, an online experiment was conducted. It consisted of four parts: a pre-test, a main test, immediate and delayed post-tests.
The main test included 15 infrequent concrete English nouns and noun phrases whose meaning had to be explained (Appendix A; see supplementary material). They were shown to the participants in sentences drawn from COCA, edited for length and proper words. Great care was taken to ensure that they did not betray the meaning of the targets. For example, A fly agaric is a delightful sight is a shortened version of the following COCA sentence: A white-spotted, shiny red cap of a fly agaric, illuminated in the dim woods, is a delightful sight. To make it possible for the participants to perform the task, purpose-built monolingual entries for the target items were supplied. Based on learners’ dictionaries, each of them gave the part of speech of the headword, its pronunciation and definition. The entries differed only in illustrations. Four experimental conditions were created: with color pictures, greyscale pictures, line drawings, and without any illustrations (Appendices B–E; see supplementary material). To ensure perfect comparability, greyscale pictures and line drawings were automatically generated from color pictures.Footnote 1 They showed one object at a time, and could thus be classified as unique or single (Hupka, Reference Hupka and Hartmann2003: 363).
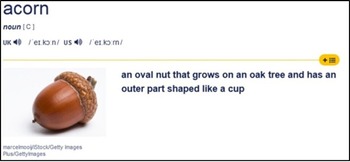
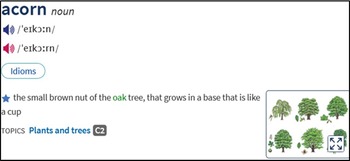
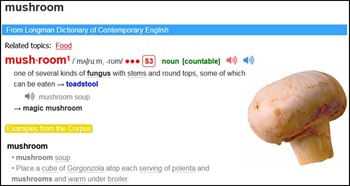
It was important to decide where in the entries pictures should be placed. In the major online English learners’ dictionaries, picture positions vary. MDO gives a picture above the definition (Figure 1); COBUILD – below the definition (Figure 2); CALD – to the left of the definition (Figure 3); and OALD and LDOCE – to the right (Figure 4 and Figure 5). In the current study, for the sake of consistency, each picture was given below the definition.

Figure 1. MDO entry for acorn
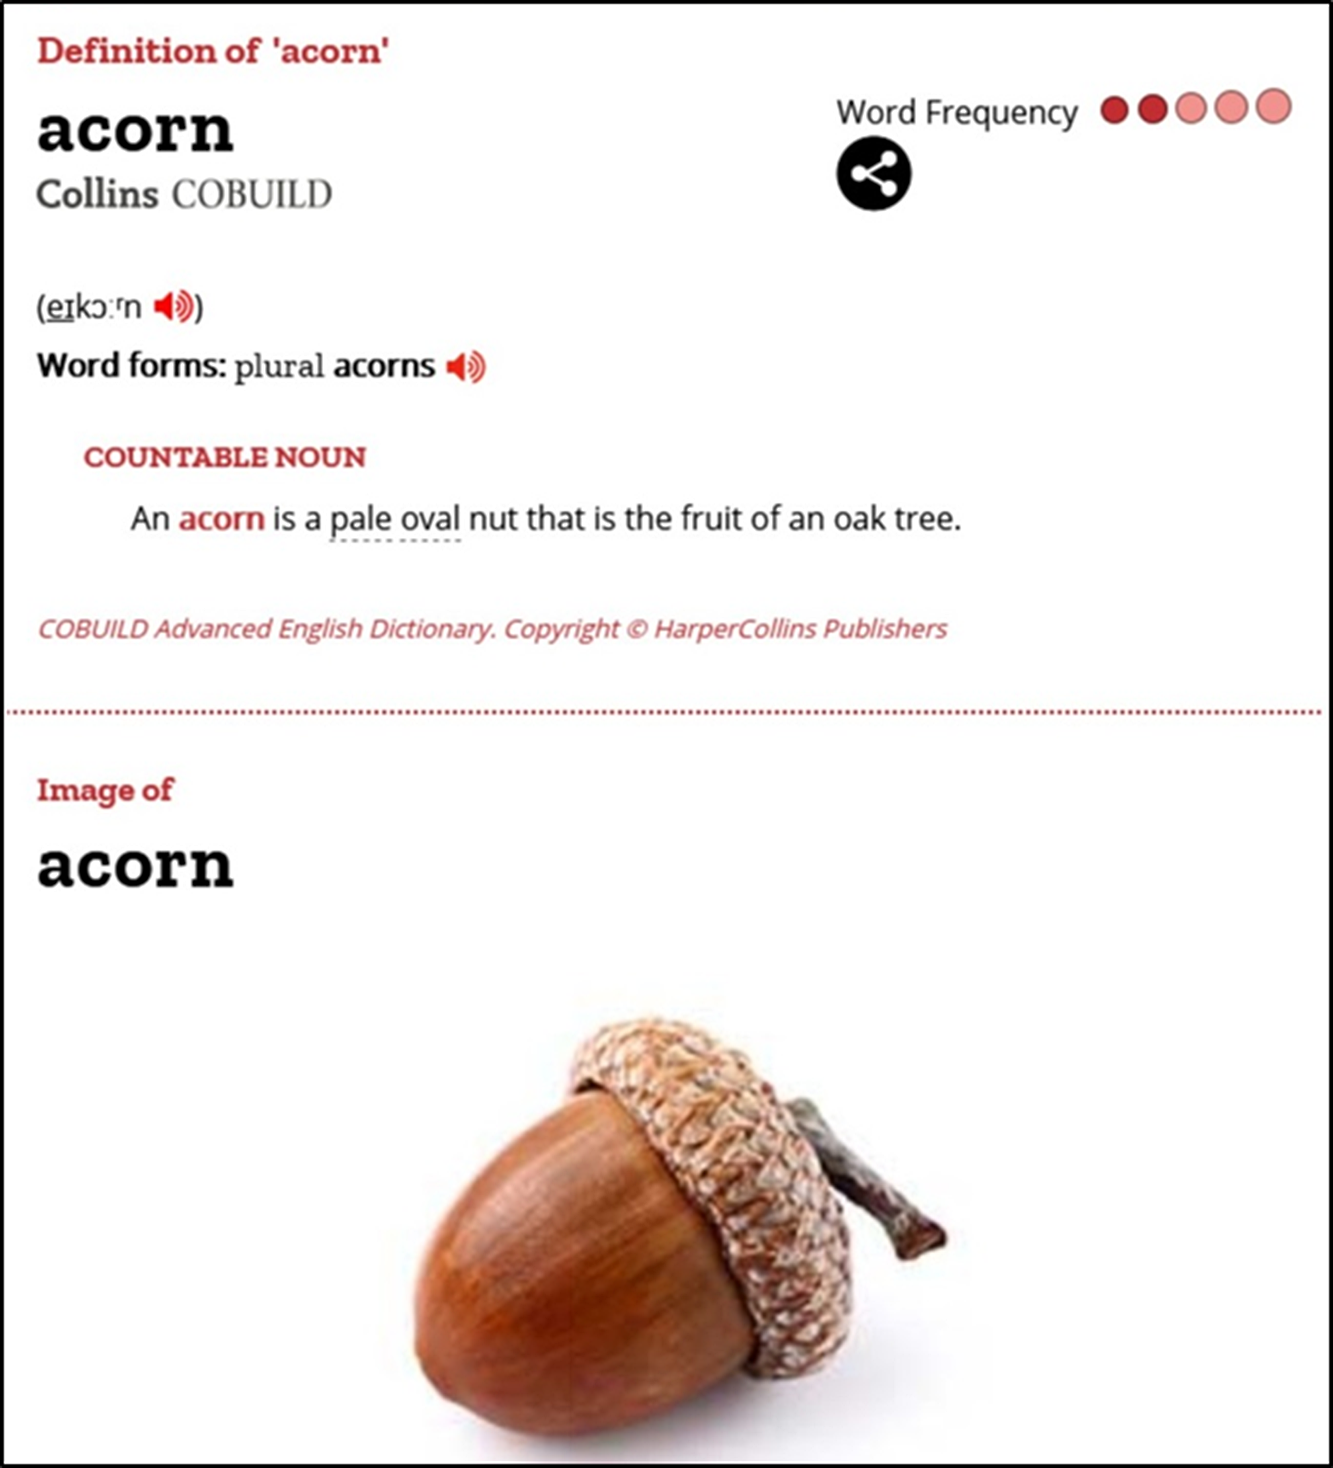
Figure 2. COBUILD entry for acorn

Figure 3. CALD entry for acorn
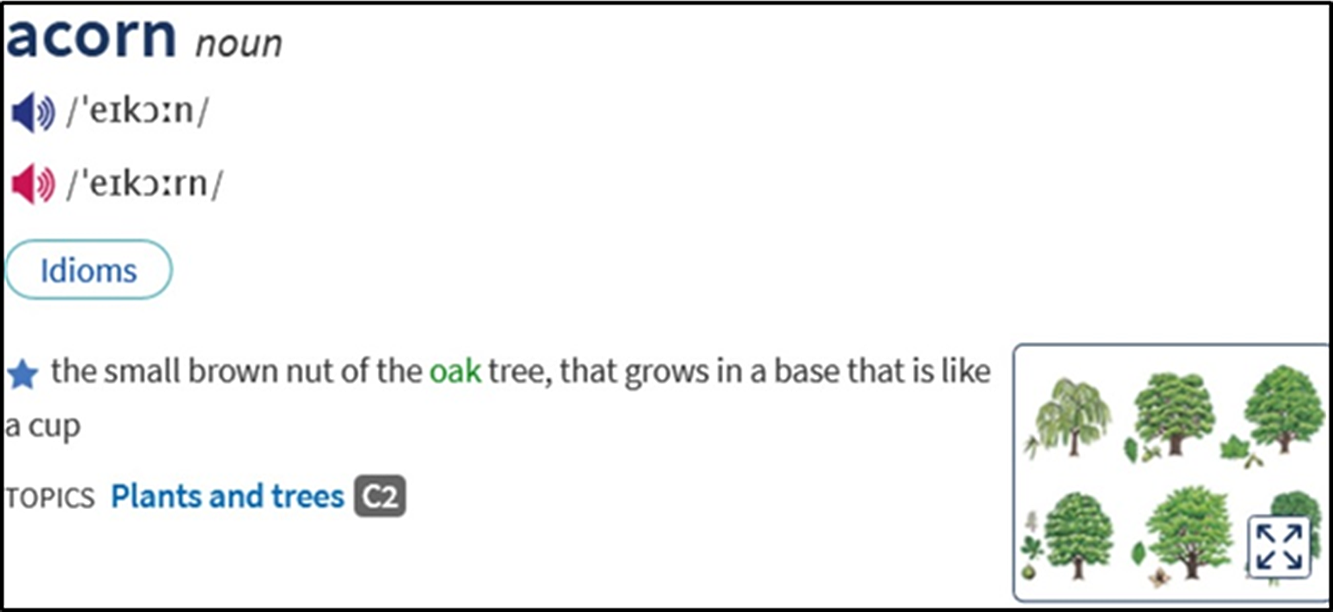
Figure 4. OALD entry for acorn

Figure 5. LDOCE entry for mushroom Footnote 4
In the pre- and post-tests, the target items had to be explained without access to any dictionary. The pre-test made it possible to identify the cases where the targets were known and eliminate them from further analysis. Meaning retention was investigated in immediate and delayed post-tests. At each stage of the experiment, the sequence of the test items was randomized. Finally, it was checked whether the participants were color-blind. As none of them were, all answers were analyzed.
3.2 Subjects and procedures
A total of 238 learners of English, students at Adam Mickiewicz University in Poznań, Poland (B2 in CEFR), participated in the study.Footnote 2 First, all of them took the pre-test. To check their background lexical knowledge, they were asked to explain the meaning of the target items underlined in corpus-based sentences. They were encouraged to provide equivalents in their mother tongue (Polish) or, if that proved impossible, explain the target meanings in their first language (L1) or in English. Immediately after the pre-test, they did the main test, where they performed the same task with the help of the supplied dictionary entries. They were randomly assigned to one experimental condition out of four; 61 of them accessed dictionaries with color pictures; 60 – with greyscale pictures; 58 – with line drawings; and 59 – with no illustrations. Like in the pre-test, they could use their L1 or English to explain meanings, but were warned against copying or translating anything from the entries.Footnote 3 The immediate post-test followed the main test. The delayed post-test was conducted two weeks later. In both post-tests, meaning explanations were elicited in L1 or in English, but, similar to the pre-test, no reference to dictionaries was allowed.
To evaluate the responses, two raters were involved. One of them was a native speaker of English proficient in the subjects’ native language, and the other spoke the same L1 as the participants and was proficient in English. Both of them were highly experienced in teaching English at university level. Scoring was conducted independently by the two raters, with a high degree of interrater reliability (r = 0.99). Any divergences in evaluation were thoroughly discussed and a consensus was reached.
For a native-language equivalent to be considered acceptable, it had to be present in at least one major, popular and comprehensive English-Polish online dictionary (cf. Lew & Szarowska, Reference Lew and Szarowska2017) or a prestigious English-Polish dictionary in traditional form. In about 2% of all cases, the participants could not find an equivalent in their native language and provided a descriptive explanation of meaning in L1. Such responses scored a point if they accurately accounted for the target meanings and were not translations of dictionary content. Descriptive meaning explanations in English, which constituted only a small minority of all cases (less than 2%), were found successful if they adequately conveyed the meaning of the target items and were not lifted from the dictionaries.
4. Results
Illustrations constituted a four-level between-subjects independent variable; each participant had access to one dictionary version, which differed only in the presence and format of illustrations (color pictures, greyscale pictures, line drawings, no illustrations). One-way GLM ANOVAs were calculated for each dependent variable (reception accuracy, reception time, immediate retention, delayed retention). The Tukey HSD test was used to conduct post-hoc comparisons.
4.1 Main test
4.1.1 Reception
Graphic illustrations had a statistically significant effect on reception (F = 5.21, p = 0.00, partial η2 = 0.218; Figure 6 – see supplementary material). Meaning explanation was significantly less successful when no illustrations were given in entries (54%) than when color pictures (80%, p = 0.01) or line drawings (77%, p = 0.02) were present. Reception not assisted by illustrations (54%) was comparable only with that supported by grayscale pictures (63.2%, p = 0.61). There were no statistically significant differences in reception between the three experimental conditions with illustrations (p > 0.05).
4.1.2 Time
Illustrations significantly affected the time of meaning comprehension (F = 18.06, p = 0.00, partial η2 = 0.492; Figure 7 – see supplementary material). Reception was the fastest when line drawings (483 s) and color pictures (535 s) were present, with no difference between these two conditions (p = 0.70). Meaning comprehension took significantly longer when entries featured greyscale pictures (661 s, p < 0.05). Decoding not assisted by any illustrations (800 s) was the most time-consuming, significantly more than in the other three experimental conditions (p < 0.05).
4.2 Retention
4.2.1 Immediate retention
Illustrations had a strong impact on immediate retention (F = 20.14, p = 0.00, partial η2 = 0.519; Figure 8 – see supplementary material). Significantly more meanings were remembered in any condition with illustrations than in the one without them (p < 0.05). Most meanings were retained when entries offered line drawings (64.5%) significantly more than when greyscale pictures were given (41.1%, p = 0.00). The retention rate for entries with color pictures (54.3%) was not significantly different from the scores in the other two conditions with illustrations (p > 0.05).
4.2.2 Delayed retention
Illustrations also had a powerful influence on delayed retention (F = 32.97, p = 0.00, partial η2 = 0.638; Figure 9 – see supplementary material). In the long run, line drawings were the most beneficial for meaning retention. Over two fifths of meanings (43.8%) were remembered two weeks after exposure to entries featuring them, which is significantly more than in any other condition (p < 0.05). Color pictures proved second best, as about one third of meanings (34.0%) were retained with their help. This result significantly exceeded those in the remaining two conditions (p < 0.05). Only one fifth of meanings (19.7%) were remembered after greyscale pictures had been seen in the main test, and one tenth (11.3%) of meanings were remembered when no illustrations had been available. These two scores were comparable (p = 0.10).
5. Conclusions
Graphic illustrations in dictionaries prove to be beneficial for language reception and learning. Color pictures and line drawings help most to comprehend meaning, whereas greyscale pictures do not make any significant contribution in this respect in comparison with illustration-free dictionaries (Research Question 1). Also, line drawings and color pictures ensure the most time-efficient reception. Meaning comprehension takes much longer when greyscale pictures are given, and the lack of illustrations extends reception most (Research Question 2). To stimulate immediate and delayed retention, line drawings are the most recommendable, followed by color and greyscale pictures. Yet, in the long run, greyscale images do not help retention significantly more than illustration-free dictionaries (Research Question 3).
Table 1 offers a symbolic summary of the findings. In each column, the same number (e.g. 1) assigned to a few illustration formats indicates that the results are not statistically different. Two different numbers in a cell (e.g. 1, 2) mean that a result is not significantly different from those with either number (1 or 2). By the same token, cells that do not have any number in common denote significantly different results. The results rank from the best (1) to the worst (3).
Table 1. Summary of the results
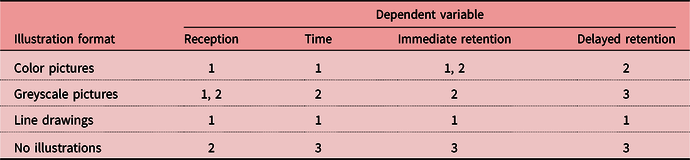
Table 1 shows that line drawings are the most recommendable. They support meaning comprehension as much as pictures in color and greyscale, and contribute as much as the former to reception pace and immediate retention. Still, it is they that ensure the best learning effects in the long run. Color pictures are the second best; they give way to line drawings only in delayed retention. Greyscale pictures prove to be the least recommendable out of the three illustration formats. First, they turn out to be no more useful for understanding meaning than illustration-free entries. Second, they extend meaning comprehension in comparison with the other two types of illustration. Third, they entail significantly worse immediate retention of meaning than line drawings. Finally, in the long run, they do not help dictionary users remember as many words as line drawings or color pictures. In fact, they do not contribute more to delayed retention than entries without any illustrations.
Otherwise, the illustration categories tested in the current study enhance meaning comprehension and its retention both immediately after dictionary lookup and later. They also speed up reception. Thus, the study shows that enriching dictionary entries with illustrations is worthwhile.
6. Discussion
It may be surprising that line drawings come off best in the ranking of dictionary illustration usefulness. Possibly, their economical form does not draw dictionary users’ attention away from the most essential attributes of the depicted objects, thereby reducing extraneous cognitive load. The advantage of line drawings might also result from people’s constant exposure to a ubiquitous mass of pictorial information, which “frequently dazzles the eyes, ears, and mind” (Schnotz, Reference Schnotz2002: 118). Consequently, new standards of presenting information may emerge. Learners might form new (even subconscious) expectations about information presentation and develop new processing habits. Illustrations so economical in form as line drawings might constitute a welcome change.
The line drawings used in the experiment were automatically generated from color pictures to ensure their perfect comparability (section 3.1). As such, they might not have been as iconic as line drawings produced by an artist. Still, they contained the fewest details of all the tested illustration formats and brought out the criterial attributes of the depicted objects. They were apparently iconic enough to be most consonant with learners’ individual visualizations of the defined objects. This might be another reason for such good results obtained with their help.
The study shows that line drawings and pictures in color significantly improve meaning comprehension in comparison with illustration-free entries. This confirms and extends Nesi’s (Reference Nesi1998) findings, who used only line drawings in her research. By the same token, meaning comprehension based on definitions alone poses a considerable challenge to dictionary users. Reception without graphic support (54.0%) was only about 70% as successful as when assisted by color pictures (80.0%) or line drawings (77.0%; 54.0*100/80.0 = 67.5, 54.0*100/77.0 = 70.1; section 4.1.1). For one thing, definitions are spatially less concentrated than pictures of single objects (used in the current study), which is likely to make them simply more difficult to process (Lew et al., Reference Lew, Kaźmierczak, Tomczak and Leszkowicz2018: 75). For another, having read a definition in L2, dictionary users might still not be confident that they properly understand the meaning. In the absence of relevant pictorial support, they are unable to confirm their (tentative) comprehension. Finally, even if they fully grasp the meaning conveyed by the definition, they might find it difficult to come up with a right equivalent in L1. Equivalent provision is no doubt easier on the basis of an explicit illustration than an L2 definition.
In the current study, immediate retention was poorer than in Gumkowska (Reference Gumkowska2008). In the condition with line drawings (64.4%), the type of illustrations used by Gumkowska (Reference Gumkowska2008), it was about 80% of her result (78.3%; 64.4*100/78.3 = 82.2). Without any illustrations (26.0%), retention was only about 40% of what Gumkowska (Reference Gumkowska2008) found (69.2%; 26.0*100/69.2 = 37.6; Figure 10 – see supplementary material).
It should be remembered that Gumkowska (Reference Gumkowska2008) used bilingual entries; each headword had an equivalent in the subjects’ native language. L1 equivalents are much shorter than definitions in L2, employed in the current investigation. Interestingly, the concreteness effect on memory (Paivio, Reference Paivio2006) indicates that memory performance improves from abstract words, to concrete ones, to objects (or their pictures). For language, the same effect is observed when the length of learning materials changes from long passages, to sentences, to words. Typically, the ratio between concrete memory and abstract memory is 2:1. The concreteness effect for the illustration-free condition in the two studies was even stronger; the ratio between equivalent-based retention (69.2%) and definition-based retention (26.0%) is 2.7: 1. For entries with line drawings, the ratio dwindles to 1.2: 1 (78.3%/64.4%). This suggests that line drawings in dictionary entries reduce the concreteness effect on memory generated by different (bilingual vs. monolingual) meaning explanations. In other words, when drawings are included in entries, retention on the basis of L2 definitions approaches the retention based on L1 equivalents. This observation is a hypothesis rather than a conclusion; the two studies did not differ only in the type of verbal meaning explanation. They involved different target items (and illustrations), tasks, materials, subjects, or sample sizes. Interestingly, Yoshii (Reference Yoshii2006) also found that L2 benefited more from illustrations than L1; his line drawings improved vocabulary learning more when added to L2 than L1 glosses.
The relatively poor retention in the current study might be attributed to the nature of assessment, the experimental task, and experimental procedures. The retention test did not parallel the verbal and visual modalities of the main test. Testing retention productively demanded that meanings be retrieved from memory without any cues. However, the best retention is achieved when the testing mode matches the treatment mode (Jones, Reference Jones2004).
In the main test, the participants could not choose the modality (verbal/visual) and navigated questions sequentially. Plass et al. (Reference Plass, Chun, Mayer and Leutner1998) show that selecting the preferred (verbal or visual) cues to retrieve meaning reduces verbalizers’ and visualizers’ cognitive load and improves retention. Likewise, interacting with materials, accessing them as needed, and deciding on the order of tasks boost vocabulary learning (Yeh & Lehman, Reference Yeh and Lehman2001). Besides, the main test showed isolated sentences from which target meanings could not be retrieved, and not a coherent text with different lookup possibilities. The latter usually yields better vocabulary retention (Laufer & Hill, Reference Laufer and Hill2000). The participants were not expected to compose original sentences with the target words to appropriately create the desired meanings. The lack of opportunities for contextualized and meaningful encoding might have hampered meaning retention (cf. Swain, Reference Swain1985). Additionally, illustrations did not show the depicted objects in context, which might have made them less meaningful and memorable (cf. Al-Seghayer, Reference Al-Seghayer2001: 225). Finally, monitoring by research assistants must have made the participants more stressed, less concentrated, and only too willing to finish quickly, which could have hindered their performance and learning.
In general, however, the study shows that definitions with illustrations stimulate retention more than definitions alone. This result coincides with other findings from computer-based L2 vocabulary learning research that point to the advantage of visual and verbal meaning representations over verbal ones (e.g. Al-Seghayer, Reference Al-Seghayer2001; Chun & Plass, Reference Chun and Plass1996; Plass et al., Reference Plass, Chun, Mayer and Leutner1998, Reference Plass, Chun, Mayer and Leutner2003; Yeh & Wang, Reference Yeh and Wang2004; Yoshii, Reference Yoshii2006).
More specifically, all the investigated illustration categories (line drawings, color and greyscale pictures) added to dictionary definitions improve immediate retention. Such a conclusion is in line with the findings by Jones and Plass (Reference Jones and Plass2002), Yoshii and Flaitz (Reference Yoshii and Flaitz2003), or Akbulut (Reference Akbulut2007), which reveal greater usefulness of pictorial and verbal clues than textual ones for immediate vocabulary learning.
As regards delayed retention, definitions with greyscale pictures proved as useful as definitions alone. Similarly, Jones (Reference Jones2004) as well as Yoshii and Flaitz (Reference Yoshii and Flaitz2003) found long-term vocabulary learning comparable for text-plus-picture and text-only annotations. The other dually coded experimental conditions in the current study (definitions with color pictures or line drawings) enhanced long-term retention much more than the singly-coded one (definitions). These results coincide with those obtained in delayed vocabulary tests by Akbulut (Reference Akbulut2007), where significantly more vocabulary was acquired after reference to both pictorial and verbal annotations than verbal ones alone.
Naturally, the utmost caution is necessary when drawing such comparisons, as the investigations differ in many respects. However, unlike the reviewed CALL research, the current study proves the value of illustrations in online dictionaries (cf. Lew & Szarowska, Reference Lew and Szarowska2017) and pinpoints the best formats for meaning comprehension and retention.
The results suggest a negative answer to the question posed by Lew et al. (Reference Lew, Kaźmierczak, Tomczak and Leszkowicz2018: 75), who wondered if the beneficial influence of pictures on meaning reception and retention comes at a cost of longer consultation. Quite surprisingly, in the current study, the shortest time spent on meaning comprehension entailed the best retention. Entries with line drawings and color pictures, for which reception was the fastest (483 s and 535 s, respectively), produced the best learning outcomes immediately after exposure (64.6% and 54.3%, respectively) and two weeks later (43.8% and 34.0%, respectively). By the same token, longer meaning comprehension involved worse retention. Illustration-free entries and those with greyscale pictures, for which reception took respectively 800 s and 661 s, generated lower retention rates immediately after the reception task (26.0% and 41.1%, respectively) and in the long run (11.3% and 19.7%, respectively; sections 4.1.2–4.2.2). Such findings stand in stark contrast to those obtained by Lew et al. (Reference Lew, Kaźmierczak, Tomczak and Leszkowicz2018), who found that longer time of entry analysis resulted in better retention when illustrations presented objects without their typical context. This observation confirms the prediction that longer elaboration, or time of item analysis, should strengthen its memory trace. It should be remembered, though, that Lew et al. (Reference Lew, Kaźmierczak, Tomczak and Leszkowicz2018) employed eye tracking and precisely identified dwell time on each entry and its components. In the current investigation, the time spent on the reception task was measured automatically, without a distinction drawn between the time of entry analysis and answer provision. Without recourse to eye tracking, it was impossible to do otherwise, as for each test item, the entry and the answer window were given on the same site so that the subjects could see the entry when supplying answers (Appendices B–E; see supplementary material). Therefore, the measurement does not reflect the time of entry analysis, but rather the time of task performance, which involves both analyzing an entry and supplying a meaning explanation. Nonetheless, the longer time spent on the task might also be expected to strengthen the memory trace and improve meaning retention, as it might suggest deeper cognitive involvement in processing meaning. Yet, the extended time does not have to indicate a greater germane cognitive load; it might result from an increased extraneous load. Greyscale pictures and illustration-free entries, which extended reception and involved poorer retention, most likely put a greater extraneous cognitive load on the participants’ working memory than line drawings and pictures in color.
7. Limitations
The conclusions come from a limited set of monosemous entries for concrete nouns, whose illustrations were not contextually rich. Yeung, Jin and Sweller (Reference Yeung, Jin and Sweller1998: 19) note that “a specific format of presentation may result in facilitation when used with some learners but retardation with different learners.” For example, visualizers learn best from text and pictures, but rely more on the latter, whereas verbalizers profit most from text alone (Plass et al., Reference Plass, Chun, Mayer and Leutner1998). In the current study, the subjects were not systematically grouped into verbalizers and visualizers. Besides, they represented only one proficiency level in one academic setting. The latter made it possible to exert strict control over their online activity, which might also have been intimidating.
8. Future prospects, lexicographic and pedagogical implications
Entries with line drawings had an advantage over those with color pictures only in delayed retention, the results for these two experimental conditions being otherwise comparable (and the best of all). This might be an argument for using both illustration formats in dictionaries. Further research is necessary to establish whether there are words that would benefit more from either. Results might be applicable to not only e-lexicography, but also computer-based multimodal vocabulary learning, where a similar research niche exists (cf. Xu, Reference Xu2010). It might also be interesting to see whether the inclusion of line drawings and pictures in color in parallel mono- and bilingual entries indeed reduces the above-mentioned concreteness effect on vocabulary learning. It should also be determined whether the usefulness of illustrations in dictionaries depends on other aspects of entry design, like the length of definitions, the defining style or the presence of examples. The role of context in illustrations merits investigation, too. It is not known whether illustrations showing objects in isolation contribute more or less to meaning comprehension and retention than contextually rich ones.
Different positions of illustrations in the microstructure should also be tested. Verdi and Kulhavy (Reference Verdi and Kulhavy2002: 41) argue that visual support should be placed before text to achieve best learning outcomes. If text is read first, a lot of working memory is devoted to its processing, with little capacity left for the subsequent image analysis. Besides, assuming that text conjures up different mental images, an individual text-based mental model can interfere with the illustration shown afterwards, which could impede learning (Schnotz, Reference Schnotz2002: 115). Such arguments should be empirically verified for online dictionaries (and multimodal e-learning materials).
Further research might benefit from accommodating the distinction between verbalizers and visualizers to see whether it plays a role in dictionary-based meaning reception and retention. If it does, it might be reasonable to consider dictionary customization so that pictures would be instantly visible to those who benefit from them most, and available on demand to those who prefer text. It might also be interesting to see whether illustrations can replace definitions, at least for visualizers. Rothenhöfer (Reference Rothenhöfer, Gouws, Heid, Schweickard and Wiegand2013) postulates replacing complex verbal explanations in dictionaries with illustrations when target users’ vocabulary is limited. Conversely, Lew et al. (Reference Lew, Kaźmierczak, Tomczak and Leszkowicz2018) and Kemmer (Reference Kemmer and Müller-Spitzer2014) emphasize complementarity between pictures and definitions. Although dictionary users look both at pictures and verbal explanations, it does not yet follow that these sources of information are always complementary. At least for some words, each of them may be self-contained. If a definition mainly redescribes a picture, mental integration of the redundant information from the definition and the essential information from the picture may impose a cognitive load that could interfere with learning (cf. Kalyuga et al., Reference Kalyuga, Chandler and Sweller1999). In such a case, eliminating redundant information might be recommendable.
Researching the suggested aspects might be useful for designing online dictionaries and multimodal instructional materials. Better coherence between visual and verbal meaning-making resources may consequently be achieved, and a pedagogy of multiliteracies may be promoted (cf. The New London Group, 1996). Different meaning representations and customization options adjusted to individual learning preferences might help develop digital literacies and the critical skills necessary to evaluate online resources (cf. Hafner, Chik & Jones, Reference Hafner, Chik and Jones2015; Reinhardt & Thorne, Reference Reinhardt, Thorne, Arnold and Ducate2019). The foregoing analysis of the role of illustration formats in online dictionaries may also encourage replicating previous experiments on multimodal L2 vocabulary learning to see whether their conclusions apply to other illustration types.
Considering the increasing use of mobile technologies inside and outside the classroom, it might also be worthwhile to conduct more naturalistic research into the usefulness of various illustration categories in online dictionaries and other multimodal learning environments (cf. Levy, Reference Levy2015). In fact, language learning research “has been experiencing a paradigm shift: it is moving from a cognitive orientation to a social orientation, from classroom contexts to naturalistic settings” (Wang & Vásquez, Reference Wang and Vásquez2012: 413). Tightly controlled PC-based experiments in lab-like conditions facilitate isolating variables and identifying causal relationships, but impose undue strain on participants. More naturalistic (lexicographic) research integrated with CALL may further bridge the gap between more cognitive and more sociocultural approaches to language learning and pedagogy (cf. Hult, Reference Hult2019).
Supplementary material
To view supplementary material referred to in this article, please visit https://doi.org/10.1017/S0958344021000264
Ethical statement
The data gathered for the purpose of the experiment were completely anonymized. All the subjects were adult university students and gave prior informed consent to participate. Participation was voluntary, and there was a possibility to withdraw at any time. The experiment constituted an extension of tasks done in class, so inflicting any psychological damage on the subjects is highly unlikely. The participants were treated in accordance with the provisions of Polish law.
About the author
Anna Dziemianko is a university professor at Adam Mickiewicz University in Poznań, Poland. Her research interests include English pedagogical lexicography, user studies, syntax in dictionaries, defining strategies as well as the presentation and distribution of lexicographic data on dictionary websites. She has researched the relative usefulness of paper and electronic dictionaries.
Author ORCIDs
Anna Dziemianko, https://orcid.org/0000-0002-6325-2948


 Open access