


INTRODUCTION
Calibration of the 14C timescale over its full length has advanced remarkably in recent decades. Several independent datasets now extend beyond ~50 cal kyr BP (Hughen et al. Reference Hughen, Southon, Lehman, Bertrand and Turnbull2006; Bronk Ramsey et al. Reference Bronk Ramsey, Staff, Bryant, Brock, Kitagawa, van der Plicht, Schlolaut, Marshall, Brauer, Lamb, Payne, Tarasov, Haraguchi, Gotanda, Yonenobu, Yokoyama, Tada and Nakagawa2012; Cheng et al. Reference Cheng, Edwards, Southon, Matsumoto, Feinberg, Sinha, Zhou, Li, Li and Xu2018), displaying detailed shared structure and improving confidence in the general trends of the 14C calibration curve, though differences still remain (Reimer et al. Reference Reimer, Bard, Bayliss, Beck, Blackwell, Bronk Ramsey, Buck, Cheng, Edwards, Friedrich, Grootes, Guilderson, Haflidason, Hajdas, Hatté, Heaton, Hoffmann, Hogg, Hughen, Kaiser, Kromer, Manning, Niu, Reimer, Richards, Scott, Southon, Staff, Turney and van der Plicht2013, Reference Reimer, Austin, Bard, Bayliss, Blackwell, Bronk Ramsey, Butzin, Edwards, Friedrich and Grootes2020 in this issue). Ocean Drilling Program (ODP) Site 1002, drilled in the Cariaco Basin off the coast of Venezuela, possesses high deposition rate sediments that are intermittently laminated, with annual varves during the last deglaciation and Holocene, but predominantly bioturbated sediments throughout the last Glacial period. Cariaco sediments contain detailed paleoclimate records showing abrupt millennial-scale climate shifts throughout the last Glacial period and beyond (Peterson et al. Reference Peterson, Haug, Hughen and Röhl2000). These millennial climate changes display abrupt shifts between quasi-stable states that occurred on timescales of decades or less (Hughen et al. Reference Hughen, Overpeck, Peterson and Trumbore1996). Similar changes have been reported from other high-resolution archives, including Greenland ice cores (Johnsen et al. Reference Johnsen, Clausen and Dansgaard1992) and speleothems from China (Wang et al. Reference Wang, Cheng, Edwards, An, Wu, Shen and Dorale2001), that possess calendar-age chronologies from layer-counting or U/Th dating. General circulation model (GCM) results show that reducing North Atlantic Meridional Overturning Circulation (AMOC), believed to have caused abrupt changes in high-latitude temperature, also result in “downstream” shifts in tropical Atlantic trade wind strength and monsoon rainfall over Asia (e.g., Rind et al. Reference Rind, Peteet, Broecker, McIntyre and Ruddiman1986; Manabe and Stouffer Reference Manabe and Stouffer1997). The Cariaco high-resolution paleoclimate records have therefore been “tuned” to the Greenland ice core (Meese et al. Reference Meese, Gow, Alley, Zielinski, Grootes, Ram, Taylor, Mayewski and Bolzan1997) and Hulu Cave speleothem (Wang et al. Reference Wang, Cheng, Edwards, An, Wu, Shen and Dorale2001) records to provide calendar age models. Such paleoclimate tuning is based upon the identification of a set of tie-points, relating to shared abrupt palaeoclimatic events and assumed to be approximately contemporaneous, in both the Cariaco record and the Greenland/Hulu records from which chronological information can be transferred. The resulting Cariaco Basin 14C calibration datasets (Hughen et al. Reference Hughen, Lehman, Southon, Overpeck, Marchal, Herring and Turnbull2004a, Reference Hughen, Southon, Lehman, Bertrand and Turnbull2006) were used to help build the IntCal04, IntCal09 and IntCal13 calibration curves (Reimer et al. Reference Reimer, Baillie, Bard, Bayliss, Beck, Bertrand, Blackwell, Buck, Burr, Cutler, Damon, Edwards, Fairbanks, Friedrich, Guilderson, Hogg, Hughen, Kromer, McCormac, Manning, Bronk Ramsey, Reimer, Remmele, Southon, Stuiver, Talamo, Taylor, van der Plicht and Weyhenmeyer2004, Reference Reimer, Baillie, Bard, Bayliss, Beck, Blackwell, Bronk Ramsey, Buck, Burr, Edwards, Friedrich, Grootes, Guilderson, Hajdas, Heaton, Hogg, Hughen, Kaiser, Kromer, McCormac, Manning, Reimer, Richards, Southon, Talamo, Turney, van der Plicht and Weyhenmeyer2009, Reference Reimer, Bard, Bayliss, Beck, Blackwell, Bronk Ramsey, Buck, Cheng, Edwards, Friedrich, Grootes, Guilderson, Haflidason, Hajdas, Hatté, Heaton, Hoffmann, Hogg, Hughen, Kaiser, Kromer, Manning, Niu, Reimer, Richards, Scott, Southon, Staff, Turney and van der Plicht2013; Hughen et al. Reference Hughen, Baillie, Bard, Warren Beck, Bertrand, Blackwell, Buck, Burr, Cutler and Damon2004b).
Here, we present the results of tuning Cariaco Basin sediment reflectance data to revised, high-resolution Hulu Cave δ18O records (Cheng et al. Reference Cheng, Edwards, Sinha, Spötl, Yi, Chen, Kelly, Kathayat, Wang and Li2016) with updated U/Th chronologies (Cheng et al. Reference Cheng, Edwards, Southon, Matsumoto, Feinberg, Sinha, Zhou, Li, Li and Xu2018). This improvement in Hulu Cave resolution enables us to re-evaluate and improve our ties. Given these updated ties, we then use the same Gaussian Process methodology (Heaton et al. Reference Heaton, Bard and Hughen2013) as used for the IntCal13 update, to propagate uncertainties in both the precise synchronicity of the selected ties and the Hulu U/Th dating through to the new Cariaco timescale. The updated Cariaco Basin 14C calibration dataset is used to help build the IntCal20, SHCal20, and Marine20 14C calibration curves (Reimer et al. Reference Reimer, Austin, Bard, Bayliss, Blackwell, Bronk Ramsey, Butzin, Edwards, Friedrich and Grootes2020 in this issue; Hogg et al. Reference Hogg, Heaton, Hua, Palmer, Turney, Southon, Bayliss, Blackwell, Boswijk, Bronk Ramsey, Pearson, Petchey, Reimer, Reimer and Wacker2020 in this issue; Heaton et al. Reference Heaton, Köhler, Butzin, Bard, Reimer, Austin, Bronk Ramsey, Grootes, Hughen, Kromer, Reimer, Adkins, Burke, Cook, Olsen and Skinner2020b in this issue), and the data are provided here with replicate 14C measurements reported as averages as well as individual dates.
Use of marine records in reconstructing atmospheric radiocarbon is complicated by the systematic 14C depletion within surface-ocean environments known as a marine reservoir age (MRA), which may vary over time. To incorporate the Cariaco 14C record into IntCal20, changes in the MRA for the Cariaco Basin through time were modeled as an additive spline and estimated during curve construction by comparison with all of the other constituent IntCal20 datasets (Heaton et al. Reference Heaton, Blaauw, Blackwell, Bronk Ramsey, Reimer and Scott2020a in this issue). This additive approach enables the Cariaco Basin to contribute strength to the IntCal20 curve in the case where 14C features are shared with other IntCal20 datasets; while reducing the impact of potentially spurious variation seen only in a single set. Further, it provides insight of potential independent interest into the magnitude and duration of MRA variability within the Cariaco Basin.
Notation: In this paper, both 14C ages and calendar ages are reported relative to AD 1950 (= 0 BP, before present). To distinguish between them, 14C ages are given in units “14C yrs BP” while calendar/calibrated ages are given as “cal yr BP” or cal kyr BP (thousands of calibrated years before present). All quoted uncertainties on values, e.g. 420 ± 50 14C yrs, refer to the 1σ level.
Calendar Chronology
The Cariaco Basin ODP sediment record has no calendar age scale of its own, and rapid climate shifts in Cariaco and other, absolute-age, paleoclimate archives have been used to transfer calendar age models to the Cariaco record. Originally, the calendar-age chronology for the Site 1002 sediment record was constructed by aligning climate changes with the annual layer counted GISP2 Greenland ice core δ18O record (Meese et al. Reference Meese, Gow, Alley, Zielinski, Grootes, Ram, Taylor, Mayewski and Bolzan1997) (Figure 1), based on evidence for synchronous timing of rapid climate shifts within the timescale of one or two decades (Hughen et al. Reference Hughen, Overpeck, Peterson and Trumbore1996, Reference Hughen, Eglinton, Xu and Makou2004c). Tie-points were based on rapid stadial-interstadial transitions (“warmings”) in Greenland, which have counterparts (reduced trade winds and increased precipitation) in the tropical North Atantic region (Hughen et al. Reference Hughen, Lehman, Southon, Overpeck, Marchal, Herring and Turnbull2004a). In Hughen et al. (Reference Hughen, Southon, Lehman, Bertrand and Turnbull2006), the Cariaco record, including transitions both into and out of millennial events, was tuned to analogous hydrological changes in U/Th-dated speleothem δ18O records from Hulu Cave (Wang et al. Reference Wang, Cheng, Edwards, An, Wu, Shen and Dorale2001). The Hulu Cave δ18O records possessed relatively low temporal resolution, and there was some uncertainty in identifying precisely analogous signals in the two records, especially in the late Glacial period ~15–25 cal kyr BP (Hughen et al. Reference Hughen, Southon, Lehman, Bertrand and Turnbull2006). The Hulu Cave speleothem records have since been updated with higher temporal resolution δ18O measurements (Cheng et al. Reference Cheng, Edwards, Sinha, Spötl, Yi, Chen, Kelly, Kathayat, Wang and Li2016) and a denser sequence of U/Th dates (Cheng et al. Reference Cheng, Edwards, Southon, Matsumoto, Feinberg, Sinha, Zhou, Li, Li and Xu2018), and the revised records show even stronger agreement with Cariaco Basin paleoclimate (Figure 2).

Figure 1 Comparison of paleoclimate records between the Cariaco Basin and Greenland ice cores: (upper) 550 nm reflectance from Cariaco sediments, showing periods of greater windiness (down) and greater rainfall (up). (lower) Oxygen isotopes from the GISP2 ice core, showing periods of increased cooling (down) and warmth (up). These tie points were used in creating the calendar age for the Cariaco Basin 14C calibration dataset used in IntCal04. Figure adapted from Hughen et al. Reference Hughen, Lehman, Southon, Overpeck, Marchal, Herring and Turnbull2004a, supplementary documentation.
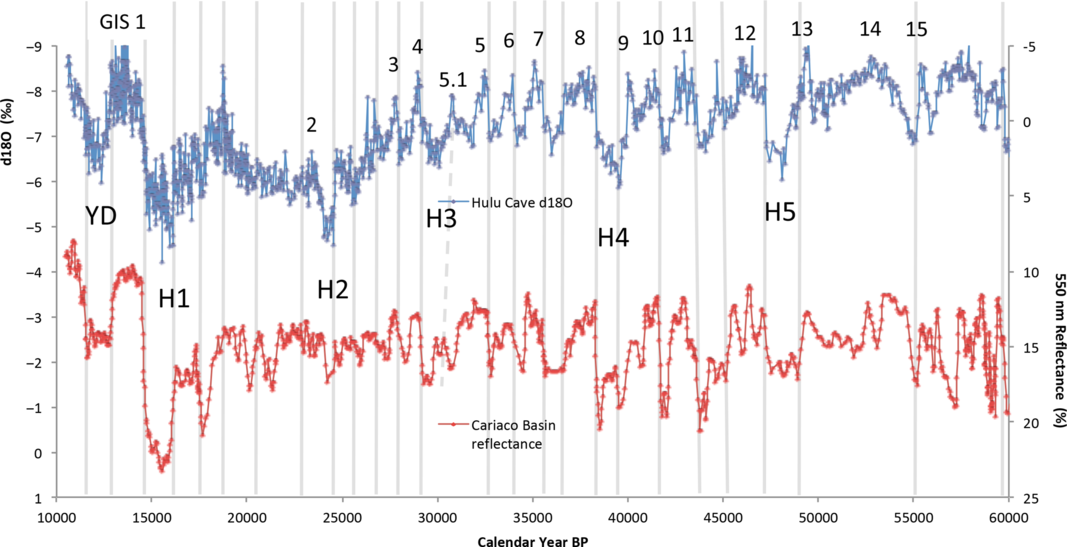
Figure 2 Comparison of paleoclimate records between the Cariaco Basin and Hulu Cave: (upper) Oxygen isotopes measured on calcite from Hulu Cave speleothems, showing wetter (up) and drier (down) conditions. (lower) 550 nm reflectance from Cariaco sediments, showing periods of greater windiness (down) and greater rainfall (up). These tie points are a subset of those used previously for the Cariaco Basin 14C calibration dataset used in IntCal09 and IntCal13 and are used to create the calendar age for the current dataset.
Sediment Depth Scale
The depth scale previously used for Cariaco Basin paleoclimate and 14C records used in IntCal was based on ODP Site 1002 Hole D, from which the majority of samples for 14C dating were obtained. A core-break occurred in Hole D near 14 mbsf, which was bridged using continuous sediments from adjacent Hole E (Hughen et al. Reference Hughen, Lehman, Southon, Overpeck, Marchal, Herring and Turnbull2004a). For consistency with sample identifications at ODP sediment core repositories, the Hole D depth scale was maintained, despite creating an anomaly in the age-depth curve around 14 mbsf (30–32 cal kyr BP) (Figure 3). Here, we have revised the depth scale by restoring 56 cm of missing sediment to the Hole D depth scale between 14.2 and 14.76 mbsf. Both original and adjusted depth scales are reported in Table 1.

Figure 3 Close-up view of Cariaco-Hulu calendar age plotted versus Cariaco Basin sediment depth. 56 cm of sediment missing from a core-break below 14 mbsf have been restored to the original depth scale (gray), and the revised age-depth model (blue) showed an anomalous tie point around 32 cal kyr BP (red). This tie-point has been removed from the current age model.
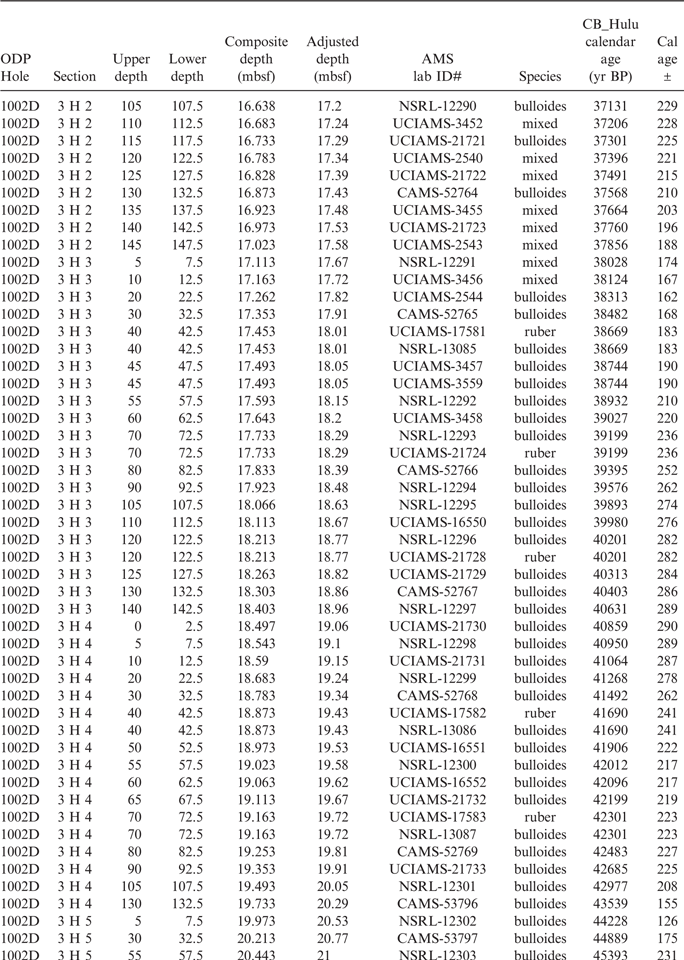
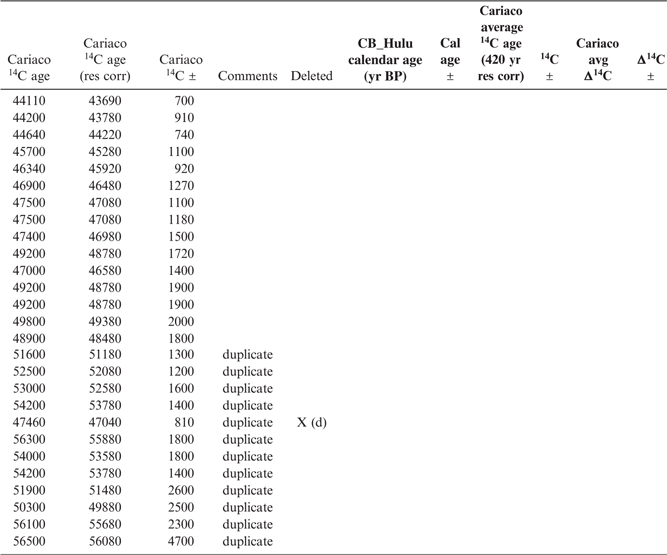
Table 1 14C and calendar age data for the Cariaco Basin Site 1002D/E marine-derived 14C calibration record. Lab identification and species information are provided for each 14C date. All errors are 1 sigma. Dates obtained by averaging two or three replicate measurements are indicated on right. Data points removed due to anomalous values (compared to means and uncertainties taken from replicates or immediately adjacent bracketing samples) are also indicated on right with an “X”; (a) indicates samples from core breaks, (b) small samples deviating by >4 sigma, (c) samples from poorly performing wheel deviating by >4 sigma, (d) non-suspect samples deviating by >4 sigma. CAMS-LLNL refers to the Center for AMS at Lawrence Livermore National Laboratory. UCI refers to the Keck AMS Facility at the University of California at Irvine. Results labeled “NSRL/NOSAMS” were prepared at the INSTAAR Laboratory for AMS Radiocarbon Preparation and Research at University of Colorado, Boulder (along with associated standards and process blanks) and provided as pressed graphite targets for measurement at the National Ocean Sciences AMS Facility at the Woods Hole Oceanographic Institution. NOSAMS-reported results were δ13C- and blank-corrected at NSRL. Results labeled “NSRL/UCI” were prepared at INSTAAR (along with associated standards and process blanks) and provided as pressed graphite for measurement and δ13C- and blank-correction at UCI.


Tie-Points
In this study, the tie points used to align the Cariaco Basin and Hulu Cave paleoclimate records were selected primarily at the rapid transitions between the tropical analogs of “stadial” and “interstadial” millennial climate events (i.e, “warmings” at high latitudes and increased precipitation in the tropics) (Figure 2). These are generally the same tie points used in Hughen et al. (Reference Hughen, Southon, Lehman, Bertrand and Turnbull2006), except that most of the less-rapid transitions between “interstadial” and “stadial” events (i.e, high-latitude “coolings” or tropical “dryings”) have been eliminated due to the lower precision of the matches. We note that during the later Glacial period, from ~15–25 cal kyr BP, the tie points are less distinct, with greater variability in the Cariaco record than in Hulu. The remaining individual tie points were evaluated to identify anomalous changes in sedimentation rate resulting from the revised depth scale. All identified tie-points were assumed to represent approximately synchronous events in the Hulu Cave and Cariaco Basin records, with an uncertainty in this contemporaneity of ±100 cal yrs (1σ) for each tie incorporated into chronology construction.
One tie point, related to a relatively minor climate event correlated with Greenland Interstadial (GIS) 5.1 immediately preceding Heinrich Event (HE) 3 (Rasmussen et al. Reference Rasmussen, Bigler, Blockley, Blunier, Buchardt, Clausen, Cvijanovic, Dahl-Jensen, Johnsen, Fischer, Gkinis, Guillevic, Hoek, Lowe, Pedro, Popp, Seierstad, Steffensen, Svensson and Winstrup2014) (Figure 2), created a sharp change in sedimentation rate at 30–32 cal kyr BP (Figure 3) and likely contributed to anomalously old calendar ages within this section in the Cariaco record and IntCal13 (Reimer et al. Reference Reimer, Bard, Bayliss, Beck, Blackwell, Bronk Ramsey, Buck, Cheng, Edwards, Friedrich, Grootes, Guilderson, Haflidason, Hajdas, Hatté, Heaton, Hoffmann, Hogg, Hughen, Kaiser, Kromer, Manning, Niu, Reimer, Richards, Scott, Southon, Staff, Turney and van der Plicht2013). This spurious link has therefore been removed, eliminating the anomalous sedimentation rates and resulting in a smoother age-depth curve overall (Figure 4). The tie points were used as input into a Gaussian process model (Heaton et al. Reference Heaton, Bard and Hughen2013) to create a continuous calendar age-depth model for the Cariaco Basin with associated age uncertainty estimates that propagate both our uncertainty in the Hulu timescale and the precise contemporaneity of the chosen ties.

Figure 4 Cariaco-Hulu age-depth models shown over the entire time scale. The revised age-depth curve (blue) is smoother overall and shows fewer abrupt changes than previously (gray).
14C Chronology
The same 14C data set used previously to help constrain 14C calibration in IntCal09 and IntCal13 (Reimer et al. Reference Reimer, Baillie, Bard, Bayliss, Beck, Blackwell, Bronk Ramsey, Buck, Burr, Edwards, Friedrich, Grootes, Guilderson, Hajdas, Heaton, Hogg, Hughen, Kaiser, Kromer, McCormac, Manning, Reimer, Richards, Southon, Talamo, Turney, van der Plicht and Weyhenmeyer2009, Reference Reimer, Bard, Bayliss, Beck, Blackwell, Bronk Ramsey, Buck, Cheng, Edwards, Friedrich, Grootes, Guilderson, Haflidason, Hajdas, Hatté, Heaton, Hoffmann, Hogg, Hughen, Kaiser, Kromer, Manning, Niu, Reimer, Richards, Scott, Southon, Staff, Turney and van der Plicht2013) is plotted here versus the updated Cariaco Basin calendar chronology (Figure 5). In this plot, we have adjusted the Cariaco 14C data sets based on a constant marine reservoir age (MRA) of 420 ± 50 14C yrs (Hughen et al. Reference Hughen, Southon, Lehman and Overpeck2000). In addition to 14C age, the absolute concentration of 14C (Δ14C), corrected for isotopic fractionation and calendar age and reported relative to 1890 atmospheric values (Stuiver and Polach Reference Stuiver and Polach1977), is plotted to amplify potential variability through time. The Cariaco data are plotted together with Hulu Cave (Cheng et al. Reference Cheng, Edwards, Southon, Matsumoto, Feinberg, Sinha, Zhou, Li, Li and Xu2018) and Lake Suigetsu (Bronk Ramsey et al. Reference Bronk Ramsey, Staff, Bryant, Brock, Kitagawa, van der Plicht, Schlolaut, Marshall, Brauer, Lamb, Payne, Tarasov, Haraguchi, Gotanda, Yonenobu, Yokoyama, Tada and Nakagawa2012) 14C calibration data for comparison. The Hulu data set has been corrected for dead carbon fraction (DCF) under an assumption of a constant DCF of 450 ± 70 14C yrs to enable comparison.

Figure 5 14C calibration dataset from the Cariaco Basin (blue) plotted versus Hulu Cave (red) and Lake Suigetsu (green) datasets. (upper) Datasets shown as age-age plots. (lower) Data plotted as original 14C concentration (Δ14C), following corrections for calendar age decay and fractionation. The datasets show fairly close agreement from ~32–10 cal kyr BP, but increased scatter prior to that time. All 14C uncertainties plotted as 1σ and include estimated uncertainties in MRA and DCF for Cariaco Basin and Hulu Cave, respectively.
All three datasets reveal close agreement, including prominent structures previously reported for the Glacial and Deglacial periods (e.g., Hughen et al. Reference Hughen, Southon, Lehman, Bertrand and Turnbull2006; Bronk Ramsey et al. Reference Bronk Ramsey, Staff, Bryant, Brock, Kitagawa, van der Plicht, Schlolaut, Marshall, Brauer, Lamb, Payne, Tarasov, Haraguchi, Gotanda, Yonenobu, Yokoyama, Tada and Nakagawa2012; Cheng et al. Reference Cheng, Edwards, Southon, Matsumoto, Feinberg, Sinha, Zhou, Li, Li and Xu2018). These include the Laschamps geomagnetic minimum and period of rapid 14C production from ~42–41 cal kyr BP, large oscillations from 40–30 cal kyr BP also attributed to geomagnetic variability (Laj et al. Reference Laj, Kissel, Mazaud, Michel, Muscheler and Beer2002; Hughen et al. Reference Hughen, Lehman, Southon, Overpeck, Marchal, Herring and Turnbull2004a), and a gradual overall decline after ~25 cal kyr BP due to increasing geomagnetic field strength and the end of Glacial climate conditions (Figure 5). The Lake Suigetsu data show a relatively higher degree of scatter than the other two records, and for clarity we show the Cariaco and Hulu data sets alone (Figure 6), although each plot is replicated including the Suigetsu data in the Supplementary Information (Figures S1–S7).

Figure 6 Same as for Figure 5, except Cariaco dataset (blue) is plotted versus Hulu Cave dataset alone (red). The close agreement between datasets is more apparent throughout the length of the records.
Marine Reservoir Age
Comparing the newly updated Cariaco Basin 14C dataset to Hulu Cave 14C in Figures 5 and 6, both plotted under the assumption of a constant level of MRA/DCF 14C depletion, does however reveal several periods where apparent offsets exist, mostly consisting of younger 14C ages (higher Δ14C values) for the Cariaco Basin data. These are most evident around 18, 23, and 30 cal kyr BP. Potential explanatory factors for these periodic offsets include periodic misalignment of the Cariaco tuning; uncertainties in the calendar age chronologies which are not indicated in Figure 5 but are incorporated in construction of the IntCal20 curve; and/or that an assumption of constant MRA/DCF depletion over time is not appropriate.
Both systems sample atmospheric 14C indirectly. The world’s ocean sequesters 14C away from replenishment at the surface long enough for significant decay to occur, and thus surface waters appear older than the contemporary atmosphere with a global average, present day, MRA of ~400 years, although with substantial spatial variability (Reimer and Reimer Reference Reimer and Reimer2001). The Cariaco Basin MRA has been measured in recent, pre-bomb sediments of known calendar age (Hughen et al. Reference Hughen, Overpeck, Peterson and Trumbore1996), and by comparison with overlapping tree rings (Kromer and Spurk Reference Kromer and Spurk1998; Kromer et al. Reference Kromer, Friedrich, Hughen, Kaiser, Remmele, Schaub and Talamo2004) further back in time during Deglaciation, to yield a value of 420 ± 50 14C yrs (Hughen et al. Reference Hughen, Southon, Lehman and Overpeck2000). Speleothems also exhibit 14C depletion as groundwater feeding Hulu Cave filters through overlying soil and bedrock, absorbing “14C-dead” CO2 and giving the growing speleothems a DCF equivalent to ~450 ± 70 14C yrs (Southon et al. Reference Southon, Noronha, Cheng, Edwards and Wang2012).
Over the period from 11–14 cal kyr BP, it is possible to obtain an estimate of MRA within the Cariaco Basin that is independent of tuning using the varved section of the record (Hughen et al. Reference Hughen, Southon, Lehman and Overpeck2000). This section of the Cariaco record, with its varve-counting chronology, can be compared with radiocarbon measurements from Northern Hemisphere (NH) tree-rings taken from the IntCal20 database (Reimer et al. Reference Reimer, Austin, Bard, Bayliss, Blackwell, Bronk Ramsey, Butzin, Edwards, Friedrich and Grootes2020 in this issue) that provide a direct record of atmospheric radiocarbon. Consequently, this estimate is also independent of the Hulu Cave’s DCF. In Figure 7 we plot the resultant MRA estimate, obtained via a Bayesian spline. As we see, the MRA is relatively constant despite past abrupt climatic changes, such as the end of the Younger Dryas (YD) cold event around 11.5 cal kyr BP, but shows a very clear reduction in MRA during the onset of the YD around 12.8 cal kyr BP where it drops by several hundred years to near zero. For the Hulu cave speleothem, an analogous comparison to NH atmospheric trees indicates that the DCF with Hulu has remained highly constant (see Figure 6 in Heaton et al. Reference Heaton, Köhler, Butzin, Bard, Reimer, Austin, Bronk Ramsey, Grootes, Hughen, Kromer, Reimer, Adkins, Burke, Cook, Olsen and Skinner2020b in this issue) over the entire 11–14 cal kyr BP period.

Figure 7 Cariaco MRA estimate obtained via a Bayesian spline when comparing the varved section of the record from 11–14 cal kyr BP to atmospheric tree-ring data from the IntCal20 database. The MRA estimate we obtain over this period is independent from both tuning and Hulu Cave’s DCF. Each plotted point corresponds to the observed offset between an individual 14C determination from the Cariaco varved record and the IntCal20 curve, which in this period is based only on tree-ring samples. The observed offsets are shown with 1σ uncertainties representing the calendar age uncertainty of the varved Cariaco 14C determinations, and 1σ uncertainties in 14C which incorporate both the uncertainty in the Cariaco 14C sample and the IntCal20 curve at that calendar age. The MRA is relatively constant across the abrupt climate change at the YD termination (~11.5 cal kyr BP) but shows a clear reduction to near zero during the YD onset (~12.8 cal kyr BP).
The above independent comparisons of the varved Cariaco and Hulu records against NH tree-rings that provide direct sampling of atmospheric 14C suggest that the periodic (and short lived) offsets between Hulu and the tuned Cariaco are likely due to MRA changes as opposed to mistuning.
Incorporating Cariaco Basin into the IntCal20 Curve
To incorporate the Cariaco Basin 14C dataset into the IntCal20 curve, we need to model its MRA changes over time. For the other marine datasets used for the estimation of IntCal20, such MRA estimates were obtained using the three-dimensional Large Scale Geostrophic Ocean General Circulation Model (LSG OGCM) (Butzin et al. Reference Butzin, Köhler and Lohmann2017, Reference Butzin, Köhler, Heaton and Lohmann2020 in this issue). However, this model does not have the resolution to simulate the unique topography of the Cariaco Basin, as evidenced by its inability to recreate the reduction in MRA seen around 12.8 cal kyr BP in Figure 7.
Consequently, we adopt a different approach to MRA modeling for the Cariaco Basin. We consider the Cariaco MRA as an unknown 14C offset, via an additional Bayesian spline, and seek to adaptively estimate its value during curve construction itself based upon comparison to the other datasetsFootnote 1. At each iterative step of our Markov Chain Monte Carlo curve construction approach (Heaton et al. Reference Heaton, Blaauw, Blackwell, Bronk Ramsey, Reimer and Scott2020a in this issue) we update both our estimate for the atmospheric 14C calibration curve and our estimate for the Cariaco MRA based upon its observed offset from that curve.
This adaptive approach does introduce some questions regarding identifiability of 14C changes within the Cariaco Basin record—to what extent is a feature seen within the Cariaco record due to a change in MRA within the basin, and to what extent an atmospheric event? Typically, through our chosen approach, we would expect features only seen within the Cariaco Basin to be considered a basin-specific MRA effect; while those additionally seen in other records would be considered atmospheric and reproduced in our atmospheric IntCal20 estimate.
As such, the Cariaco Basin plays a somewhat unique role in the construction of the IntCal20 curve. The additional flexibility provided by our adaptive modeling of the MRA will hopefully resolve the periods of systematic offsets between the Cariaco Basin and Hulu datasets (as seen in Figures 5 and 6) that may be due to short term MRA changes. However, the inclusion of Cariaco Basin still provides us with a better ability to recognize and retain shared features seen across multiple records and hence provide a more robust atmospheric 14C curve—the intended aim of the IntCal project.
Inferred MRA Changes within Cariaco Basin over Time
As a consequence of this adaptive approach to modeling Cariaco Basin’s MRA, alongside construction of the IntCal20 curve, we simultaneously obtain a posterior estimate of the MRA within the Cariaco Basin over time. This is shown in Figure 8a and is of potential independent interest. We discuss this posterior estimate below, illustrating the changing offset in the Cariaco Basin compared to Hulu cave. In building the IntCal20 (Reimer et al. Reference Reimer, Austin, Bard, Bayliss, Blackwell, Bronk Ramsey, Butzin, Edwards, Friedrich and Grootes2020 in this issue) and Marine20 (Heaton et al. 2020b in this issue) curves, marine datasets were corrected for changes in MRA through time. Global MRAs were calculated using an ocean GCM (OGCM) (Butzin et al. Reference Butzin, Köhler, Heaton and Lohmann2020 in this issue) and applied to individual datasets according to region. However, the modeled MRA variability for the Cariaco Basin appears much too high (Figure 8b), possibly due the OGCM’s inability to capture the unique bathymetry and hydrographic setting of the basin. We therefore use the posterior estimate of the MRA to correct the Cariaco 14C calibration curve back through time (Heaton et al. 2020 in this issue). Due to the density of Hulu Cave measurements in the combined IntCal20 database, and the assumption of an approximately constant DCF over time within each Hulu speleothem in IntCal20 construction, this 14C offset between the Cariaco and Hulu data is the primary driver for the obtained MRA estimate.

Figure 8 (a) Posterior mean estimate (shown in black with the 95% credible interval) of Cariaco Basin’s MRA through time, obtained simultaneously to IntCal20 curve construction. This MRA estimate is obtained adaptively as an additive Bayesian spline at the same time as the IntCal20 curve is constructed based upon the observed offset between Cariaco and other individual 14C calibration datasets used in IntCal20. The procedure captures the same timing, direction and relative magnitude of Cariaco MRA changes as seen in direct comparisons with Hulu Cave data (following figures), likely due to the density of Hulu Cave measurements in the combined IntCal20 datasets and the assumption of constant DCF depletion. (b) Cariaco posterior mean MRA estimate shown together with the estimates for the nearest open-ocean site to the Cariaco Basin obtained by the LSG OGCM under three different climate scenarios when driven by a preliminary estimate of atmospheric Δ14C obtained from the Hulu cave speleothems alone (Butzin et al. Reference Butzin, Köhler, Heaton and Lohmann2020 in this issue). Regional first-order Hulu-based LSG OGCM estimates were used to incorporate the other marine datasets into IntCal20 (Reimer et al. Reference Reimer, Austin, Bard, Bayliss, Blackwell, Bronk Ramsey, Butzin, Edwards, Friedrich and Grootes2020 in this issue) but do not appear appropriate for the Cariaco Basin, as they overestimate the variability and magnitude of MRA values through time.
Looking closely at both our posterior MRA estimate and the apparent deviations between Cariaco Basin and Hulu Cave 14C through time, we can evaluate the timing of 14C change relative to rapid climate shifts in the paleoclimate record. As discussed above in Figure 7 comparing against trees that directly sample the atmosphere, the YD onset is clearly seen to coincide with an apparent reduction of Cariaco MRA by several hundred years. This is also seen when the Cariaco data is compared against the Hulu data alone (Figure 9). Similarly, Cariaco MRA appears to drop by several hundred years during the time of Heinrich Event 1 (Figure 10). The MRA decrease follows event H1b and persists throughout the transition into event H1a. However, there is no apparent change in MRA during the climatically more severe H1a event (Figure 10). The calendar age of this MRA decrease is bracketed by tie points at the end of H1b and the onset of H1a (17,148 and 16,150 cal yr BP, respectively), and falls within the older half of an anomalous “grey layer” that bears evidence of increased freshwater input and fluvial runoff (Yurco Reference Yurco2010). However, in order to explain the Cariaco 14C age plateau as resulting from rapidly increased sedimentation (from terrestrial runoff), ~63 cm of sediment would have had to be deposited nearly instantaneously soon after event H1b. In the absence of evidence for such an extreme sedimentation event, this MRA decrease around the time of H1 appears real. Although the precise calendar age of this feature has relatively high uncertainties from the tuning process, the relative timing of the MRA decrease well before the climatic H1a stadial suggests that increased atmospheric Δ14C associated with reduced AMOC (e.g., Hughen et al. Reference Hughen, Overpeck, Lehman, Kashgarian, Southon, Peterson, Alley and Sigman1998) may not have played a role here. Rather, the apparent reduction in Cariaco MRA is likely associated with decreased mixing of deep waters due to increased stratification in surface waters of the tropical North Atlantic or Cariaco Basin region.

Figure 9 Detailed comparison of timing between Cariaco Basin paleoclimate and 14C excursions relative to Hulu Cave (considered here as changes in MRA), focusing on the period of the Younger Dryas cold event. (upper) 550 nm reflectance from Cariaco sediments, showing periods of greater windiness (down) and greater rainfall (up). (middle) Cariaco Basin (blue) versus Hulu Cave (red) age-age plots. (lower) Cariaco Basin (blue) versus Hulu Cave (red) Δ14C plots. Reduced Cariaco MRA appears as lower 14C ages but higher Δ14C. Cariaco data are corrected with a constant 420 ± 50 14C yrs MRA (Hughen et al. Reference Hughen, Southon, Lehman and Overpeck2000), and Hulu data have a constant DCF correction of 450 ± 70 14C yrs (Southon et al. Reference Southon, Noronha, Cheng, Edwards and Wang2012). These uncertainties are propagated into the plotted error bars.

Figure 10 Same as for Figure 9 but focusing on the period surrounding Heinrich Event 1.
The general timing of periods of reduced Cariaco MRAs reveals that an episode occurred approximately every 6–7 cal kyrs, suggestive of the intervals between Heinrich Events (Rasmussen et al. Reference Rasmussen, Bigler, Blockley, Blunier, Buchardt, Clausen, Cvijanovic, Dahl-Jensen, Johnsen, Fischer, Gkinis, Guillevic, Hoek, Lowe, Pedro, Popp, Seierstad, Steffensen, Svensson and Winstrup2014). To test for a potential link between climate and MRA changes, we examine the detailed evidence for reduced Cariaco MRA during earlier Heinrich events (Figures 11–14). Although we do in fact observe reduced Cariaco MRA near the occurrence of Heinrich Events, the timing in general is off, with reduced MRA beginning up to 2000 cal yrs after the onset of the climatic events (Figures 11–14). In addition to reduced MRA, we also see evidence for a period of increased MRA between 28 and 25 cal kyr BP (Figure 15). Although there was likely an overall increase in MRA during the Glacial period, due to reduced carbon reservoirs in the atmosphere, biosphere and shallow ocean sediments (e.g., Hughen et al. Reference Hughen, Lehman, Southon, Overpeck, Marchal, Herring and Turnbull2004a), this would not explain a short interval of increased MRA from 25–28 cal kyr BP. This interval instead appears to be part of the cyclical pattern of Cariaco MRA changes (Figure 8a) and may represent a period of relatively weak stratification and strong deep mixing (upwelling).


We note that, due to potential variability in both Hulu DCF and Cariaco MRA through time, the magnitude and even exact timing of changes in the Cariaco Basin MRA cannot be determined with precision. In particular, our current estimates are heavily based upon the assumption that the DCF within Hulu Cave remained approximately constant from 0–55 cal kyr BP. If global MRA were adjusted upward due to Glacial boundary conditions, it would increase the apparent magnitude of periodic Cariaco MRA reductions, and even slightly broaden the durations of the events. Regardless, the general pattern of quasi-periodic cycles of MRA variability appears to be robust (Figures 8, 16). Overall, the disagreement in relative timing between reduced MRA in the Cariaco Basin and Heinrich Events (Figure 16) precludes reduced AMOC during H events as a potential cause. The data suggest cyclic decreases in Cariaco MRA to values below 100 14C years, despite Glacial boundary conditions that should have somewhat increased surface ocean MRA around the globe (Hughen et al. Reference Hughen, Lehman, Southon, Overpeck, Marchal, Herring and Turnbull2004a; Butzin et al. Reference Butzin, Köhler, Heaton and Lohmann2020 in this issue). These low reservoir ages are an extraordinary finding without analog in the modern ocean and are difficult to reconcile with physical or geochemical models of ocean circulation. At a minimum, these results suggest periodic swings in surface stratification in the Cariaco Basin region with times of greatly reduced mixing of 14C-depleted “older” water from below. However, a clearer vision of true atmospheric 14C throughout the Glacial period may be necessary in order to draw a firmer conclusion. The Lake Suigetsu record provides such an atmospheric record, but the magnitude of scatter in the current dataset precludes the identification of MRA shifts, and extension of dendrochronologies such as from floating Kauri sequences (Turney et al. Reference Turney, Fifield, Hogg, Palmer, Hughen, Baillie, Galbraith, Ogden, Lorrey, Tims and Jones2010) may be the best solution.

Figure 16 Comparison of timing between Cariaco Basin paleoclimate and 14C excursions relative to Hulu Cave, shown over entire timescale of the data sets: (upper) 550 nm reflectance from Cariaco sediments, showing periods of greater windiness (down) and greater rainfall (up). The general timing of Heinrich Events in the Cariaco record is shown by light blue bars. (lower) Cariaco Basin (blue) versus Hulu Cave (red) Δ14C plots. Periods of reduced Cariaco MRA occur every 6–7 cal kyrs (indicated by light blue bars) but appear distinct from Heinrich Events.
CONCLUSIONS
The 14C calibration data set from intermittently varved sediments of the Cariaco Basin has been substantially updated, with changes to calendar and 14C chronologies. Revising the depth scale to reflect sediment missing from a core break provided a more accurate view of age-depth changes over the length of the record. A re-evaluation of tie points between existing Cariaco and newly updated Hulu Cave paleoclimate records resulted in the removal of one anomalous tie point, and better agreement between 14C datasets. Close comparison of Cariaco and Hulu 14C data shows periodic episodes of reduced Cariaco MRA, but coeval paleoclimate records show no direct relationship with the occurrence of Heinrich Events in the high-latitude North Atlantic region. The determination of the exact magnitude and duration of MRA variability is sensitive to long-term background changes in both Cariaco MRA and Hulu Cave DCF. However, an apparently cyclic pattern of Cariaco MRA decreases, possibly driven by increased surface ocean stratification, appears to be a robust feature of the updated record. An atmospheric 14C dataset with less scatter than the Lake Suigetsu record, potentially from floating Kauri sequences, is needed to determine the precise history of MRA variability in the Cariaco Basin and elsewhere. Nevertheless, the Cariaco 14C calibration dataset presented here incorporates several improvements over previous versions and more accurately reflects changes in both marine and atmospheric 14C through time.
ACKNOWLEDGMENTS
The authors would like to thank Prof. Edouard Bard and an anonymous reviewer for helpful comments that improved the quality of the manuscript. K.A. Hughen was supported by funds from U.S. NSF grant #OCE-1657191, and by the Investment in Science Fund at WHOI. T.J. Heaton is supported by a Leverhulme Trust Fellowship RF-2019-140\9, “Improving the Measurement of Time Using Radiocarbon”.
Supplementary material
To view supplementary material for this article, please visit https://doi.org/10.1017/RDC.2020.53


 Open access