


INTRODUCTION
The European Spallation Source (ESS) is under construction in Lund in southernmost Sweden (55.73N, 13.45E). The ESS will function as a giant microscope, using neutrons as probes, to study materials in a number of scientific fields ranging from molecular biology to nanotechnology. The facility consists of a 0.5 km long linear accelerator system that will deliver a pulsed beam of protons with energies up to 2 GeV and an average power up to 5 MW (Garoby et al. Reference Garoby, Vergara, Danared, Alonso, Bargallo, Cheymol, Darve, Eshraqi, Hassanzadegan and Jansson2017). Fast neutrons will be produced through spallation reactions occurring when the proton beam hits a helium-cooled, 11-tonne rotating target wheel containing hundreds of tungsten bricks, encapsulated in stainless steel. The neutrons will be moderated to thermal and cold energies using a para-hydrogen and water-based moderator as well as a beryllium reflector, before being directed to the neutron scattering experimental stations. A cylindrical radiation shield consisting of 6000 tonnes of steel, called the monolith, will surround the tungsten target.
An inevitable consequence of the spallation process itself, neutron activation and other processes in the target is the production of over 1000 different radionuclides (Kókai et al. Reference Kókai, Török, Zagyvai, Kiselev, Moormann, Börcsök, Zanini, Takibayev, Muhrer and Bevilacqua2018; Mora et al. Reference Mora, Sordo, Aguilar, Mena, Mancisidor, Aguilar, Bakedano, Herranz, Luna and Magan2018; Stenberg et al. Reference Stenberg, Hjerpe and Avila2020; Barkauskas and Stenström Reference Barkauskas and Stenström2020). As with any other high-energy accelerator, the operation of the accelerator will also generate radionuclides through nuclear reactions with the materials in various parts of the accelerator system, indoor air and surrounding soil and water (Stevenson Reference Stevenson2001; Bungau et al. Reference Bungau, Bungau, Cywinski, Barlow, Edgecock, Carlsson, Danared, Mezei, Holm and Møller2014). A fraction of the radioactive gases and aerosols that are expected to be generated in the accelerator tunnel during normal operation will be released into the environment via the main 45-m-high ESS ventilation stack (Ene et al. Reference Ene, Avila, Hjerpe, Bugay and Stenberg2018). Releases may also occur from a 25-m-high stack on the building in which radioactive waste is handled, and diffuse leakages are also expected. Significantly higher amounts of radioactive gases and aerosols may be released, e.g., from the tungsten target, in the case of an accident (Blixt Buhr et al. Reference Blixt Buhr, Johansson, Kock, Karlsson, Lindgren and Tengborn2018).
The radionuclides that will be produced in the ESS target differ from those produced, for example, in a nuclear power plant or by medical cyclotrons. One radionuclide of importance for radiological protection will be the pure alpha emitter 148Gd (Blixt Buhr et al. Reference Blixt Buhr, Johansson, Kock, Karlsson, Lindgren and Tengborn2018). Other radionuclides, such as 14C and 3H, are also produced by, and released from, nuclear power plants during normal operation. 14C is expected to be produced in several different parts of the ESS facility, by activation of air in the accelerator tunnel (Ene Reference Ene2015) and the primary cooling water system (Emås Reference Emås2018a, Reference Emås2018b). Using simplified and conservative assessments, the annual 14C release rate during normal operation has been estimated to be about 3.3·1010 Bq yr-1 (IAEA 2001; Stenberg et al. Reference Stenberg, Hjerpe and Avila2020). This is about 10% of that released by a light-water moderated nuclear reactor of 1 GW electrical power (IAEA 2004). The chemical form of the 14C releases from the ESS is expected to be 14CO2 (Emås Reference Emås2018b). The released 14C will therefore easily enter the human food chain and constitute a radionuclide of significant radiological importance.
The ESS is categorized as a facility requiring a licence from the Swedish Radiation Safety Authority (SSM). The European Research Infrastructure Consortium (ERIC), responsible for running the facility, is thus obliged to ensure there is adequate radiation protection to minimize the exposure of members of the public to ionizing radiation (SSM 2019). The committed effective dose to members of the public through exposure from the facility (including exposure to 14C), resulting from 1 year’s operation, must not exceed 0.1 mSv (SSM 2019). Therefore, realistic dose assessments are required, and measurements of radioactive discharges from the facility must be made and reported, together with the monitoring of radionuclides in the environment, as stated by the SSM in the specific conditions for the ESS facility (SSM 2019). As recommended by the IAEA (IAEA 2005), various preoperational studies must also be carried out, including mapping the “zero-point” or baseline of the radiation environment at the site (SSM 2019).
Part of this paper presents the results of preoperational assessments of 14C for the ESS performed during the period 2017–2020. These 14C measurements are part of a larger preoperational environmental monitoring programme that also includes ambient dose rate measurements, in situ and mobile gamma spectrometry, gamma spectrometry of various environmental samples, and measurements of 3H and 129I (Bernhardsson et al. Reference Bernhardsson, Eriksson Stenström, Jönsson, Mattsson, Pedehontaa-Hiaa, Rääf, Sundin and Waldner2018, Reference Bernhardsson, Eriksson Stenström and Pedehontaa-Hiaa2020a, Reference Bernhardsson, Eriksson Stenström, Pedehontaa-Hiaa and Jönsson2020b, Reference Bernhardsson, Eriksson Stenström, Jönsson, Pedehontaa-Hiaa and Mattsson2021). Levels of 14C have been analyzed in environmental samples of grass, fruits, berries, agricultural crops, moss, honey, milk, meat, and annual growth rings of trees (for retrospective analysis for the period 2012–2016). These samples were mainly collected within a few km of the ESS construction site, but also in Lund city center and at rural reference sites. Lund is a research-intense city hosting several workplaces (hospital, university departments, companies) using radioactive substances, including 14C (see e.g., Stenström et al. Reference Stenström, Leide-Svegborn and Mattsson2008, Reference Stenström, Unkel, Nilsson, Rääf and Mattsson2010b, where we reported on the contamination of radiation workers by 14C). The majority of these workplaces are located between the city center and the ESS, ∼5 km NE of the city center, and the local impact and variability in space and time of potential releases of 14C from these workplaces must be accounted for when determining the radiological impact of the ESS facility.
We also report on environmental 14C measurements following a local contamination event in Lund discovered in April 2009, when blank samples of graphite analyzed using accelerator mass spectrometry (AMS) at the Lund Radiocarbon Dating Laboratory unexpectedly showed elevated levels of F14C (∼0.15, compared to the normal level of ∼0.005) (Skog Reference Skog2010). The initial decrease in 14C/12C ratio observed during these AMS measurements indicated surface contamination of the pressed graphite powder samples, indicating airborne contamination. As was customary at that time, the pressed graphite samples had been stored for 1–2 weeks in glass vials with plastic lids prior to analysis. Further investigations showed that the samples were only contaminated after graphitization and when graphite had been stored as pressed. New laboratory routines were therefore introduced, and graphite cathodes are now pressed only 1–2 days before AMS measurements and stored in an argon atmosphere in glass tubes with airtight seals, i.e., the same storage conditions as used previously for graphite before pressing. Furthermore, the ventilation was improved to prevent dust from outside entering the preparation and graphitization rooms in the laboratory. No elevated background values have been observed in AMS measurements at the laboratory since these measures were introduced. Extensive investigations, using, for example, fullerene soot monitors (as described by Bernhardsson et al. Reference Bernhardsson, Eriksson Stenström, Jönsson, Mattsson, Pedehontaa-Hiaa, Rääf, Sundin and Waldner2018) at various locations in Lund and during different time periods, revealed that the probable source of the contamination was a leaking radioactive waste storage tank located outdoors, and action was taken to stop the leakage. We also present measurements of 14C in horse-chestnut leaves collected at various locations in Lund in June 2009, as well as annual growth rings of trees collected in 2010 (for retrospective analysis for the period 2006–2010) in the vicinity of the presumed source of contamination, as an example of the sort of potential 14C pollution that must be accounted for in the assessment of the impact of the ESS.
MATERIALS AND METHODS
Sites
The ESS facility (55.734N, 13.248E) is under construction in the northern outskirts of the city of Lund (population ∼90,000) in the southernmost region of Sweden. The city of Malmö (population ∼320,000) is located 16 km SW of Lund, and the capital of Denmark, Copenhagen (pop. ∼1 million) is ∼40 km W of Lund across the Öresund Strait. The nuclear power plant at Barsebäck, ∼20 km W of the ESS, was closed down in 2005, and is currently being decommissioned and dismantled. Three rural reference sites were used in this study: Måryd, Borrby Strand and Skillinge. Måryd (55.696N, 13.371E) is located ∼10 km east of Lund, and has been used by the Lund Radiocarbon Dating Laboratory as a rural reference site since 1975, for the collection of Juncus sp. (rushes) growing close to a small pond (Håkansson Reference Håkansson1977; Reference Håkansson1987, Reference Håkansson1988; Stenström et al. Reference Stenström, Skog, Thornberg, Erlandsson, Hellborg, Mattsson and Persson1997, Reference Stenström, Skog, Nilsson, Hellborg, Leide-Svegborn, Georgiadou and Mattsson2010a; Magnusson et al. Reference Magnusson, Stenström, Skog, Adliene, Adlys, Hellborg, Olariu, Zakaria, Rääf and Mattsson2004, Reference Magnusson, Stenström, Adliene, Adlys, Dias, Rääf, Skog, Zakaria and Mattsson2007). Borrby Strand (55.42N, 14.22E) is located on the southeast coast, at about ∼72 km from Lund, and has been used as a rural reference site in previous studies (Stenström et al. Reference Stenström, Skog, Thornberg, Erlandsson, Hellborg, Mattsson and Persson1997, Reference Stenström, Erlandsson, Mattsson, Thornberg, Hellborg, Kiisk, Persson and Skog2000). Skillinge (55.466N, 14.279E) is located ∼6 km from Borrby Strand and ∼42 km from Lund and was included in this study to serve as a future marine reference site due to the rich abundance of the marine bioindicator Fucus vesiculosus (bladderwrack). The research station at Hyltemossa (56.10N, 13.42E), one of several ICOS (Integrated Carbon Observation System) research infrastructures devoted to European greenhouse gas observations, is located 46 km NNE of Lund. 14C data from CO2 samples, collected biweekly since the end of 2016 at 150 m above ground level, are available from the Hyltemossa research station (ICOS 2020). Those data served as regional reference values of 14C in clean air CO2 in the present study (data until the end of 2019 are currently available). The consumption of dairy products constitutes an important pathway for many anthropogenic radionuclides in humans. There are few dairy farms in the area surrounding the ESS, as the soil in the region is fertile and mainly used for growing crops. Two dairy farms were used in this study. The dairy farm closest to the ESS (Sandby), located ∼6 km E of the ESS, was phased out in 2020, and in our program it was replaced by a more remote dairy farm (Södervidinge, ∼14 km NW of the ESS). Figure 1 (left) presents an overview of the study area in southern Sweden including the rural sampling sites and dairy farms, the location of the former nuclear power plant at Barsebäck and the Hyltemossa research station.

Figure 1 Left: Study area in southern Sweden, with the rural reference sites Måryd, Borrby Strand and Skillinge, as well as the city of Lund, the ESS, the two dairy farms investigated and Barsebäck (location of the nuclear power plant closed down in 2005). Right: Sampling sites in the Lund area, 2017–2020. (© Lantmäteriet, Dnr: I2014/00579.)
The ESS is located 4.8 km NE of the city center and is surrounded by farmland used for food production. The city of Lund is, however, expanding further towards the ESS, and there are plans to build private housing as well as university buildings and companies close to the site. Several farmhouses and a few villages are currently located within a few km of the ESS site. Figure 1 (right) shows the 14C sampling sites used in the Lund area for the preoperational studies of the ESS during 2017–2020. Site 48 was used as an urban reference site (4.5 km east-southeast of the ESS main stack). Sites 45, 52, 53, 54, and 56 are located between the city center and the ESS, in the area of Lund where there are several potential sources of 14C, such as the University Hospital, Lund University departments and research-based companies. Site 55 is urban allotments, where citizens of Lund cultivate vegetables. Sites 17 and 34 are close to another large research facility in Lund, the synchrotron light research facility MAX IV, which may also generate and release low levels of radioactive nuclides to the environment. The sites around the ESS cover all wind directions and were chosen taking expected atmospheric dispersion patterns from the ESS main stack into account.
The sites used for sampling horse-chestnut leaves (Aesculus hippocastanum) in 2009 and annual growth rings of common ash (Fraxinus excelsior) in 2010 are shown in Figure 2. Sites D-I are located in an area of Lund with several potential sources of 14C. The Lund Radiocarbon Dating Laboratory, hosting the Single Stage Accelerator Mass Spectrometry (SSAMS) facility, is also located in this part of the city.
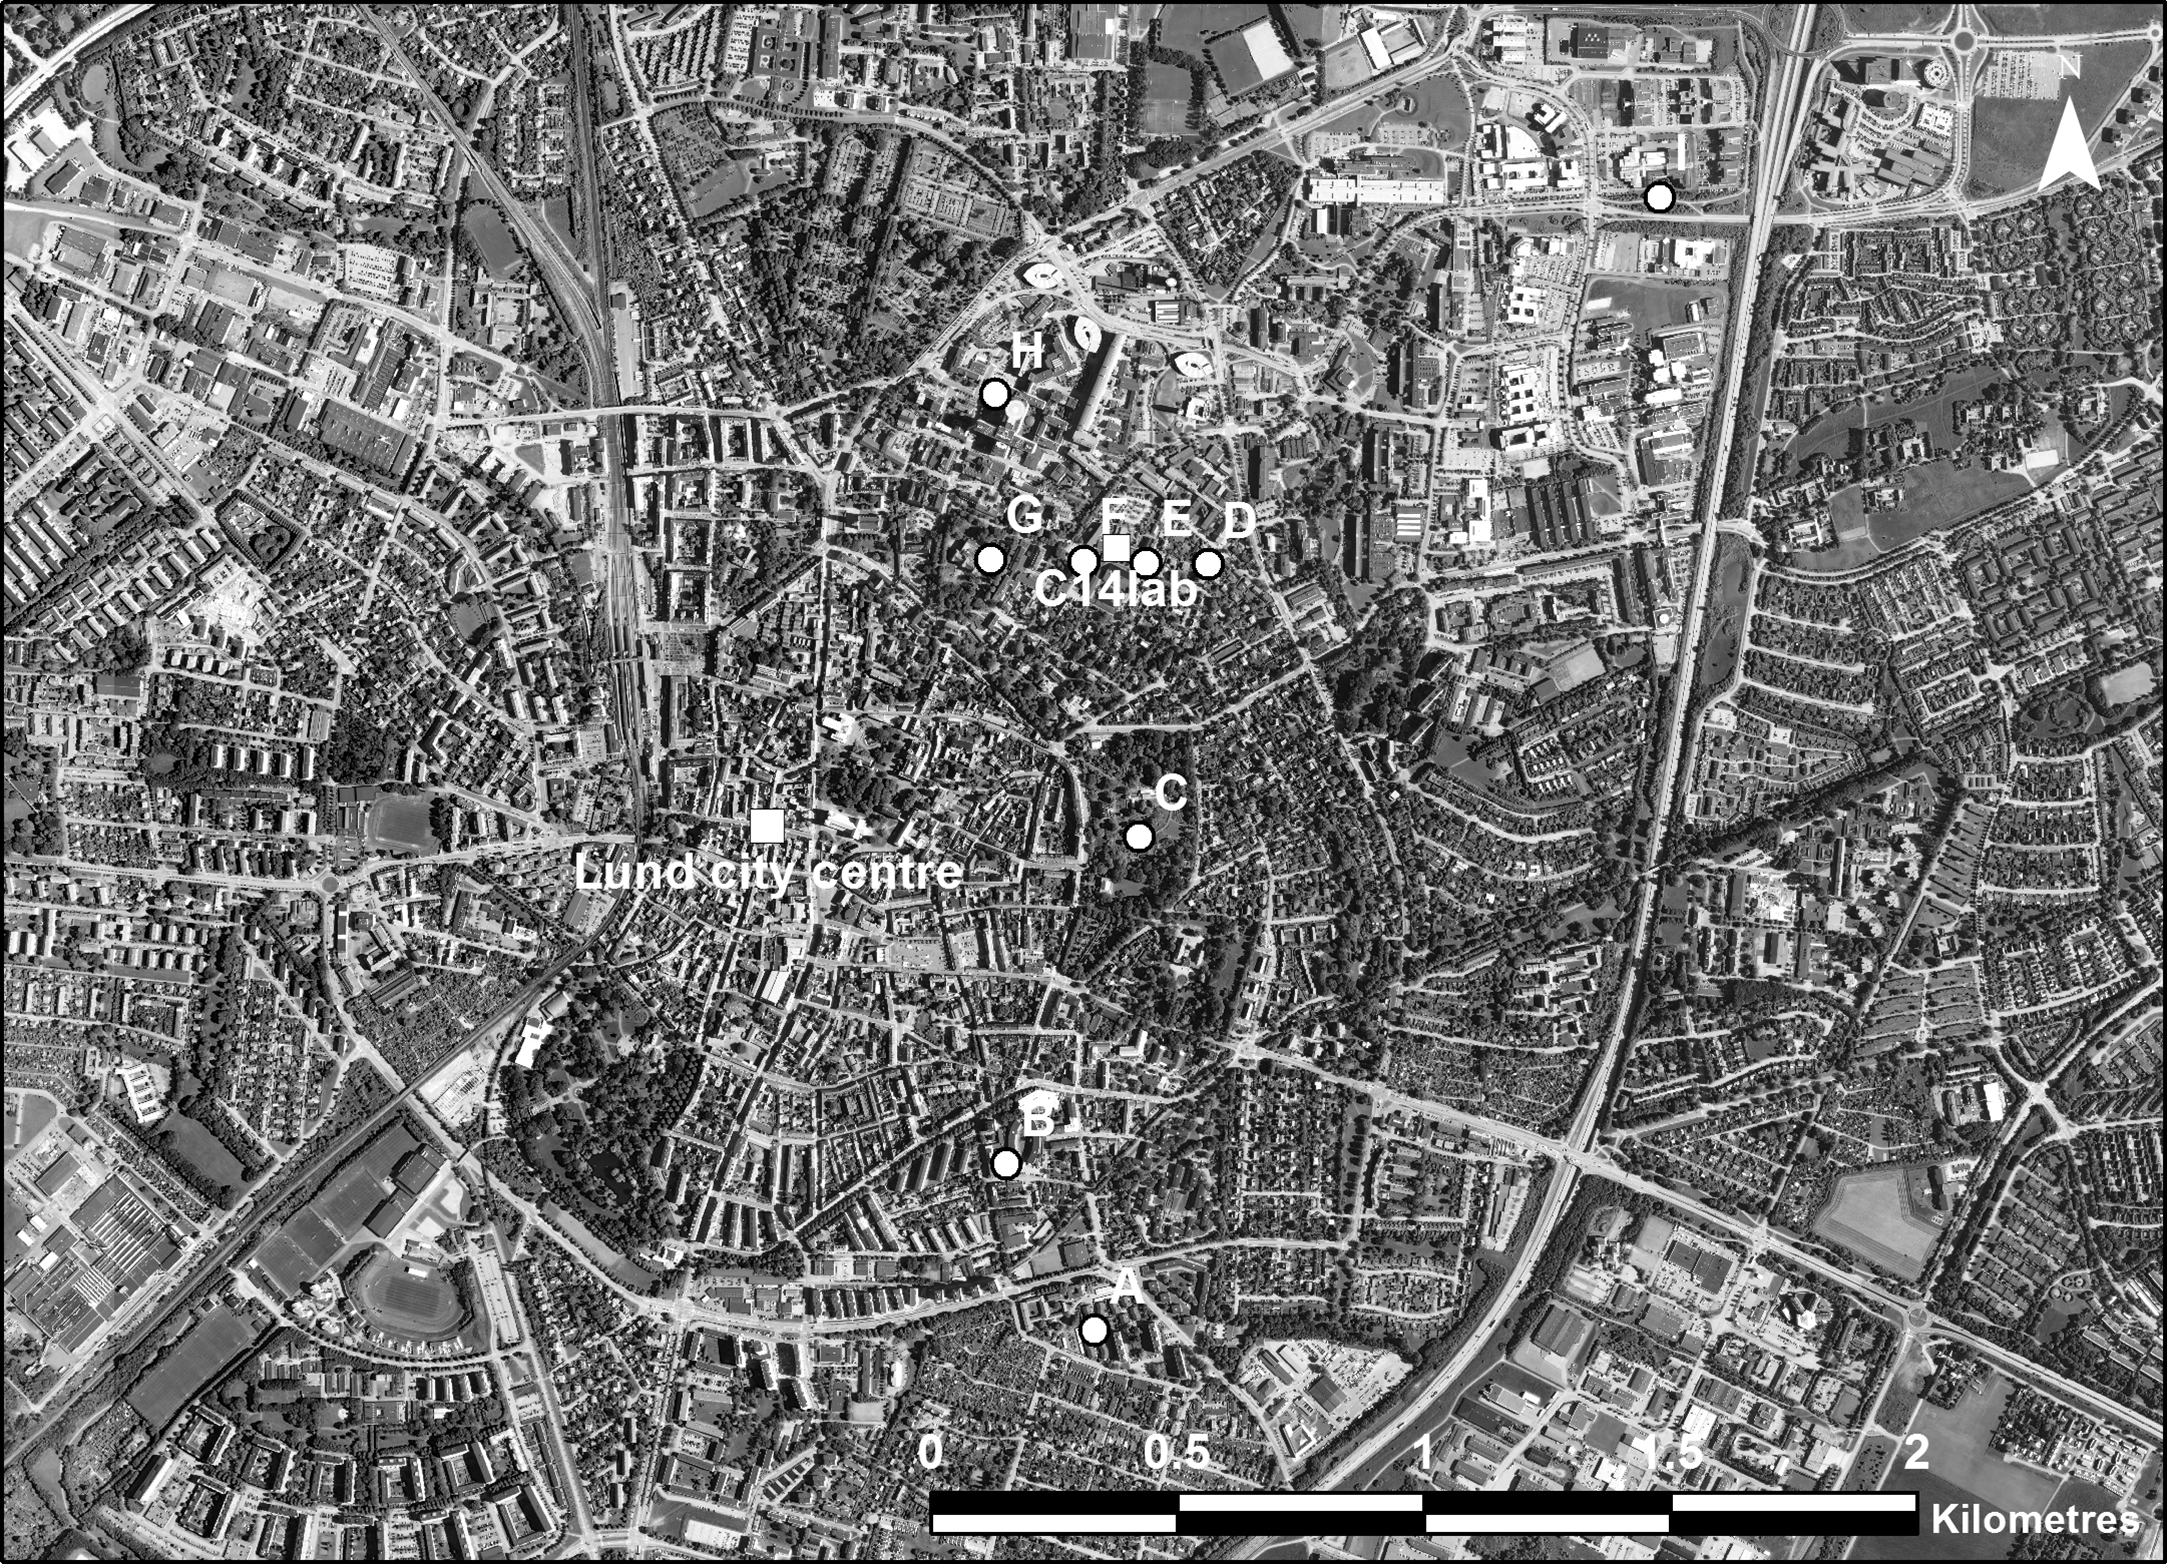
Figure 2 Sampling sites of horse-chestnut leaves in 2009 and annual growth rings from ash in 2010. (© Lantmäteriet, Dnr: I2014/00579.)
Detailed data for all the sites can be found in the Supplementary Material.
Prevailing Wind Direction
Data from the Malmö-Sturup Airport (26 km southeast of the ESS) for the years 2006–2012 show that the predominant winds in the region were westerly (on average 20% of the time) and southwesterly (17% of the time) (Ene Reference Ene2016). Other wind directions were less common (E: 15%, NW: 11%, S: 10%, SE: 10%, N: 6% and NE: 5%) (Ene Reference Ene2016). More detailed wind data for the ESS site for 2019 have been reported by Bernhardsson et al. (Reference Bernhardsson, Eriksson Stenström, Pedehontaa-Hiaa and Jönsson2020b): WSW (12.3% of the time, average wind speed 4.2 m/s), ESE (12.2%, 3.8 m/s), W (11.6%, 3.8 m/s) and SW (11.3%, 5.2 m/s). The small village of Östra Odarslöv is located ∼1.5 km ENE of the ESS, i.e., in the main downwind direction of the ESS (WSW). The wind direction is rarely NE from the ESS towards the densely populated areas of Lund SW of the facility (in 2019, winds from the NNE, NE, and ENE accounted for 1.7%, 3.2%, and 3.7% of the time, respectively) (Bernhardsson et al. Reference Bernhardsson, Eriksson Stenström, Pedehontaa-Hiaa and Jönsson2020b).
Sampling
For the ESS preoperational environmental monitoring starting in 2017, the types of samples and sampling frequency were selected with the IAEA recommendations (IAEA 2005) in mind, and considering that 14C mainly enters humans through ingestion (ICRP 2016). In 2017 annual growth rings of various coniferous trees (Picea abies, Abies sp., and Pinus sylvestris) were collected for retrospective assessment of 14C in the atmospheric CO2 using an increment borer (diameter 5 mm, length 250 mm) at sites 1, 6, and 13 (close to the ESS), the urban reference site 48 and the rural reference site 47 (see Figure 1). Sampling of grass, fruits, berries, moss, and milk has been described in detail elsewhere (Bernhardsson et al. Reference Bernhardsson, Eriksson Stenström, Jönsson, Mattsson, Pedehontaa-Hiaa, Rääf, Sundin and Waldner2018). The type of sample and frequency of sample collection varied over the years 2017–2020 (see Supplementary Material). For the studies of the contamination event in Lund, horse-chestnut leaves were collected in 2009 at sites A–H, and in 2010 annual growth ring samples were collected at breast height from a living ash tree using an increment borer at site I in Figure 2.
Sample Preparation
The wood samples collected from coniferous trees in 2017 for the ESS preoperational assessments were separated into individual years for the period 2012–2016. The growth ring material (approximately 15 mg of wood per sample), in the form of shavings, was first subjected to an alkali-acid pretreatment at the Lund Radiocarbon Dating Laboratory. The shavings were kept in 2% NaOH at 80°C for 5 hr, washed in distilled water, kept in 3% HCl at 80°C overnight and washed in distilled water. Cellulose extraction was then performed according to Stenström et al. (Reference Stenström, Skog, Thornberg, Erlandsson, Hellborg, Mattsson and Persson1997). Fruits and berries were cut into smaller pieces, and all samples except milk and honey, were dried in an oven as described previously (Bernhardsson et al. Reference Bernhardsson, Eriksson Stenström, Jönsson, Mattsson, Pedehontaa-Hiaa, Rääf, Sundin and Waldner2018). Milk was freeze-dried (Bernhardsson et al. Reference Bernhardsson, Eriksson Stenström, Jönsson, Mattsson, Pedehontaa-Hiaa, Rääf, Sundin and Waldner2018) and honey was graphitized without pretreatment. An AGE graphitization system (Wacker et al. Reference Wacker, Němec and Bourquin2010), including an elemental analyzer for sample combustion, was used to extract 1–2 mg of carbon from all samples collected after 2017 at the Radiocarbon Dating Laboratory. The horse-chestnut leaves collected in 2009 from site E (Figure 2) were subjected to base-acid (BA) pretreatment (0.5% NaOH and 1% HCl), while the other horse-chestnut leaf samples were not pretreated. The samples collected in 2009 (horse-chestnut leaves) and 2010 (annual growth ring samples from ash) were graphitized using an in-house graphitization system at the Radiocarbon Dating Laboratory (Hellborg and Skog Reference Hellborg and Skog2008). The graphite obtained from each sample, as well as standards and blanks, was pressed into aluminium sample holders.
Measurements and Data Analysis
The SSAMS facility at the Lund Radiocarbon Dating Laboratory was used to determine the 14C content of the carbon extracted from the samples (Skog Reference Skog2007; Skog et al. Reference Skog, Rundgren and Sköld2010). The background arising from sample preparation and the accelerator system was determined using graphitized fossil samples of anthracite (for the 2009 leaf samples) and Eemian oak wood (for all other samples). The standards used were IAEA C7, SRM 4990B (OxI), and SRM 4990C (OxII). The uncertainty of the measurements was <1%. Raw data were analyzed at the Lund Radiocarbon Dating Laboratory (Skog et al. Reference Skog, Rundgren and Sköld2010), and the results expressed in terms of F14C (Reimer et al. Reference Reimer, Brown and Reimer2004; Eriksson Stenström et al. Reference Eriksson Stenström, Skog, Georgiadou, Genberg and Johansson2011). In addition to the rural reference sites, Central European clean air CO2 data from Germany (Levin and Kromer Reference Levin and Kromer2004; Levin et al. Reference Levin, Kromer and Hammer2013; Hammer and Levin Reference Hammer and Levin2017; Conen et al. Reference Conen, Emmenegger, Leuenberger, Steger and Steinbacher2019) and Sweden (Hyltemossa (ICOS 2020)) were used for comparison. Statistical analysis (Grubb’s test to identify outliers, t-tests and ANOVA tests for normally distributed data and Mann Whitney tests for non-normally distributed data) was performed using the software OriginPro.
RESULTS AND DISCUSSION
Detailed data, including F14C for all the samples analyzed and the statistical analyses, are presented in the Supplementary Material.
Reference Data
The F14C in reference data from Måryd (vegetation) were compared with the average F14C in CO2 during the growing season (May–August) obtained from the Central European clean air CO2 data and the Hyltemossa CO2 data (see Figure 3). The declining trend in F14C seen in Figure 3 is partly the result of the atmosphere recovering from excess 14C resulting from the testing of nuclear weapons in the atmosphere in the late 1950s and early 1960s (bomb 14C). The ongoing increase in atmospheric CO2 concentration due to the combustion of fossil fuels also contributes to the decrease in F14C. The agreement between the data from Måryd and the Central European clean air CO2 data (average of May to August) is within 3 standard deviations (σ) of the analytical uncertainty of the Måryd data. The same applies to the Hyltemossa CO2 data. The mean F14C values in CO2 during each annual growing season obtained from the Hyltemossa data are similar to the Central European clean air CO2 data (see below), although regional (or local) differences can be observed in the biweekly data (see Figure 3). Differences in F14C may also arise from variations in the influence of soil respiration (Palonen et al. Reference Palonen, Pumpanen, Kulmala, Levin, Heinonsalo and Vesala2018). Bomb 14C stored in soil is now being released back into the atmosphere by the decomposition of dead biomass. Air close to the ground may thus have slightly higher F14C values than air at higher altitudes (Palonen et al. Reference Palonen, Pumpanen, Kulmala, Levin, Heinonsalo and Vesala2018). The ICOS Hyltemossa CO2, collected 150 m above ground level, may thus be less influenced by soil respiration than the Central European clean air CO2, which is collected closer to the ground. Consequently, terrestrial vegetation in southern Sweden may show slightly higher F14C values than CO2 collected at Hyltemossa.

Figure 3 F14C in samples from Måryd (Juncus), compared to Central European clean air CO2 data (Levin and Kromer Reference Levin and Kromer2004; Levin et al. Reference Levin, Kromer and Hammer2013; Hammer and Levin Reference Hammer and Levin2017; Conen et al. Reference Conen, Emmenegger, Leuenberger, Steger and Steinbacher2019) for the years 2006–2020, and data from the Swedish ICOS station at Hyltemossa during the years 2016–2019 (ICOS 2020). Error bars indicate 1 σ.
ESS Preoperational Assessments—Annual Growth Rings, 2012–2016
The analysis of annual growth rings from coniferous trees growing in Lund (sites 1, 6, and 13 located 0.5 km SSW, 1 km N and 1.7 km E of the ESS main stack, respectively—see Figure 1) for the period 2012–2016 show no elevated values of F14C compared to those from the urban and rural reference sites (sites 48 and 47, respectively—see Figure 1). F14C in the samples from the second rural reference site of this study (Juncus collected in Måryd) agree (within 2 σ) with all tree ring data on an annual basis. Additionally, the annual data from the rural reference site (site 47) on the southeast coast agreed (within 1 σ) with the Central European clean air CO2 data (average for May to August) and with the near-ESS sites 1, 6, and 13, as well as with the urban reference site in Lund (site 48). Thus, no significant emissions of 14C (in the form of CO2) were found at the Lund sites investigated during the period 2012–2016 (see Figure 4).

Figure 4 F14C in annual growth rings of trees sampled at five sites: a rural reference site (Borrby Strand, site 47 in Figure 1), and an urban reference site in Lund (site 48, in Figure 1) (open symbols) and three sites within 1.7 km of the ESS main stack (sites 1, 6, 13, Figure 1) (filled symbols). F14C data from the rural reference site at Måryd are also given (located ∼11 km east of Lund). Central European clean air CO2 data (May–August) are also included for comparison (Levin and Kromer Reference Levin and Kromer2004; Levin et al. Reference Levin, Kromer and Hammer2013; Hammer and Levin Reference Hammer and Levin2017; Conen et al. Reference Conen, Emmenegger, Leuenberger, Steger and Steinbacher2019). The uncertainty in the Central European CO2 data is the σ of monthly F14C data from May to August, while the uncertainty in the Swedish data is the analytical uncertainty (1 σ).
ESS Preoperational Assessments—Overview of All Samples, 2017–2020
In the ESS preoperational assessments, terrestrial organic material has been prioritized so far since the releases of 14C (and of other radionuclides) are mainly expected to be airborne. In general, in environmental monitoring of anthropogenic radioactivity, a suitable bioindicator should preferably enrich radionuclides, be representative of the surveyed area, be easily collected at sufficiently high amounts each year, remain in the area and/or be used as a foodstuff or be part of the human food chain (Wallberg and Moberg Reference Wallberg and Moberg2000). Enrichment is not expected for 14C dispersed as CO2. However, in designing an environmental monitoring programme it is preferable to identify kinds of samples that are relevant for many types of radionuclides, enabling subsampling for the analysis of several different radionuclides. Mosses and lichens are traditional terrestrial bioindicators known to highly concentrate some radionuclides and metals (Mattsson and Liden Reference Mattsson and Liden1975; Wallberg and Moberg Reference Wallberg and Moberg2000). In the ESS preoperational assessments, foodstuffs such as apples, pears, cereals and rapeseed, and materials representative of foodstuffs, such as grass and clover, have been analyzed. Milk is another important pathway for certain radionuclides (such as radioiodine) to enter humans, and 14C analyses of milk were therefore also included. Another matrix of relevance for dose assessments is meat from animals. Honey has the potential to be used as an environmental indicator providing information on the bees’ foraging area (several km2) (Herrero-Latorre et al. Reference Herrero-Latorre, Barciela-García, García-Martín and Peña-Crecente2017).
F14C values for all the samples analyzed within the ESS preoperational for the period 2017–2020 are summarised in Figure 5, apart from the results for samples of moss collected in 2017. Moss is discussed separately below. Also shown in the figure are data from Central European clean air CO2 as well as F14C in CO2 from the ICOS station in Hyltemossa. The results presented in Figure 5 are described in detail below.

Figure 5 F14C in samples collected in the ESS preoperational measurements for the period 2017–2020, compared with Central European clean air CO2 data (Levin and Kromer Reference Levin and Kromer2004; Levin et al. Reference Levin, Kromer and Hammer2013; Hammer and Levin Reference Hammer and Levin2017; Conen et al. Reference Conen, Emmenegger, Leuenberger, Steger and Steinbacher2019), and data from the Swedish ICOS station at Hyltemossa (ICOS 2020).
ESS Preoperational Assessments—2017
In addition to the retrospective assessment using tree rings (as discussed above), samples of grass, crops, fruits, and clover were also collected for 14C analysis in 2017. In total, 40 such samples were collected in June and in August. Sampling was performed around the ESS construction site, in the research-intense area in northeastern Lund, as well as at the rural and urban reference sites (sites 47 and 48). No evidence of 14C contamination was seen in the northeastern part of Lund where there are several potential sources of emission of 14C (sites 45, 52–56, see Figure 1). The median value of F14C in fruits and berries collected at these sites in August 2017 was not significantly different from that in crops, fruits, berries, and clover collected around the ESS, and at the urban and rural reference sites (Mann-Whitney test at the 0.05 level).
For the grass samples collected in 2017 (N=14), one outlier was identified using Grubb’s test (grass collected in August in a field at the dairy farm at site 22, see Figures 1 and 6). When this outlier was removed, the mean value of F14C in the grass samples (N=13) was not statistically different (two-sample t-test at the 0.05 level) from the corresponding average value combined for crops, fruits, berries, and clover grown in 2017 (N=21).

Figure 6 F14C in samples collected at the dairy farm at site 22, comparing the levels in milk to that in the diet of the cows. The dotted line indicates the 2017 summer mean (May–August) of Central European clean air CO2 data (Levin and Kromer Reference Levin and Kromer2004; Levin et al. Reference Levin, Kromer and Hammer2013; Hammer and Levin Reference Hammer and Levin2017; Conen et al. Reference Conen, Emmenegger, Leuenberger, Steger and Steinbacher2019) and of CO2 collected at the Swedish ICOS station in Hyltemossa (ICOS 2020) (F14C=1.015 for both data sets). According to Grubb’s test, the result for the grass sample in August is an outlier.
A more detailed investigation was conducted at the dairy farm at site 22, in which samples of milk, as well as grass, fodder and silage on which the cows were fed, were analyzed. As can be seen in Figure 6, the level of F14C in the milk reflects the diet very well, when excluding the grass sample from August as an outlier.
The mean value of F14C for all the materials that were grown or produced (milk) during 2017 (N=36, excluding the grass outlier) was 1.017 (σ: 0.005; standard uncertainty of the mean (SUM): 0.001). The mean value of the Central European clean air CO2 data for the period May to August was 1.016 (σ: 0.002; SUM: 0.001). The mean value of the ICOS Hyltemossa CO2 data was 1.016 (σ: 0.002; SUM: 0.001). The mean values of these three data series were not significantly different (one-way ANOVA at the 0.05 level).
ESS Preoperational Assessments—2018 and 2019
Grass (N=10) as well as crops, fruits, and berries (N=10) were collected in August and September 2018 (see Figure 5). These kinds of samples were collected at the urban and rural reference sites (sites 47 and 48), and at various sites near the ESS. In the NE part of Lund where there are potential sources of emission of 14C, rowan berries (Sorbus aucuparia) were sampled at two locations (sites 52 and 54). The average values of F14C were found to be the same for grass, crops, fruits, and berries: 1.016 (σ grass: 0.004; σ crops, fruits, and berries: 0.002; SUM for both categories: 0.001). According to one-way ANOVA analysis, this is statistically significantly different (at the 0.05 level) from the mean of Central European clean air CO2 data (F14C=1.012) and the Hyltemossa CO2 data (F14C=1.011; σ for values from both sites: 0.002; standard uncertainties of the mean for both sites: 0.001). In relative terms, the observed increase in F14C for the vegetation samples from 2018 analyzed in this study compared to F14C in the clean air CO2 data sets is <0.5%, i.e., very modest. This small increase in F14C cannot be seen when comparing urban vegetation data (Lund) with rural vegetation data (outside Lund). The two samples analyzed in the area in Lund with potential 14C sources were very close (F14C=1.017 ± 0.006 for both) to the overall average of 1.016.
In 2019, 2 grass samples and 6 samples of fruits/berries were collected between the end of August and the beginning of October. The mean value of F14C for all these samples was 1.011 (σ: 0.004; SUM 0.001). The F14C values of two samples of rowan berries collected close to potential 14C sources (sites 52 and 54, i.e., the same sites as in 2018) were similar to those in other samples collected. The mean value of F14C calculated from the ICOS data from Hyltemossa for May to August was 1.007 (σ: 0.003; SUM 0.001), which is slightly lower (<0.5%) than the mean value obtained for the grass and fruit/berry samples (p < 0.05 in the two-sample t-test). This difference may be attributed to a lower influence from soil respiration at ICOS Hyltemossa (CO2 samples collected 150 m above ground) than for the grass and vegetation samples.
ESS Preoperational Assessments—2020
In 2020, samples of grass, fruits, crops, milk, honey, and meat were analyzed to determine their 14C content. Grass was collected at the same sites (6, 27.3, 30 and 60) in May, August/September and November to investigate seasonal variations. Milk was sampled at site 64 in May and November, while fruits, berries and crops were collected at normal harvest times. Honey was sampled in August (site 2). The mean value of F14C for all the samples was 1.009 (σ: 0.004; SUM 0.001). Honey and meat (not analyzed in previous years) showed expected values of F14C in the same range as the rest of the samples. There is thus no evidence of any local 14C contamination in Lund in 2020.
Seasonal variations, showing higher F14C values in the summer than in winter, in the Central European and Hyltemossa CO2 data were also seen in the data for terrestrial organic material for 2020 (see Figure 5). The mean F14C values for the 3 sampling occasions (May, August/September and November) were significantly different (ANOVA test at the 0.05 level), with higher values of F14C in the summer months of August and September than before or after (see Figure 5).
Moss Samples
In 2017, the suitability of moss for 14C analyses in environmental monitoring was investigated as it is known to concentrate, for example, metals. Moss (Brachythecium rutabulum, Rhythidiadelphus squarrosus, Hypnum cupressiforme, Orthotrichum sp., and Pseudoscleropodium purum) was sampled at 12 of the sites where grass samples were collected. The sampled mosses were collected from stones, soil, sandy lawns and trees, and the length of the moss stems varied between 2 and 9 cm. Two moss samples, both collected at the rural reference site 47 (Borrby Strand) were divided into fractions to investigate whether the lower (older) parts of the moss exhibited higher F14C values as an effect of the long-term 14C decrease following the “bomb pulse”. One of these moss samples was divided into 2 layers (of 3 cm each) and the other into 3 parts (of 3 cm each). The full length of a moss stem was also analyzed in the first moss sample. No statistically significant differences were seen between the different layers of moss (although the consistent F14C patterns of samples A and B from site 47 may indicate that the lower parts are older than the upper parts), as shown in Figure 7. No statistically significant correlation was found between F14C and the length of the moss stem in the samples in which the whole length was analyzed. The average value of F14C for all the moss samples was 1.017 (σ: 0.007; SUM: 0.002), and for grass 1.015 (σ: 0.004; SUM: 0.001). The means of the moss and the grass samples are not statistically different, according to the two-sample t-test (at the 0.05 level). Our findings are in accordance with a previous report that the green parts of various mosses usually have an age of a few years or less (Pakarinen and Rinne Reference Pakarinen and Rinne1979).

Figure 7 F14C in moss and grass samples collected in southern Sweden in 2017. Moss sample A at site 47 was divided into the upper (U) and lower (L) 3 cm. Moss sample B at site 47 was divided into the upper (U), middle (M) and lower (L) 3 cm.
The results show that moss samples provide the same information on 14C from atmospheric CO2 as grass samples. One drawback of moss samples may be that the age of the moss is more difficult to estimate than for grass. On the other hand, previous studies have indicated that moss samples collected close to a nuclear reactor show significantly higher F14C values than other terrestrial material (Magnusson et al. Reference Magnusson, Stenström, Skog, Adliene, Adlys, Hellborg, Olariu, Zakaria, Rääf and Mattsson2004, Reference Magnusson, Stenström, Adliene, Adlys, Dias, Rääf, Skog, Zakaria and Mattsson2007), which may indicate that mosses trap and retain 14C emitted in certain physical or chemical forms more efficiently.
The Contamination Event Detected in 2009
The highest F14C value observed in the series of horse-chestnut leaves that were analyzed following the event in April 2009 (when blank graphite samples unexpectedly showed contamination during an SSAMS run) was ∼25% above that for Central European clean air CO2 (data from Måryd are lacking for 2009). This maximum in F14C was found at site D, located ∼200 m east of the Department of Geology, which hosts the Lund Radiocarbon Dating Laboratory and the SSAMS facility (see Figure 2). However, the spatial variability was very high (see Figure 8). For example, the value at site F (∼260 m from site D), close to the Department of Geology, was only ∼7% above the Central European clean air CO2 level, while the sample from site E (only ∼130 m from site D with the maximum value of F14C), also located in the immediate vicinity of the Department of Geology, showed an F14C level close to that of clean air CO2. However, the last sample was subjected to BA pretreatment, which may have removed any surface contamination. The F14C value at site A, 1.6 km south of the Department of Geology was indistinguishable from the value for central European clean air CO2.

Figure 8 F14C in horse-chestnut leaves collected in Lund in June 2009. Central European clean air CO2 data are shown for comparison. The uncertainty in the Central European clean air CO2 data is the standard deviation of monthly F14C data from May to August (N=4), while the uncertainty in the Swedish data is the analytical uncertainty (1 σ). The sample from site E was subjected to BA pretreatment prior to graphitization, while the other samples were not.
As mentioned in the introduction, further investigations using fullerene soot monitors, as described by Bernhardsson et al. (Reference Bernhardsson, Eriksson Stenström, Jönsson, Mattsson, Pedehontaa-Hiaa, Rääf, Sundin and Waldner2018), indicated that the source of contamination was in the research-intense area located NE of the Department of Geology. The maximum F14C value found in the annual growth rings from the ash tree at site I (Figure 2) was found for 2007, i.e., 2 years prior to the discovery of the contamination in April 2009. This maximum excess F14C amounted to ∼18% above the rural reference value at Måryd (Figure 9). The value of F14C in the growth ring from 2009 (when the contamination was detected at the Radiocarbon Dating Laboratory) is close to that of clean air CO2. However, the degree of contamination in annual growth rings may not be comparable to that in or on the leaves of trees. Surface contamination of leaves by 14C-labeled substances might not be efficiently transferred to the inner part of the tree trunk. Furthermore, the chemical form of the 14C contamination may have changed with time, depending on specific activities in the research-intense area. If 14C was predominantly released as CO2 in 2007, this would have been seen in the annual growth ring for that year; whereas if 14C was released in some other chemical form in 2009, it might not be detected by analysis of the annual growth ring, but only through analysis of the leaves.

Figure 9 Radiocarbon data for annual growth rings from a living ash for the period 2006–2010 collected in the research-intense area in Lund in 2011, together with F14C in Juncus collected at the rural reference site at Måryd (∼11 km east of Lund) and Central European clean air CO2 data.
CONCLUSIONS
Preoperational assessments of 14C in various environmental samples in the vicinity of the ESS for the period 2012–2020 show no evidence of any significant local contamination of 14C in the Lund area arising from work- or research-related use of 14C. However, local contamination in the research-intense NE area of Lund was observed in the period 2007–2009, with a maximum observed excess F14C of ∼25% (above rural F14C) in horse-chestnut leaves collected close to the Lund Radiocarbon Dating Laboratory in Lund in 2009. This contamination event would not have been detected if the blank graphite samples measured at the SSAMS facility had not been affected. Only the surface of pressed graphite samples was affected by the contamination, and the introduction of new laboratory routines involving the storage of pressed graphite samples in an argon atmosphere in airtight containers has eliminated potential problems associated with airborne contamination. The probable source of contamination was identified, and action was taken to prevent the release of 14C to the surroundings. However, this event demonstrates the need for monitoring. Since 14C is a highly bioavailable radionuclide of dosimetric relevance, it is important not only to monitor the radiological situation inside workplaces in which 14C-labeled substances are handled, but environmental measurements should also be performed to ensure that waste is properly dealt with. The studies reported here clearly demonstrate the importance of thorough preoperational studies of 14C and other radionuclides prior to commissioning new nuclear or radiation-related facilities, in order to enable appropriate source apportionment during the operational phase.
ACKNOWLEDGMENTS
The measurements around the ESS were financed by the ESS under the Collaboration Agreement ESS-0093013 and Framework Agreement ESS-2702700. We thank Professor Bent Odegaard, Aarhus University, Denmark, for his assistance in identifying the moss species.
Supplementary material
To view supplementary material for this article, please visit https://doi.org/10.1017/RDC.2022.2


 Open access