


1. Introduction
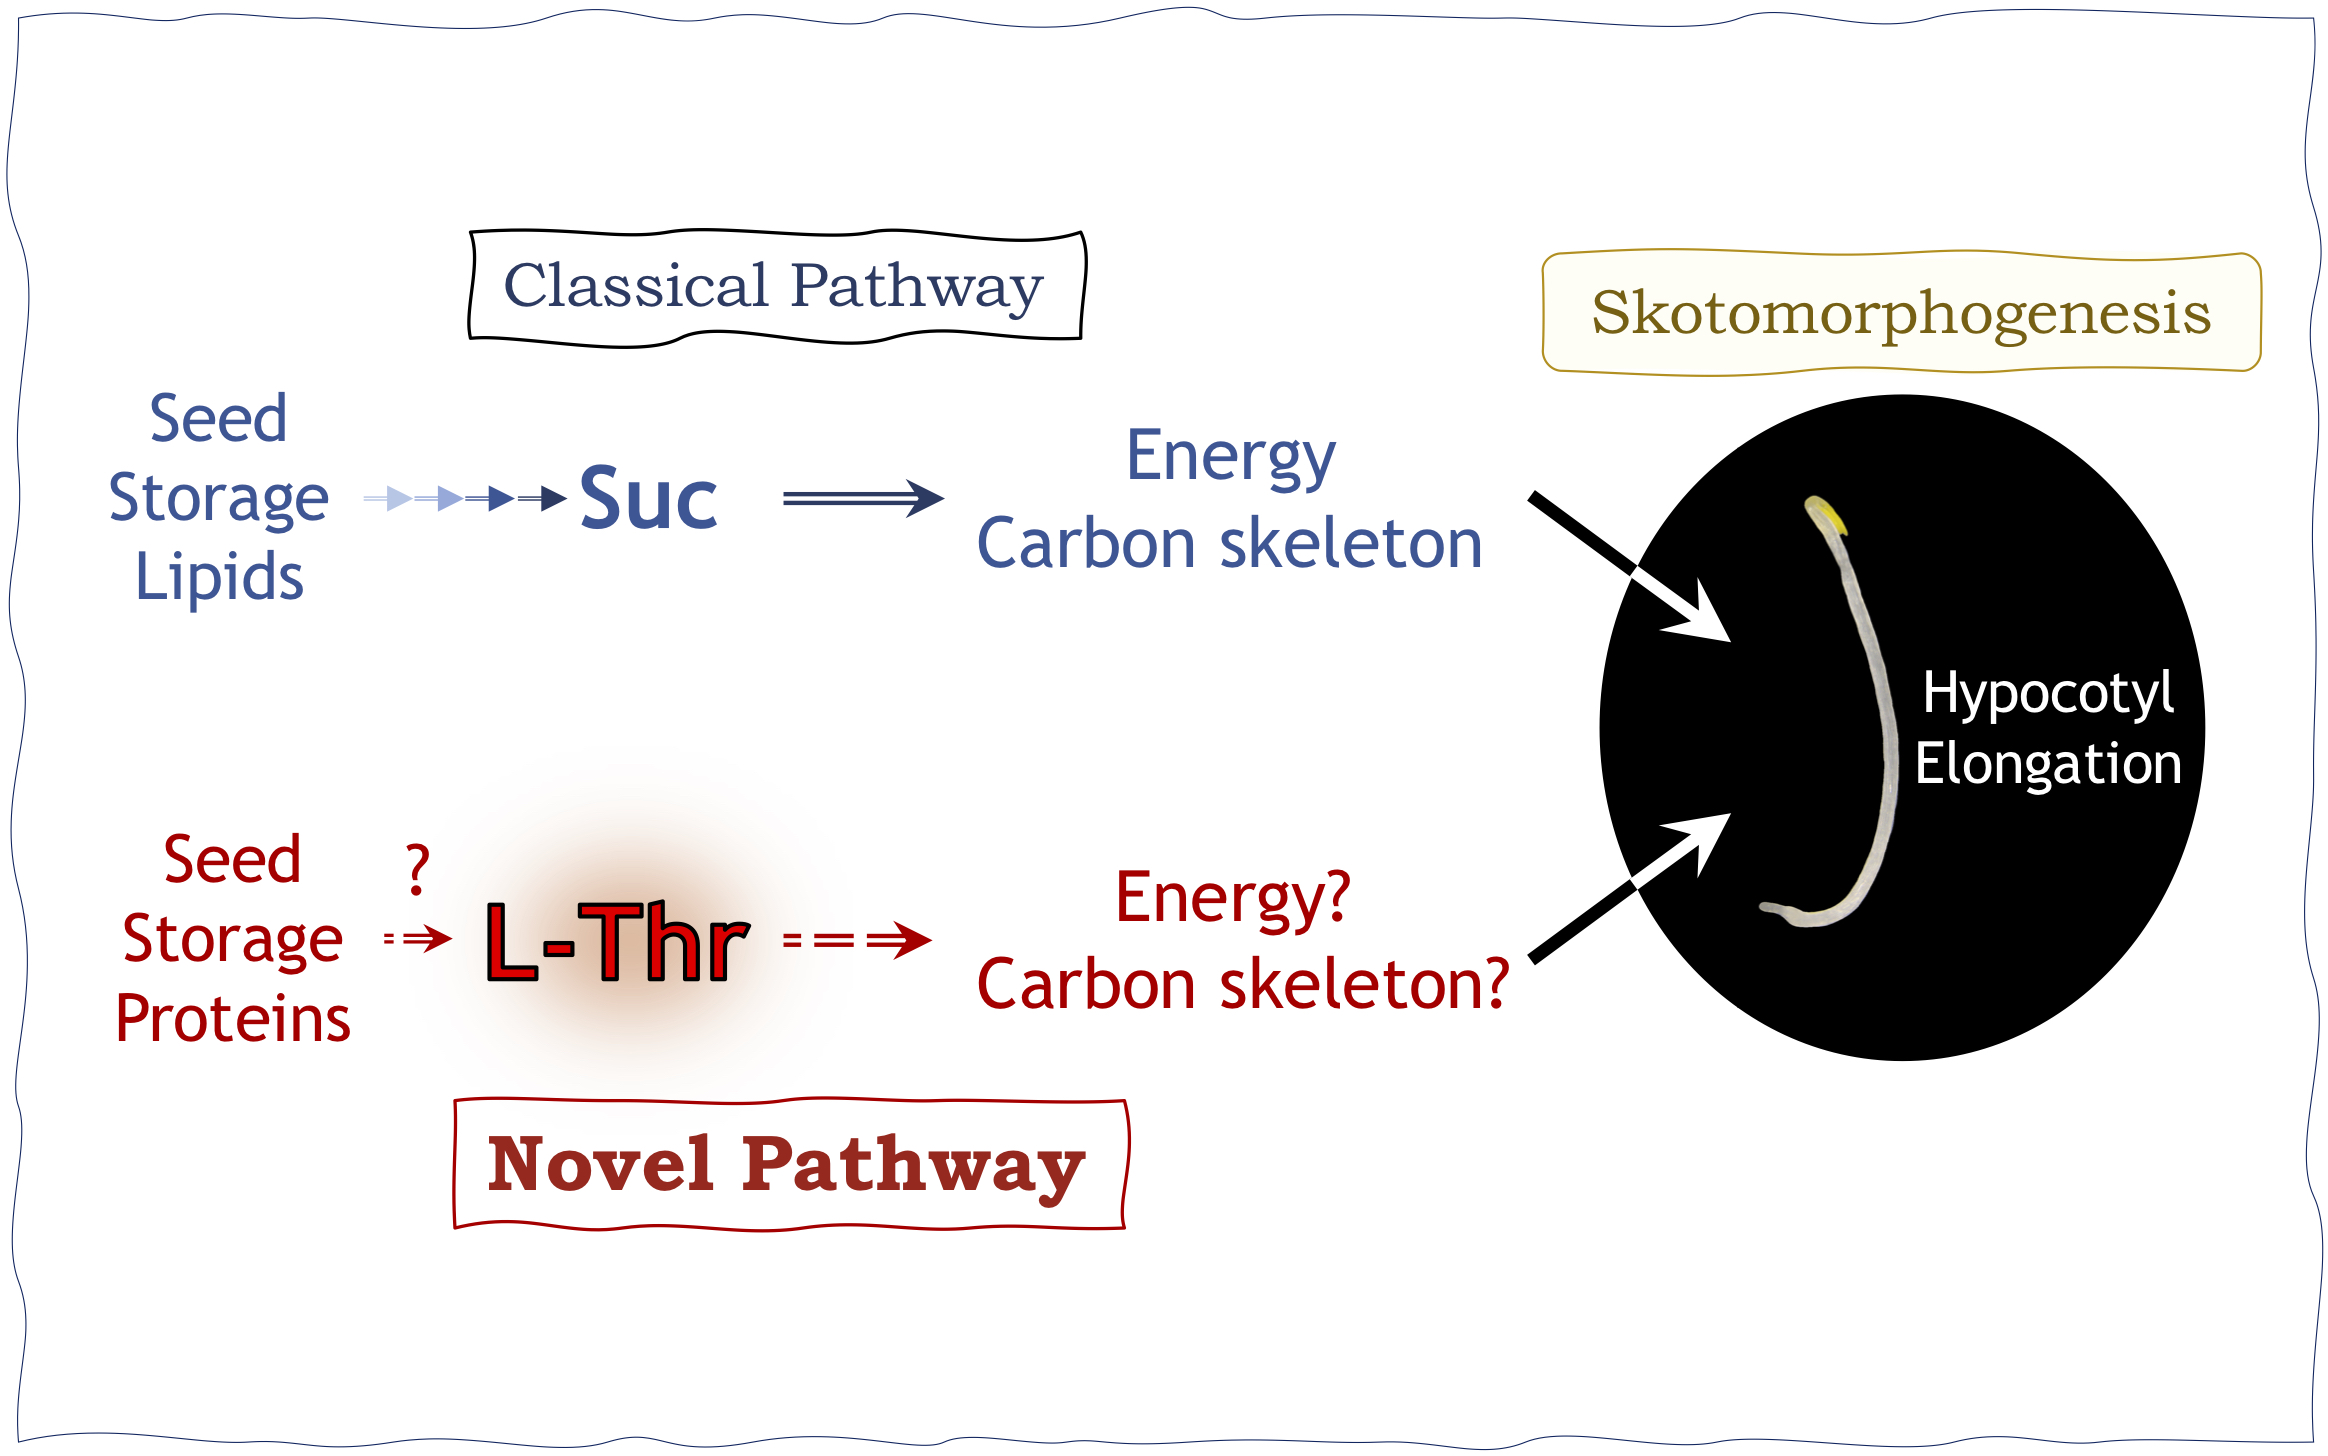
Seedling establishment is an important event in the plant life cycle, orchestrated by transcription factors and enzymes and sustained by a number of low molecular weight compounds. The regulation of hypocotyl development during germination is a complex process, in which many factors must be coordinated temporally and spatially. In Arabidopsis thaliana (Arabidopsis, hereafter), sucrose (Suc) is synthesised from the triacylglycerol (TAG) of the oil bodies via a sequence of metabolic reactions including core β-oxidation, glyoxylate and TCA cycles, and cytosolic gluconeogenesis, and Suc is used to replenish energy supply during seedling development (Graham, Reference Graham2008).
In a process called lipolysis, SUGAR DEPENDENT1 splits TAG into glycerol and free fatty acids (FAs), which are transported into peroxisomes by the PEROXISOMAL ABC TRANSPORTER 1, where they bind CoA and undergo degradation in the β-oxidation cycle (Eastmond, Reference Eastmond2006; Fulda et al., Reference Fulda, Schnurr, Abbadi, Heinz and Browse2004; Hu et al., Reference Hu, Baker, Bartel, Linka, Mullen, Reumann and Zolman2012). The latter represents a relatively early step in the TAG-to-Suc conversion. A number of loss-of-function mutants defective in this process, such as ped1, are unviable unless supplied with an exogenous carbon source, indicating that seedling establishment in Arabidopsis depends on the above metabolic process before photosynthetic capacity is acquired (Germain et al., Reference Germain, Rylott, Larson, Sherson, Bechtold, Carde, Bryce, Graham and Smith2001; Graham, Reference Graham2008; Hayashi et al., Reference Hayashi, Toriyama, Kondo and Nishimura1998).
Mutations in enzymes catalysing TAG-to-Suc conversion often result in etiolated seedlings with short hypocotyls. More specifically, ISOCITRATE LYASE (ICL; Eastmond et al., Reference Eastmond, Germain, Lange, Bryce, Smith and Graham2000) and MALATE SYNTHASE (MLS; Cornah et al., Reference Cornah, Germain, Ward, Beale and Smith2004) play important roles in the glyoxylate cycle. In addition, PHOSPHOENOLPYRUVATE CARBOXYKINASE1 (PCK1; Penfield et al., Reference Penfield, Rylott, Gilday, Graham, Larson and Graham2004) and, more recently, the vacuolar H+-PPase/FUGU5/AVP1 (Ferjani et al., Reference Ferjani, Segami, Horiguchi, Muto, Maeshima and Tsukaya2011) were reported to be involved in gluconeogenesis. Collectively, genetic contexts with a molecular lesion in one of the above genes ultimately produce less Suc from TAG during seed germination (Cornah et al., Reference Cornah, Germain, Ward, Beale and Smith2004; Eastmond et al., Reference Eastmond, Germain, Lange, Bryce, Smith and Graham2000; Ferjani et al., Reference Ferjani, Segami, Horiguchi, Muto, Maeshima and Tsukaya2011; Penfield et al., Reference Penfield, Rylott, Gilday, Graham, Larson and Graham2004; Takahashi et al., Reference Takahashi, Morimoto, Tabeta, Asaoka, Ishida, Maeshima, Tsukaya and Ferjani2017). For instance, whereas icl-2, mls-2, pck1-2 and fugu5-1 mutants exhibit dissimilar metabolic perturbations, albeit with variable penetrance (Ferjani et al., Reference Ferjani, Kawade, Asaoka, Oikawa, Okada, Mochizuki, Maeshima, Hirai, Saito and Tsukaya2018), they share a phenotypic signature, that is, a short hypocotyl in the dark (Ferjani et al., Reference Ferjani, Segami, Horiguchi, Muto, Maeshima and Tsukaya2011; Takahashi et al., Reference Takahashi, Morimoto, Tabeta, Asaoka, Ishida, Maeshima, Tsukaya and Ferjani2017).
A metabolic disorder in TAG-to-Suc conversion concomitant with lowered Suc levels triggers Class II compensation in cotyledons (Takahashi et al., Reference Takahashi, Morimoto, Tabeta, Asaoka, Ishida, Maeshima, Tsukaya and Ferjani2017). Compensation is a phenotype whereby decreased cell numbers in determinate organs, such as cotyledons and leaves, trigger a cell size increase (Ferjani et al., Reference Ferjani, Horiguchi, Yano and Tsukaya2007; Horiguchi et al., Reference Horiguchi, Ferjani, Fujikura and Tsukaya2006; Horiguchi & Tsukaya, Reference Horiguchi and Tsukaya2011; Tsukaya, Reference Tsukaya2002; Reference Tsukaya2008). Therefore, low Suc production often results in reduced cell proliferation activity and thus a reduced cell number in cotyledons due to a low energy state. Importantly, we discovered that indole-3-butyric acid (IBA) response 10 mutants (ibr10-1; Zolman et al., Reference Zolman, Martinez, Millius, Adham and Bartel2008; ibr10-2; Tabeta et al., Reference Tabeta, Watanabe, Fukuda, Gunji, Asaoka, Hirai, Seo, Tsukaya and Ferjani2021) also exhibit Class II compensation. Together with IBR1 and IBR3, IBR10 is involved in the conversion of IBA to indole-3-acetic acid (IAA), and the tuning of auxin homeostasis (Frick & Strader, Reference Frick and Strader2018; Korasick et al., Reference Korasick, Enders and Strader2013; Spiess et al., Reference Spiess, Hausman, Yu, Cohen, Rampey and Zolman2014; Strader et al., Reference Strader, Wheeler, Christensen, Berens, Cohen, Rampey and Bartel2011; Zolman et al., Reference Zolman, Nyberg and Bartel2007; Reference Zolman, Martinez, Millius, Adham and Bartel2008).
Previous studies suggested that the above IBR enzymes catalyse conversion of IBA-CoA to IAA-CoA in a metabolic process resembling peroxisomal β-oxidation and proposed that they are not dedicated to the production of Suc from TAG (Strader et al., Reference Strader, Wheeler, Christensen, Berens, Cohen, Rampey and Bartel2011). While ibr10 exhibited Class II compensation, ibr1-2 and ibr3-1 mutants did not show cell number reduction or compensated cell enlargement in cotyledons (Tabeta et al., Reference Tabeta, Watanabe, Fukuda, Gunji, Asaoka, Hirai, Seo, Tsukaya and Ferjani2021; Takahashi et al., Reference Takahashi, Morimoto, Tabeta, Asaoka, Ishida, Maeshima, Tsukaya and Ferjani2017). Altogether, the above findings suggest a previously unrecognised role of IBR10 in TAG mobilisation, functionally distinct from IBR1 and IBR3 during seedling establishment.
To date, the short hypocotyl phenotype has been ascribed to lowered Suc production during seed germination (Graham, Reference Graham2008; Strader et al., Reference Strader, Wheeler, Christensen, Berens, Cohen, Rampey and Bartel2011). While mutants with defects in TAG-to-Suc conversion display short hypocotyls due to limited Suc availability (Cornah et al., Reference Cornah, Germain, Ward, Beale and Smith2004; Eastmond et al., Reference Eastmond, Germain, Lange, Bryce, Smith and Graham2000; Ferjani et al., Reference Ferjani, Segami, Horiguchi, Muto, Maeshima and Tsukaya2011; Penfield et al., Reference Penfield, Rylott, Gilday, Graham, Larson and Graham2004), hypocotyl elongation of ibr10 etiolated seedlings was unaffected despite a 40% reduction in Suc content compared with the wild type (WT) (Tabeta et al., Reference Tabeta, Watanabe, Fukuda, Gunji, Asaoka, Hirai, Seo, Tsukaya and Ferjani2021). This counter-intuitive phenotype suggests that the length of hypocotyls does not necessarily reflect endogenous Suc content, suggesting the presence of other compounds involved in the regulation of this complex trait.
Discrepancy among ibr10 and other related mutant phenotypes has led to reconsideration of the physiological function of Suc in seedling establishment (Henninger et al., Reference Henninger, Pedrotti, Krischke, Draken, Wildenhain, Fekete, Rolland, Müller, Fröschel, Weiste and Dröge-Laser2021; Silva et al., Reference Silva, Ligterink and Hilhorst2017). This study, in which a multi-platform metabolome analysis combined with bioinformatics approaches was adopted to unveil the function of IBR10, attempts to tackle this long-standing debate.
2. Results
2.1. ibr10 mutants exhibit significant metabolic changes compared with ibr1 and ibr3
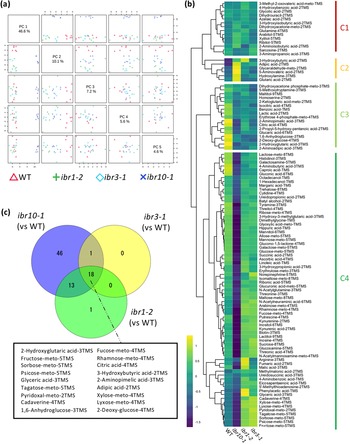
To address the above question, we performed a wide-target metabolome analysis using gas chromatography–tandem mass spectrometry (GC-QqQ-MS) to assess whether metabolic profiles differ among the ibr mutants. To visualise the extent of metabolic changes, we performed principal component analysis (PCA). Our results revealed that while ibr10-1 was significantly separated compared with the two other ibr mutant counterparts in PC1 (46.6%) (Figure 1a), the WT was slightly separated in PC2 (10.1%) and other PC axis combinations (Figure 1a). Interestingly, ibr1-2 and ibr3-1 displayed the same behaviour in all PC axis combinations, indicating that these two mutants share common metabolic profiles (Figure 1a). To explore the metabolome data and typical metabolite deviation, we performed hierarchical clustering analysis (HCA) and categorised four different clusters (C1–C4). Consistently, HCA indicated that ibr1-2 and ibr3-1 had no obvious metabolic changes (Figure 1b). Interestingly, the largest cluster, C4, was enriched with sugars and organic acids, the amounts of which were significantly inferior in ibr10-1 compared with the WT (Figure 1b; Supplemental Table S1). Note that a similar trend was observed for some amino acids detected by GC-QqQ-MS (Supplemental Table S1).
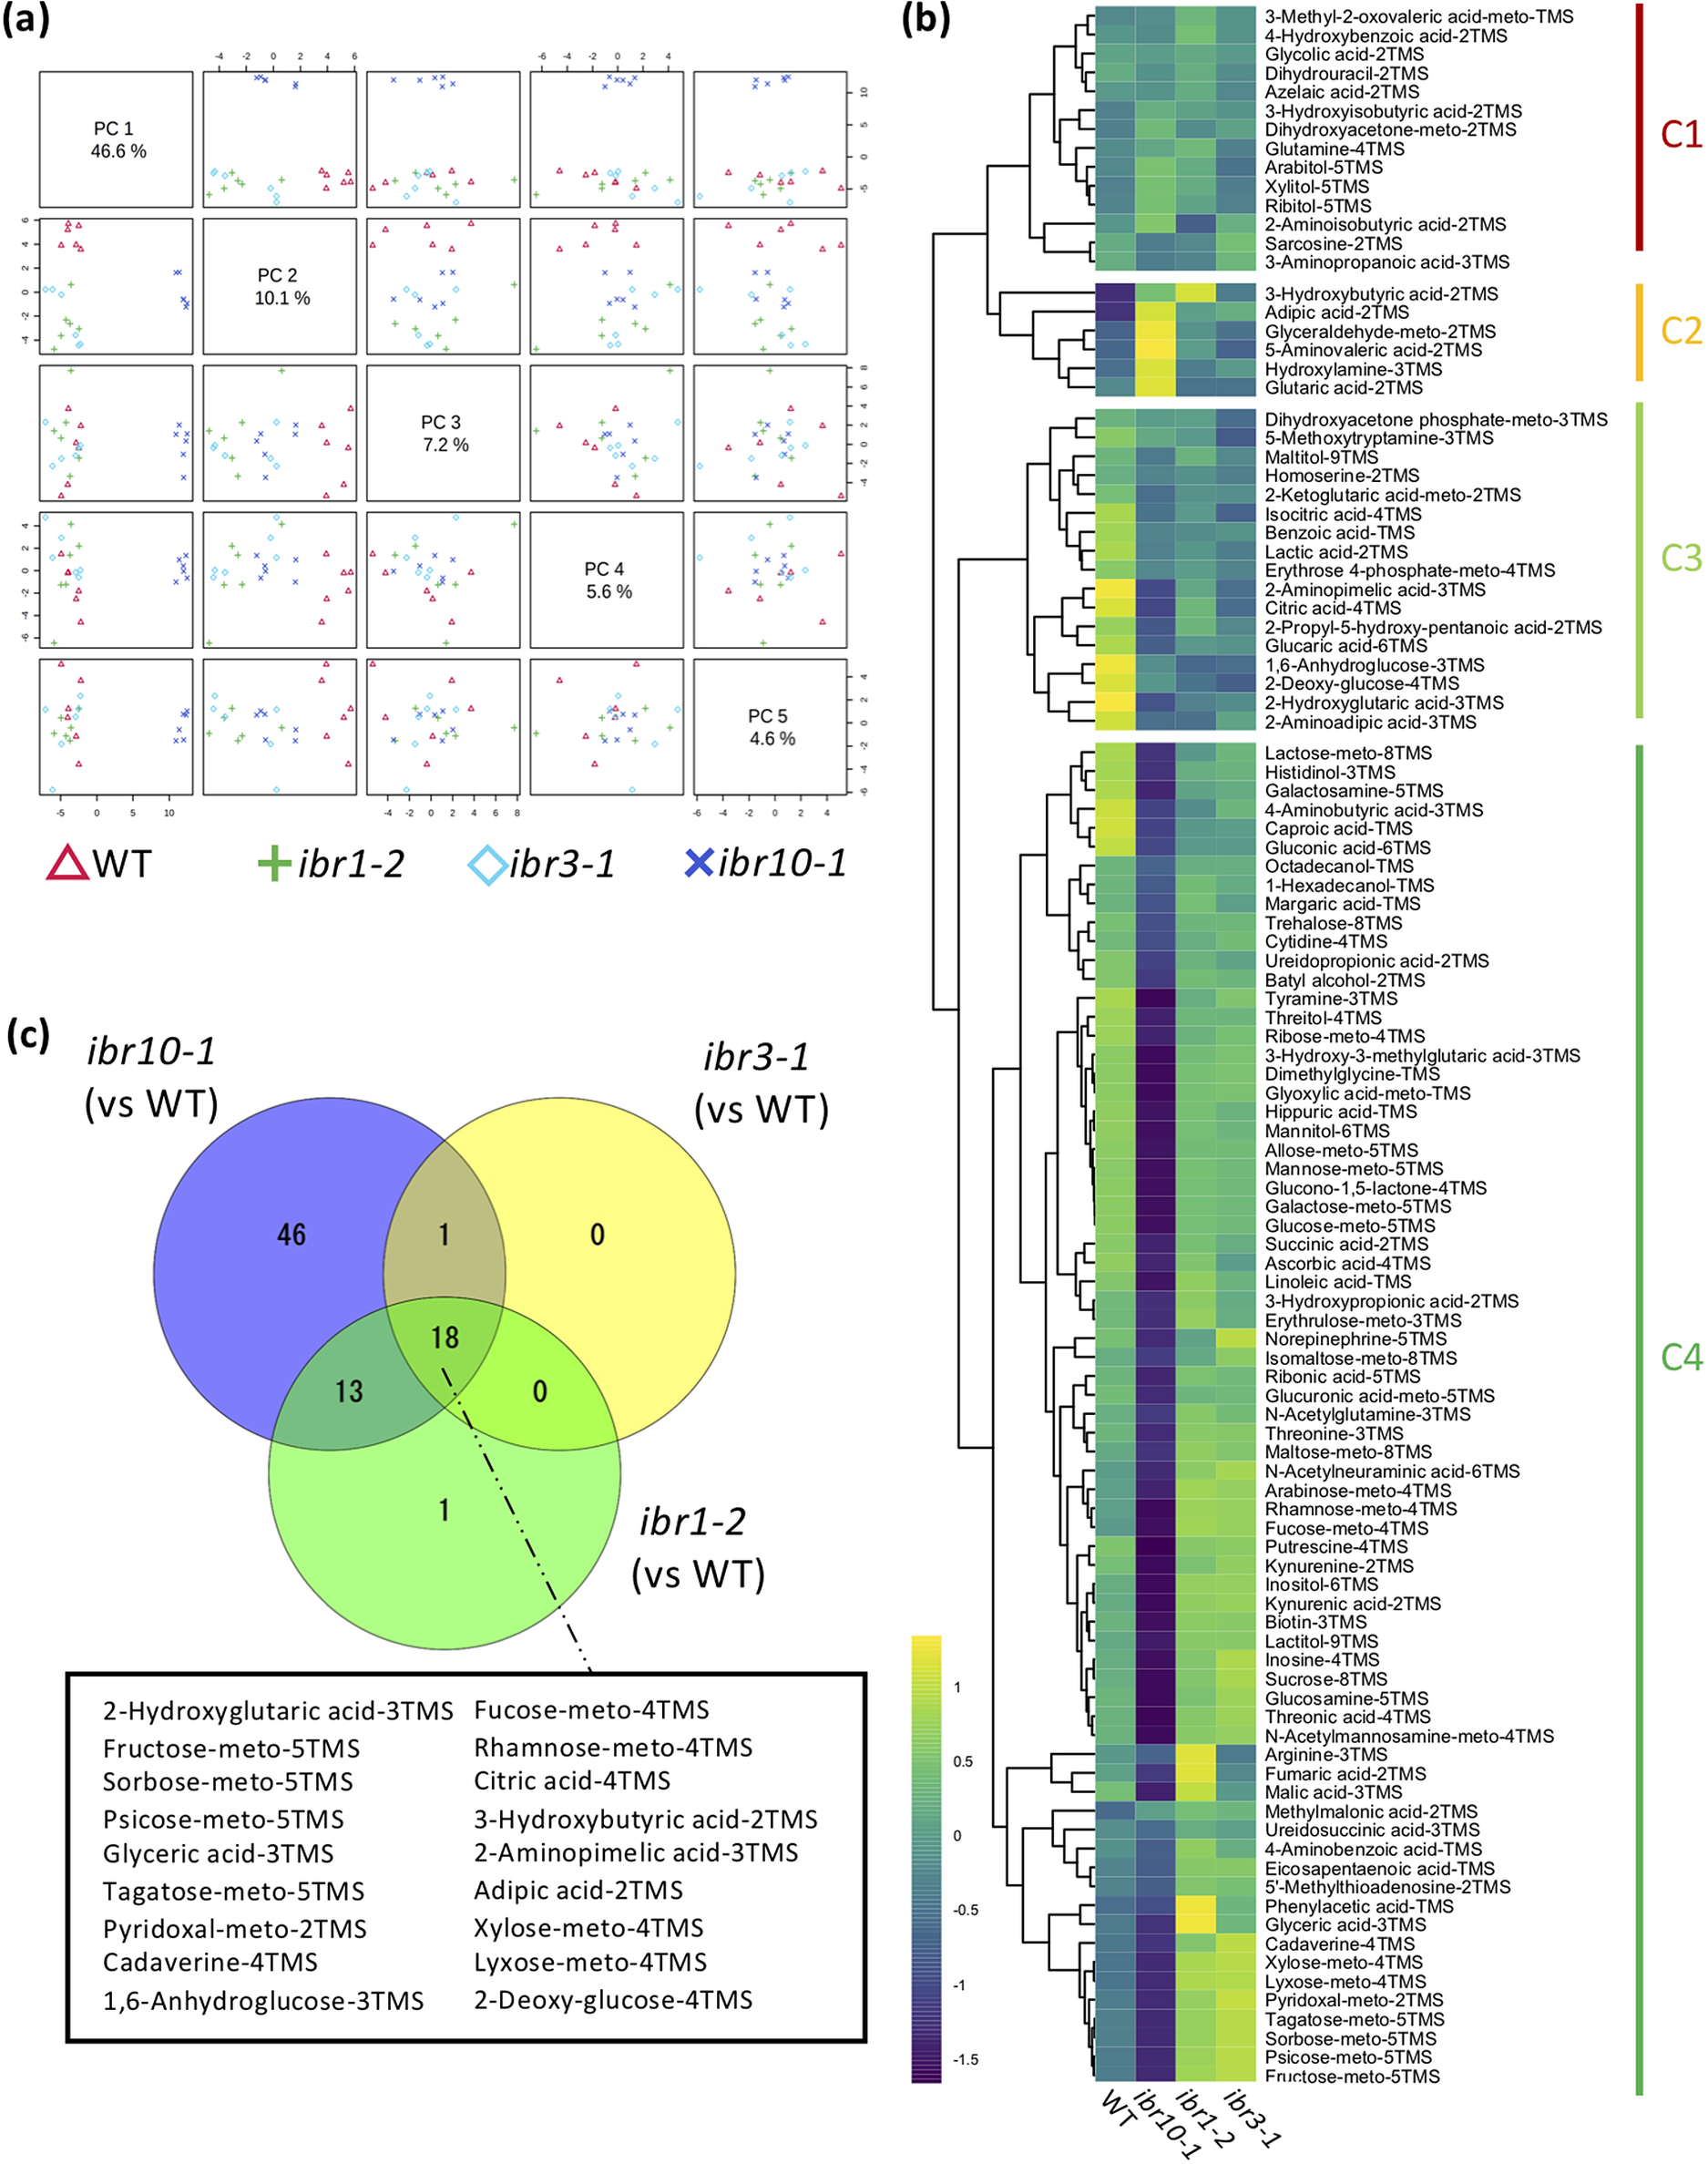
Fig. 1. Metabolic changes in TAG-to-Suc conversion in ibr mutants. (a) Principal component analysis plot for ibr mutants. Metabolome analysis was performed by GC-QqQ-MS using etiolated seedlings at 3 DAI. All 108 metabolites detected by GC-QqQ-MS were used in the PCA (n = 6). PC1–PC4 are described. (b) Hierarchical clustering analysis of each genotype. Data are Z-scores of the average content relative to that of the quality control samples (n = 6) at 3 DAI. (c) Venn diagrams for each mutant line. Each number represents the metabolites with a significantly changed content compared with the WT, as determined by Student’s t-test (n = 6, p < 0.05). Factors shown in the black box are significantly different in all mutants compared with the WT. DAI, days after induction of seed germination.
In addition, the Venn diagram summarising the metabolic changes among the above ibr mutants indicated that only ibr10 exhibited significant differences in terms of the number of metabolites compared with the WT (Figure 1c). Provided that each mutant had a slightly downregulated rate of IBA-to-IAA conversion in the peroxisome during the early developmental phase (Frick & Strader, Reference Frick and Strader2018; Korasick et al., Reference Korasick, Enders and Strader2013; Spiess et al., Reference Spiess, Hausman, Yu, Cohen, Rampey and Zolman2014; Strader et al., Reference Strader, Wheeler, Christensen, Berens, Cohen, Rampey and Bartel2011; Zolman et al., Reference Zolman, Nyberg and Bartel2007; Reference Zolman, Martinez, Millius, Adham and Bartel2008), changes in 18 selected metabolites in all ibr mutants implicate roles in β-oxidation and/or IBA conversion (Figure 1c). Together, our findings indicated that only ibr10-1 has a remarkable metabolic alteration among all ibr mutants, suggesting a distinct role of IBR10 in seed nutrient reserve mobilisation and a link between such metabolic profiles and the abovementioned cotyledon phenotypes.
2.2. Sugar levels were reduced in ibr10 mutants
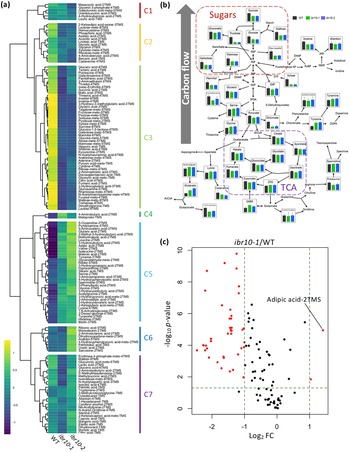
To investigate the metabolic alterations in ibr10 mutants, we conducted GC-QqQ-MS wide-target analysis using two different alleles: ibr10-1 (Zolman et al., Reference Zolman, Martinez, Millius, Adham and Bartel2008) and ibr10-2 (SALK_201893C; Tabeta et al., Reference Tabeta, Watanabe, Fukuda, Gunji, Asaoka, Hirai, Seo, Tsukaya and Ferjani2021). Our data indicated that ibr10-1 and ibr10-2 shared ~70% of the total metabolic changes (Supplemental Figure S1). More specifically, 146 metabolites stably detected in the GC-QqQ-MS wide-target analysis were categorised into seven clusters (C1–C7) based on their behaviour (Figure 2a). Among them, the amounts of the C3 metabolites, mostly sugars and organic acids, were lower in the ibr10 mutants than in the WT (Figure 2b), consistent with the independent data sets described above (see Figure 1b).

Fig. 2. GC-MS/MS metabolome analysis in ibr10 mutants. (a) Hierarchical clustering analysis of ibr10-1 and ibr10-2. All 146 metabolites detected by GC-QqQ-MS were categorised into seven clusters (C1–C7) based on behaviour. Data are Z-scores of the average content relative to that of the quality control samples (n = 6) of 3 DAI etiolated seedlings. (b) Pathway analysis in the ibr10 mutants. Primary metabolites related to TAG-to-Suc conversion are plotted on the corresponding metabolic pathway. Data are means + standard deviation (SD) (n = 6) of 3 DAI etiolated seedlings. (c) Volcano plot for ibr10-1. p-values determined by Student’s t-test for WT and ibr10-1 comparisons. Fold change (FC) values were determined for ibr10-1 relative to the WT. Red dots represent metabolites significantly changed between the WT and ibr10-1 (n = 6). DAI, days after induction of seed germination.
Next, we overlaid the profiles of primary metabolites on the corresponding metabolic pathways, focusing on the carbon flow, assuming that this stage of seedling development is characterised by TAG-to-Suc conversion. As shown in Figure 2b, while the levels of metabolites related to the TCA and glyoxylate cycles were either unchanged or slightly reduced, Suc contents were reduced by almost 40% (Figure 2b; Supplemental Table S1). Furthermore, other sugars such as glucose, galactose and fructose were similarly reduced in both ibr10 alleles (Figure 2b).
Then, the metabolites that were significantly increased or decreased in ibr10 mutants compared with the WT were further selected by volcano plot analysis. This revealed that adipic acid-2TMS was the most highly accumulated in ibr10-1 compared with the WT (Figure 2c). Since adipic acid, an important commercial dicarboxylic acid, is a platform chemical that may be linked to β-oxidation (Skoog et al., Reference Skoog, Shin, Saez-Jimenez, Mapelli and Olsson2018), its accumulation in only ibr10 (Figure 1b) may reflect a TAG-to-Suc mobilisation disorder. In addition, volcano plot analysis revealed that the metabolites that were decreased were mostly sugars and organic acids (Supplemental Table S2). Taken together, these results indicate that β-oxidation and carbon flux were specifically affected in ibr10, but not in ibr1-2 or ibr3-1. These findings also indicate that the diminished Suc production in ibr10 mutants is simply due to a lower supply of carbon source from TAG degradation, in agreement with our previous report (Tabeta et al., Reference Tabeta, Watanabe, Fukuda, Gunji, Asaoka, Hirai, Seo, Tsukaya and Ferjani2021).
2.3. TAG degradation defects were observed in ibr10 mutants
Metabolic profiling indicated that ibr10 accumulated less sugars and organic acids (Figure 2), suggesting that defects in TAG mobilisation occurred upstream of this pathway. Provided that TAG degradation was nearly complete at 4 DAI (Ferjani et al., Reference Ferjani, Segami, Horiguchi, Muto, Maeshima and Tsukaya2011), LC-qTOF-MS non-target lipidomic analysis was performed to formally test the above hypothesis at this critical stage.
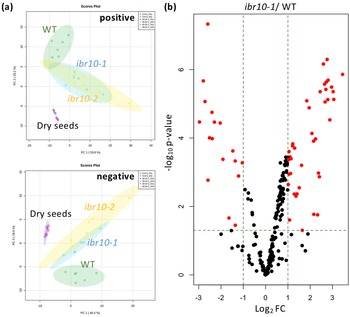
PCA plots depict the differences between the WT and ibr10 mutants in both negative and positive modes of LC-qTOF-MS (Figure 3a). Consistently, both ibr10 mutant alleles showed similar lipidomic changes, confirming the results obtained above by GC-QqQ-MS analysis (Figure 3a). It is of note that the lipid profiles of dry seeds of the WT and two ibr10 mutant alleles (i.e., prior to seed imbibition) were identical (Figure 3a). Together, these results unambiguously indicated that the metabolic disorders mentioned above occurred after seed imbibition and are likely associated with defects related to TAG degradation and subsequent steps.

Fig. 3. LC-qTOF-MS lipidomic analysis in ibr10 mutants. (a) PCA plot for the ibr mutants. Lipidomic analysis was performed by LC-qTOF-MS non-target analysis using dry seeds (n = 3) and etiolated seedlings (n = 6) at 3 DAI. Each PCA represents a positive and negative mode of liquid chromatography condition. In total, 156 and 161 metabolites were detected in the positive and negative modes, respectively. (b) Volcano plot for ibr10-1. p-values were calculated by Student’s t-test for WT and ibr10-1 comparisons. Fold change (FC) values were determined for ibr10-1 relative to the WT. Red dots represent metabolites significantly changed between the WT and ibr10-1 (n = 6). DAI, days after induction of seed germination.
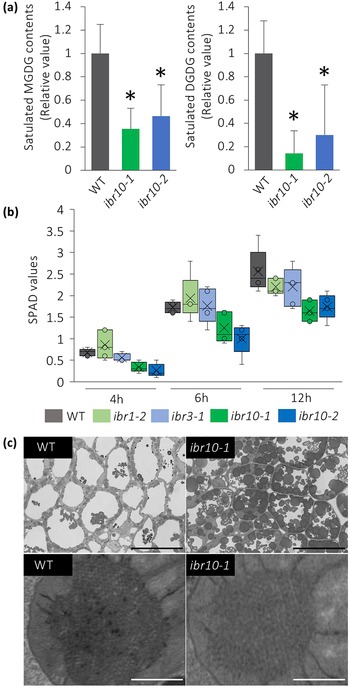
Based on the above findings, we next attempted to confirm the changes in lipids in detail in ibr10. For this, we performed HCA, which revealed that several lipid species were altered in ibr10, particularly in the bottom cluster (in both positive and negative modes), in which TAG, DAG and membrane lipids were enriched (Supplemental Figure S2). The volcano plot further indicated that several classes of lipids tended to be higher in ibr10-1 than in the WT (Figure 3b). Next, lipids whose levels were significantly up- or downregulated were selected (Supplemental Table S3). Interestingly, we found that the highly accumulated lipids were almost exclusively TAGs and DAGs, confirming that TAG degradation was severely disrupted. Moreover, levels of monogalactosyldiacylglycerol (MGDG) and digalactosyldiacylglycerol (DGDG), which are targeted mainly to the chloroplast, were markedly low, and phosphatidylethanolamine (PE) and phosphatidylcholine (PC) contents tended to increase in ibr10 (Supplemental Figure S2). Collectively, these results indicate that TAG mobilisation defects in ibr10 broadly and significantly affected membrane lipid composition.
It has been reported that a lack of MGDG-to-DGDG conversion disrupts membrane structure in etioplasts (Fujii et al., Reference Fujii, Kobayashi, Nagata, Masuda and Wada2018). Because saturated DGDG is targeted mostly to protoplasts, and their contents were reduced by almost 80% in ibr10 (Figure 4a), we hypothesised that the transition from etioplast to chloroplast would also be impaired in ibr10. Quantification of soil and plant analysis development (SPAD) values, which are correlated with chlorophyll concentration (Ling et al., Reference Ling, Huang and Jarvis2011), suggests that unlike ibr1-2 and ibr3-1, ibr10 mutants display reduced chlorophyll content during the greening process (Figure 4b). Provided that SPAD values reflect chlorophyll levels via nitrate abundance, this may also suggest that TAG degradation defects caused etioplastic transition delay, which in turn led to defects in light-acquired development. Surprisingly, SPAD values measured on rosette leaves were unaffected (Supplemental Figure S3), indicating that chlorophyll content was lower only during the initial developmental phase following light exposure. Although field-emission scanning electron microscope (FE-SEM) observations support TAG accumulation in ibr10, as a significant number of oil bodies remained, the lattice membrane in prolamellar bodies, a unique structure of the etioplast, did not change drastically (Figure 4c). These results suggest that altered lipid composition has a harmful effect during the etioplast–chloroplast transition.

Fig. 4. Analysis of etioplast lipid composition and structure. (a) MGDG and DGDG contents of ibr10 etiolated seedlings. Saturated lipid species were selected from lipidomic data and normalised to WT content. Data are means + SD (n = 6; 3 DAI etiolated seedlings). Asterisks indicate mutants with significant differences compared with the WT (Dunnett’s test at p < 0.05; R ver. 3.5.1). (b) Time-course changes in the SPAD values of ibr10. SPAD values were measured at each time point after light treatment (n = 5; biological replicates). Lower and upper boxes represent the first and third quartiles, and the line in the boxes represents the median. Each single biological replicate contains 10 technical replicates of 3 DAI etiolated seedlings. (c) FE-SEM images of ibr10 etiolated seedlings. Upper images represent cell structure, and the corresponding bottom images represent the prolamellar body in etioplasts of 3 DAI etiolate seedlings. Black bar = 20 $\unicode{x3bc} $
m and white bar = 0.5
$\unicode{x3bc} $
m and white bar = 0.5 $\unicode{x3bc} $
m. DAI, days after induction of seed germination; SPAD, soil and plant analysis development.
$\unicode{x3bc} $
m. DAI, days after induction of seed germination; SPAD, soil and plant analysis development.
2.4. Threonine plays a key role in hypocotyl elongation
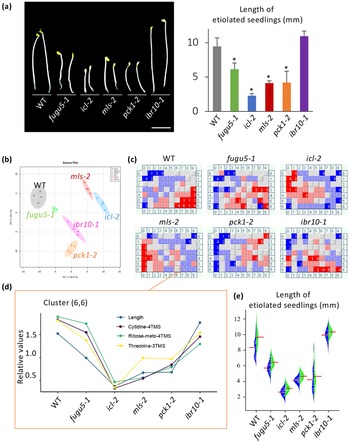
Unlike ibr1-2 and ibr3-1, the above results indicated that IBR10 has a non-negligible role in TAG mobilisation (Figure 1). Suc synthesised from TAG is used to produce ATP, which sustains seedling development during heterotrophic growth periods (Graham, Reference Graham2008). It is widely accepted that the length of hypocotyls in etiolated seedlings is related to endogenous Suc content. However, etiolated seedlings in ibr10 display a proper length (Strader et al., Reference Strader, Wheeler, Christensen, Berens, Cohen, Rampey and Bartel2011), suggesting that other metabolite(s) play a key role in this process. While icl-2, mls-2, pck1-2 and fugu5 exhibit shorter hypocotyls in the dark due to metabolic disorders in the TAG-Suc pathway (Cornah et al., Reference Cornah, Germain, Ward, Beale and Smith2004; Eastmond et al., Reference Eastmond, Germain, Lange, Bryce, Smith and Graham2000; Ferjani et al., Reference Ferjani, Segami, Horiguchi, Muto, Maeshima and Tsukaya2011; Reference Ferjani, Kawade, Asaoka, Oikawa, Okada, Mochizuki, Maeshima, Hirai, Saito and Tsukaya2018; Penfield et al., Reference Penfield, Rylott, Gilday, Graham, Larson and Graham2004), hypocotyl length in these mutants is not strictly correlated with Suc content (Figure 5a; Takahashi et al., Reference Takahashi, Morimoto, Tabeta, Asaoka, Ishida, Maeshima, Tsukaya and Ferjani2017; Tabeta et al., Reference Tabeta, Watanabe, Fukuda, Gunji, Asaoka, Hirai, Seo, Tsukaya and Ferjani2021). Note that the hypocotyl elongation defect in the above lines is fully restored upon exogenous supply of Suc (Supplemental Figure S4).

Fig. 5. Key metabolites with contents correlated with hypocotyl length. (a) Phenotypes of etiolated seedlings grown on Suc-free MS medium. Photographs were taken at 3 DAI (left panel, bar = 3 mm). The bar plot presents the means + SD of 3 DAI etiolated seedlings (n = 20). Asterisks indicate mutants with significant differences compared with the WT (Dunnett’s test at p < 0.05; R ver. 3.5.1). (b) PCA plot of Class II compensation mutants. Overall, 163 metabolites were detected by GC-QqQ-MS and analysed. Each plot represents samples (n = 4) from 3 DAI etiolated seedlings. (c) BL-SOM analysis of etiolated seedlings. All metabolites were categorised into 70 clusters based the elongation pattern of each mutant. Each box contains metabolites with similar patterns. Blue and red represent low and high amounts compared with the average values, respectively. (d) Bar graph of factors categorised in the cluster (6,6). Data indicate relative contents in each mutant line. (e) Beanplot of etiolated seedling length. Red bars represent means. Blue blocks represent MS medium data, and green blocks represent MS + 10 $\unicode{x3bc} $
M Thr data of 3 DAI etiolated seedlings (n = 20). Etiolated seedlings were significantly longer on MS + 10
$\unicode{x3bc} $
M Thr data of 3 DAI etiolated seedlings (n = 20). Etiolated seedlings were significantly longer on MS + 10 $\unicode{x3bc} $
M Thr compared to Thr-free MS medium in all indicated genotypes, except the pck1-2 mutant (Student’s t-test at p < 0.05). DAI, days after induction of seed germination.
$\unicode{x3bc} $
M Thr compared to Thr-free MS medium in all indicated genotypes, except the pck1-2 mutant (Student’s t-test at p < 0.05). DAI, days after induction of seed germination.
To identify candidate metabolites implicated in etiolated seedling length regulation, we conducted a comparative metabolome analysis using WT, icl-2, mls-2, pck1-2, fugu5-1 and ibr10-1 as a representative allele. In total, this analysis detected 163 metabolites using the MRM mode of GC-QqQ-MS. Collectively, PCA scatter plots (Figure 5b) and HCA analyses (Supplemental Figure S5) showed remarkable dissimilarities among the above genotypes. Pathway analysis revealed that glucose and fructose contents in mls-2 were comparable with those in the WT, indicating that these sugars are unlikely to be related to hypocotyl length (Supplemental Figure S5). However, the above approaches alone were insufficient to determine the molecular process underlying hypocotyl length regulation and/or to identify the key metabolites concerned because multiple metabolic processes, namely gluconeogenesis and the glyoxylate and TCA cycles, are affected in the above genotypes (Supplemental Figure S6). We next conducted an additional bioinformatics-based trans-omics analysis to identify such key metabolites.
To determine the relationships between phenotypes and metabolome data, batch-learning self-organised map (BL-SOM) analysis (Abe et al., Reference Abe, Kanaya, Kinouchi, Ichiba, Kozuki and Ikemura2003; Kanaya et al., Reference Kanaya, Kinouchi, Abe, Kudo, Yamada, Nishi, Mori and Ikemura2001), an approach that was first applied during metabolome and transcriptome overlay analysis (Hirai et al., Reference Hirai, Yano, Goodenowe, Kanaya, Kimura, Awazuhara, Arita, Fujiwara and Saito2004; Reference Hirai, Klein, Fujikawa, Yano, Goodenowe, Yamazaki, Kanaya, Nakamura, Kitayama, Suzuki, Sakurai, Shibata, Tokuhisa, Reichelt, Gershenzon, Papenbrock and Saito2005), was employed. Here, we used metabolome data and quantitative hypocotyl length data. Each mutant line displayed a unique fingerprint (Figure 5c); we found that length was categorised into a cluster (6,6) that included three metabolites: cytidine, ribose and threonine [(Thr); Figure 5c,d]. Interestingly, Suc was categorised into cluster (7,6), indicating that the Suc content was not correlated with hypocotyl length under our conditions.
Among the three metabolites, provided that ribose and cytidine were scarcely detected in this extraction method, the effect of the exogenous supply of Thr was assessed first at different concentrations (100 nM–1 mM). Importantly, L-Thr consistently and significantly promoted the elongation of etiolated seedling hypocotyls in the WT, at all concentrations tested so far (Supplemental Figure S7a). Surprisingly, the exogenous supply of Gly, Ser, Cys, Lys, Glu, Asp and Phe at 100 $\unicode{x3bc} $
M had no promotive effect on the elongation of etiolated seedling hypocotyls (Supplemental Figure S7b). Finally, when exogenously supplied, L-Thr enhanced hypocotyl elongation in the WT and all mutant lines (Figure 5e).
$\unicode{x3bc} $
M had no promotive effect on the elongation of etiolated seedling hypocotyls (Supplemental Figure S7b). Finally, when exogenously supplied, L-Thr enhanced hypocotyl elongation in the WT and all mutant lines (Figure 5e).
3. Discussion
Despite the abundance of data, our understanding of the mechanism of etiolated seedling elongation remains elusive. From seed imbibition until the acquisition of photosynthetic ability, TAG-derived Suc is a vital carbon and energy source that fuels seedling elongation in Arabidopsis (Graham, Reference Graham2008). We previously reported that ibr10 mutants exhibit normal etiolated seedlings, despite having a severely decreased Suc content (Tabeta et al., Reference Tabeta, Watanabe, Fukuda, Gunji, Asaoka, Hirai, Seo, Tsukaya and Ferjani2021). This discrepancy contradicts the widespread belief that Suc content is directly linked to etiolated seedling length.
While the roles of IBR1, IBR3 and IBR10 in IAA homoeostasis have been well documented (Frick & Strader, Reference Frick and Strader2018; Korasick et al., Reference Korasick, Enders and Strader2013; Spiess et al., Reference Spiess, Hausman, Yu, Cohen, Rampey and Zolman2014; Strader et al., Reference Strader, Wheeler, Christensen, Berens, Cohen, Rampey and Bartel2011), their function in TAG mobilisation has been overlooked. Surprisingly, among the three ibr mutants, only the ibr10 mutant exhibited Class II compensation (Tabeta et al., Reference Tabeta, Watanabe, Fukuda, Gunji, Asaoka, Hirai, Seo, Tsukaya and Ferjani2021). Because Class II compensation is exclusively associated with the partial failure of Suc production de novo from TAG, we extensively investigated this pathway in the ibr background.
3.1. IBR10 has an important role in TAG-to-Suc conversion
Arabidopsis mutants, even with a partial defect in Suc production from TAG, typically display short hypocotyls in the dark (Cornah et al., Reference Cornah, Germain, Ward, Beale and Smith2004; Eastmond et al., Reference Eastmond, Germain, Lange, Bryce, Smith and Graham2000; Ferjani et al., Reference Ferjani, Segami, Horiguchi, Muto, Maeshima and Tsukaya2011; Reference Ferjani, Kawade, Asaoka, Oikawa, Okada, Mochizuki, Maeshima, Hirai, Saito and Tsukaya2018; Penfield et al., Reference Penfield, Rylott, Gilday, Graham, Larson and Graham2004). However, ibr10 mutants in which Suc content was reduced by almost 40% did not follow this rule (Tabeta et al., Reference Tabeta, Watanabe, Fukuda, Gunji, Asaoka, Hirai, Seo, Tsukaya and Ferjani2021), questioning the validity of the correlation between hypocotyl length and Suc. To this end, metabolome analysis was performed to identify novel factors promoting hypocotyl elongation that may have been overlooked using conventional methods.
LC-qTOF-MS and GC-QqQ-MS analyses of major metabolites that occur during TAG-to-Suc conversion and found that IBR10 plays a critical role. Our data revealed that the levels of several metabolites in the TCA and glyoxylate cycles, as well as a number of organic acids related to these pathways, were reduced in ibr10 mutants (Figure 2b). Moreover, the overall sugar content was also reduced (Figure 2b), indicating that the loss of IBR10 activity affected TAG mobilisation. Consistently, lipidomics revealed that TAGs and DAGs remained at high levels (Figure 3; Supplemental Figure S2), suggesting that the process occurring from TAG degradation to the TCA and glyoxylate cycles is compromised in ibr10.
Whereas previous studies reported that IBR10 is localised in plant peroxisomes together with other enzymes involved in β-oxidation (Reumann et al., Reference Reumann, Babujee, Ma, Wienkoop, Siemsen, Antonicelli, Rasche, Lüder, Weckwerth and Jahn2007), its involvement in TAG mobilisation has been obscured by the normal hypocotyl length of its etiolated seedlings (Strader et al., Reference Strader, Culler, Cohen and Bartel2010; Reference Strader, Wheeler, Christensen, Berens, Cohen, Rampey and Bartel2011). Against the above background, we propose that IBR10 is indeed involved in β-oxidation, directly or indirectly, given that its loss-of-function led to TAG and DAG degradation defects. More specifically, FAs released from the TAG of the oil bodies via lipase activity are transported into peroxisomes, where they are transformed to acyl-CoA to enter the core β-oxidation cycle (Eastmond, Reference Eastmond2006; Fulda et al., Reference Fulda, Schnurr, Abbadi, Heinz and Browse2004; Graham, Reference Graham2008; Hu et al., Reference Hu, Baker, Bartel, Linka, Mullen, Reumann and Zolman2012). As adipic acid is a FA related to β-oxidation, the high accumulation of TAGs and DAGs in ibr10 (Figure 2) may have affected closely related reactions and/or transport of FAs, again suggesting a major contribution of IBR10 to lipid mobilisation. However, we were unable to identify the substrate of IBR10 in our omics-based analysis; this should be addressed in future work.
ENOYL-CoA HYDRATASE2, which is involved in both β-oxidation and TAG-Suc mobilisation (Katano et al., Reference Katano, Takahashi, Hirano, Kazama, Abe, Tsukaya and Ferjani2016; Li et al., Reference Li, Liu and Zolman2019; Strader et al., Reference Strader, Wheeler, Christensen, Berens, Cohen, Rampey and Bartel2011), may share similar functions with IBR10. It was interesting to find that ibr1-2 and ibr3-1, reported to be dedicated to IBA conversion, also displayed slight metabolic fluctuations compared with the WT (Figure 1), pointing to a yet unidentified connection between the two pathways. The peroxisome is an essential organelle in plant cells in which several vital chemical reactions take place. This study adds insight to our current understanding of IBRs and the peroxisomal metabolic network.
3.2. Missing phenotypes caused by lack of IBR10 enzyme were identified by homeostatic metabolic networks
Lipid mobilisation is an essential metabolic event during the early phase of plant developmental, not only as a source of energy but also to acquire photosynthetic ability, which involves chloroplast ultrastructural changes during the greening process. Mutants with defects in MGDG-to-DGDG conversion have a defect in etioplasts, which leads to lowered photosynthetic ability, indicating the importance of DGDG content in the transition into protoplasts and light-acquired development (Fujii et al., Reference Fujii, Kobayashi, Nagata, Masuda and Wada2018). In ibr10, sugars levels were reduced by ~40% due to peroxisomal metabolic disorder, which may also reduce the UDP-galactose used during DAG-to-MGDG conversion. Recently, Kozuka and colleagues reported that icl-2 and mls-2 mutants display low sugar contents and have a photosynthesis defect at an early developmental phase (Kozuka et al., Reference Kozuka, Sawada, Imai, Kanai, Hirai, Mano, Umehara, Nishimura, Kusaba and Nagatani2020), suggesting TAG breakdown defects affect galactolipid synthesis.
In the ibr10 mutants, a defect in lipid mobilisation likely reduced MGDG and DGDG contents by ~40% and 20–30%, respectively, mimicking the lipid composition reported previously in Fujii et al. (Reference Fujii, Kobayashi, Nagata, Masuda and Wada2018). Unexpectedly, although ibr10 exhibited an altered membrane lipid composition and low photosynthesis ability, etioplast ultrastructure was not disrupted (Figures 3b and 4b; Supplemental Figure S2). Our metabolome analysis and previous research showed that the metabolic alteration starts after 2–3 DAI (Figure 3a; Tabeta et al., Reference Tabeta, Watanabe, Fukuda, Gunji, Asaoka, Hirai, Seo, Tsukaya and Ferjani2021), indicating that TAG degradation defects after seed imbibition and their impact on MGDG and DGDG biosynthesis are exclusively post-germinative. Altogether, TAG jams at the seed imbibition stage slowed lipid mobilisation and affected galactolipids, resulting in a transition delay to the autotrophic regime, likely due to low chlorophyll contents.
Lipid homoeostasis of MGDG, DGDG, PE and PC has been discussed previously (Essigmann et al., Reference Essigmann, Guler, Narang, Linke and Benning1998; Hartel & Benning, Reference Hartel and Benning2000; Tjellstrom et al., Reference Tjellstrom, Andersson, Larsson and Sandelius2008). Our data are consistent with the above trend under the assumption that PE and PC levels were increased in ibr10 to compensate for the reduction in galactolipids (Supplemental Figure S2). Nevertheless, although oil bodies were not fully converted into sugars in ibr10, this metabolic disruption did not severely affect hypocotyl elongation. This may indicate that central metabolic flow was somehow adjusted. Arabidopsis seed storage proteins represent a second gateway fueling seedling establishment (Eastmond et al., Reference Eastmond, Astley, Parsley, Aubry, Williams, Menard, Craddock, Nunes-Nesi, Fernie and Hibberd2015). It is also possible that ibr10 mutant can generate longer hypocotyls than the other mutants because it diverts its energy from chlorophyll synthesis and chloroplast biogenesis to hypocotyl elongation. Therefore, these alternative pathways may have partially helped replenish energy shortage during ibr10 seed germination, as ibr10 failed to fully use TAG stores. Collectively, homoeostatic coordination among the different lipid species and central metabolism may have led to a new steady state compensating for the deficit in the ibr10 background, preventing a visible phenotype.
3.3. Threonine as a potential regulator of hypocotyl elongation
As mentioned above, our phenotypic analysis revealed that Suc levels do not always allow prediction of hypocotyl length in etiolated seedlings. Indeed, Suc was not categorised within the same cluster as etiolated seedling length (Figure 5c), and ibr10 displayed normal hypocotyl length (Tabeta et al., Reference Tabeta, Watanabe, Fukuda, Gunji, Asaoka, Hirai, Seo, Tsukaya and Ferjani2021). Taken together, these results suggest that other factors may control seedling development.
BL-SOM analysis identified candidate metabolites with a straightforward relationship with hypocotyl length (Figure 5c,d). Among the metabolites identified, the contents of the amino acid threonine (Thr) were positively correlated with hypocotyl length, and exogenous supply of Thr at a relatively low concentration (10 $\unicode{x3bc} $
M) significantly boosted hypocotyl elongation (Figure 5e). It is worth noting that our targeted GC-QqQ-MS analysis detected only 163 metabolites, which is a relatively low number when considering the rich plant phytochemical diversity. For instance, Arabidopsis alone has been reported to possess nearly 3,030 different metabolites, a number that may double in the future (Hawkins et al., Reference Hawkins, Ginzburg, Zhao, Dwyer, Xue, Xu, Rice, Cole, Paley, Karp and Rhee2021). This may suggest that other metabolites or Thr-related compounds not detected here may have a relatively higher biological activity in stimulating hypocotyl elongation. In other words, our findings suggest that not only sugars but also various metabolites, such as amino acids and/or organic acids, must be tightly regulated during organogenesis (Kawade et al., Reference Kawade, Horiguchi, Hirose, Oikawa, Hirai, Saito, Fujita and Tsukaya2020; Nakayama et al., Reference Nakayama, Koga, Long, Hamant and Ferjani2022).
$\unicode{x3bc} $
M) significantly boosted hypocotyl elongation (Figure 5e). It is worth noting that our targeted GC-QqQ-MS analysis detected only 163 metabolites, which is a relatively low number when considering the rich plant phytochemical diversity. For instance, Arabidopsis alone has been reported to possess nearly 3,030 different metabolites, a number that may double in the future (Hawkins et al., Reference Hawkins, Ginzburg, Zhao, Dwyer, Xue, Xu, Rice, Cole, Paley, Karp and Rhee2021). This may suggest that other metabolites or Thr-related compounds not detected here may have a relatively higher biological activity in stimulating hypocotyl elongation. In other words, our findings suggest that not only sugars but also various metabolites, such as amino acids and/or organic acids, must be tightly regulated during organogenesis (Kawade et al., Reference Kawade, Horiguchi, Hirose, Oikawa, Hirai, Saito, Fujita and Tsukaya2020; Nakayama et al., Reference Nakayama, Koga, Long, Hamant and Ferjani2022).
3.4. The importance of quantitative approaches in plant development
IBR1 and IBR3 have potential functions with IBR10 in IBA-IAA conversion (Strader et al., Reference Strader, Culler, Cohen and Bartel2010; Reference Strader, Wheeler, Christensen, Berens, Cohen, Rampey and Bartel2011; Zolman et al., Reference Zolman, Nyberg and Bartel2007; Reference Zolman, Martinez, Millius, Adham and Bartel2008); etiolated seedlings in the above mutants were not affected (Zolman et al., Reference Zolman, Martinez, Millius, Adham and Bartel2008). We recently reported that ibr10 exhibits Class II compensation, which is observed in mutants with partially defective TAG-to-Suc conversion, indicating that IBR10 has a previously unrecognised function (Tabeta et al., Reference Tabeta, Watanabe, Fukuda, Gunji, Asaoka, Hirai, Seo, Tsukaya and Ferjani2021; Takahashi et al., Reference Takahashi, Morimoto, Tabeta, Asaoka, Ishida, Maeshima, Tsukaya and Ferjani2017). This is likely because ibr10 has no visible phenotype, as it is indistinguishable from the WT.
Although the holistic contributions of carbohydrates to etiolated seedling establishment and hypocotyl elongation have been investigated extensively, the molecular processes behind this important trait have not been fully determined. For decades, most studies suggested a direct link between Suc concentration and hypocotyl length (Graham, Reference Graham2008; Strader et al., Reference Strader, Wheeler, Christensen, Berens, Cohen, Rampey and Bartel2011). First, against the above background, this study provides a conceptual overview of how such questions should be approached. Second, our previous studies (Tabeta et al., Reference Tabeta, Watanabe, Fukuda, Gunji, Asaoka, Hirai, Seo, Tsukaya and Ferjani2021; Takahashi et al., Reference Takahashi, Morimoto, Tabeta, Asaoka, Ishida, Maeshima, Tsukaya and Ferjani2017), together with the quantitative trans-omic approach adopted in this study, unambiguously show that Thr promotes hypocotyl elongation in the dark. This is in full agreement with a previous report that Arabidopsis uses two gluconeogenic gateways for organic acids to fuel seedling establishment (Eastmond et al., Reference Eastmond, Astley, Parsley, Aubry, Williams, Menard, Craddock, Nunes-Nesi, Fernie and Hibberd2015).
More specifically, it has been thought for a long time that the gluconeogenic route in eukaryotes uses organic acid intermediates to produce sugars in a PCK-dependent manner. Surprisingly, radiolabelling showed that while PCK allows de novo synthesis of sugars from dicarboxylic acids, products of lipid breakdown, the cytosolic enzyme orthophosphate dikinase allows sugars to be produced from pyruvate, a major product of protein breakdown (Eastmond et al., Reference Eastmond, Astley, Parsley, Aubry, Williams, Menard, Craddock, Nunes-Nesi, Fernie and Hibberd2015). As Ala, Cys, Gly, Trp and Thr from protein reserves represent a major source of pyruvate (Eastmond et al., Reference Eastmond, Astley, Parsley, Aubry, Williams, Menard, Craddock, Nunes-Nesi, Fernie and Hibberd2015), our findings imply that hypocotyl elongation promoted by exogenous Thr supply reflects the role of storage proteins in nurturing seedlings during a skotomorphogenic developmental programme. In other words, while our data indicate that Thr can act both as an alternative energy source and a carbon source during hypocotyl elongation, further experiments are needed to determine the full molecular mechanism. This study reveals a new role of Thr in cell elongation, allowing for the first time the uncoupling of certain etiolated mechanisms using a quantitative metabolomic approach. Finally, our findings demonstrate the importance of quantitative plant biology approaches (Autran et al., Reference Autran, Bassel, Chae, Ezer, Ferjani, Fleck, Hamant, Hartmann, Jiao, Johnston, Kwiatkowska, Lim, Mahönen, Morris, Mulder, Nakayama, Sozzani, Strader, Tusscher, Ueda and Wolf2021) in depicting and visualising the unseen side(s) of plant development and provide meaningful insight into uncharacterised regulatory mechanisms.
4. Methods
4.1. Plant materials and growth conditions
The WT plant used in this study was Columbia-0 (Col-0), and all the mutants were based on the Col-0 background. ibr1–2, ibr3–1 and ibr10–1 seeds were a gift from Professor Bonnie Bartel (Rice University). icl–2, mls–2 and pck1–2 mutant seeds were a gift from Professor Ian Graham (The University of York). ibr10-2 was obtained from Arabidopsis Biological Resource Center (ABRC/The Ohio State University).
Sterilised seeds were sown on Suc-free Murashige and Skoog (MS) medium (Wako Pure Chemical) or MS medium with 2% (w/v) Suc where indicated. 0.1% (w/v) 2-(N-morpholino) ethanesulfonic acid (MES) was added, the pH was adjusted to 5.8 with KOH, and then the medium was solidified with 0.2–0.5% (w/v) gellan gum (Murashige & Skoog, Reference Murashige and Skoog1962) in order to determine the effects of medium composition on phenotype. Stock solutions of L-threonine (Thr) and L-serine (Ser; Sigma-Aldrich), or glycine (Gly), L-Cysteine (Cys), L(+)-Lysine (Lys), L(+)-Glutamine (Glu), L-Aspartic Acid (Asp) and L(-)-Phenylalanine (Phe) (Wako Pure Chemical) were filter sterilised and added to Suc-free MS medium at the indicated final concentrations. The seeds were sown on the MS plates, which were then stored at 4°C in the dark for 3 days. After cold treatment, the seedlings were grown in the dark for the designated durations. icl–2, mls–2, pck1–2, ibr1–2, ibr3–1, ibr10–1 and ibr10–2 were genotyped and characterised as described previously (Cornah et al., Reference Cornah, Germain, Ward, Beale and Smith2004; Eastmond et al., Reference Eastmond, Germain, Lange, Bryce, Smith and Graham2000; Penfield et al., Reference Penfield, Rylott, Gilday, Graham, Larson and Graham2004; Strader et al., Reference Strader, Wheeler, Christensen, Berens, Cohen, Rampey and Bartel2011; Tabeta et al., Reference Tabeta, Watanabe, Fukuda, Gunji, Asaoka, Hirai, Seo, Tsukaya and Ferjani2021; Takahashi et al., Reference Takahashi, Morimoto, Tabeta, Asaoka, Ishida, Maeshima, Tsukaya and Ferjani2017).
4.2. Microscopy
Photographs of gross plant phenotypes at 3 DAI were taken using a stereoscopic microscope (M165FC; Leica Microsystems) connected to a CCD camera (DFC300FX; Leica Microsystems).
For electron microscopy, samples were fixed in 4% paraformaldehyde and 2% glutaraldehyde in 50 mM sodium cacodylate buffer (pH 7.4) for 1 hr in the dark (covered with aluminum foil) and for 1.5 hr in the light at room temperature. Then, the samples were post-fixed with 1% osmium tetroxide in 50 mM cacodylate buffer for 2 hr at room temperature. After dehydration in a graded methanol series (25, 50, 75, 90 and 100%), the samples were embedded in Epon812 resin (TAAB). Ultrathin sections (100 nm) were generated using a diamond knife on an ultramicrotome (Leica EM UC7, Leica Microsystems) and placed on a glass slide. The sections were stained with 0.4% uranyl acetate for 12 min followed by lead stain solution (Sigma-Aldrich) for 3 min and coated with osmium under an osmium coater (HPC-1SW, Vacuum Device). The sections were observed using the FE-SEM SU8220 (Hitachi High Technology) with an yttrium aluminum garnet backscattered electron detector at an accelerating voltage of 5 kV.
4.3. Wide-target metabolome analysis of GC-QqQ-MS
Etiolated seedlings at 3 DAI were collected in one tube in liquid nitrogen and freeze-dried. The samples were extracted using a bead shocker in a 2 mL tube with 5 mm zirconia beads and 80% MeOH for 2 min at 1,000 rpm (Shake Master NEO, Biomedical Sciences). The extracted solutions were centrifuged at 104 g for 1 min, and 100 $\unicode{x3bc} $
L centrifuged solution and 10
$\unicode{x3bc} $
L centrifuged solution and 10 $\unicode{x3bc} $
L 0.2 mg/mL Adonitol (Internal Standard; I.S.) were dispensed in a 1.5 mL tube. After drying the solution using a centrifuge evaporator (Speed vac, Thermo), 100
$\unicode{x3bc} $
L 0.2 mg/mL Adonitol (Internal Standard; I.S.) were dispensed in a 1.5 mL tube. After drying the solution using a centrifuge evaporator (Speed vac, Thermo), 100 $\unicode{x3bc} $
L Mox reagent (2% methoxyamine in pyridine, Thermo) was added to the 1.5 mL tube, and the metabolites were methoxylated at 30°C and 1,200 rpm for approximately 6 hr using a Thermo shaker (BSR-MSC100, Biomedical Sciences). After methoxylation, 50
$\unicode{x3bc} $
L Mox reagent (2% methoxyamine in pyridine, Thermo) was added to the 1.5 mL tube, and the metabolites were methoxylated at 30°C and 1,200 rpm for approximately 6 hr using a Thermo shaker (BSR-MSC100, Biomedical Sciences). After methoxylation, 50 $\unicode{x3bc} $
L 1% v/v of trimethylchlorosilane (TMS, Thermo) was added to the 1.5 mL tube. For TMS derivatisation, the mixture was incubated for 30 min at 1,200 rpm at 37°C as described above.
$\unicode{x3bc} $
L 1% v/v of trimethylchlorosilane (TMS, Thermo) was added to the 1.5 mL tube. For TMS derivatisation, the mixture was incubated for 30 min at 1,200 rpm at 37°C as described above.
Finally, 50 $\unicode{x3bc} $
L of the derivatised samples was dispensed in vials for GC-QqQ-MS analysis (AOC-5000 Plus with GCMS-TQ8040, Shimadzu Corporation). Raw data collection was performed using the GCMS software solution (Shimadzu Corporation). Calculation of the peak area values was conducted using MRMPROBS (Tsugawa et al., Reference Tsugawa, Arita, Kanazawa, Ogiwara, Bamba and Fukusaki2013; Reference Tsugawa, Kanazawa, Ogiwara and Arita2014a; Reference Tsugawa, Ohta, Izumi, Ogiwara, Yukihira, Bamba, Fukusaki and Arita2014b). Peak areas were normalised using a quality control sample and LOWESS/Spline normalisation tool (Tsugawa et al., Reference Tsugawa, Kanazawa, Ogiwara and Arita2014a). Detailed GC-MS/MS parameters were as described previously (Tabeta et al., Reference Tabeta, Watanabe, Fukuda, Gunji, Asaoka, Hirai, Seo, Tsukaya and Ferjani2021). MRM transition information is shown in Supplemental Table S4.
$\unicode{x3bc} $
L of the derivatised samples was dispensed in vials for GC-QqQ-MS analysis (AOC-5000 Plus with GCMS-TQ8040, Shimadzu Corporation). Raw data collection was performed using the GCMS software solution (Shimadzu Corporation). Calculation of the peak area values was conducted using MRMPROBS (Tsugawa et al., Reference Tsugawa, Arita, Kanazawa, Ogiwara, Bamba and Fukusaki2013; Reference Tsugawa, Kanazawa, Ogiwara and Arita2014a; Reference Tsugawa, Ohta, Izumi, Ogiwara, Yukihira, Bamba, Fukusaki and Arita2014b). Peak areas were normalised using a quality control sample and LOWESS/Spline normalisation tool (Tsugawa et al., Reference Tsugawa, Kanazawa, Ogiwara and Arita2014a). Detailed GC-MS/MS parameters were as described previously (Tabeta et al., Reference Tabeta, Watanabe, Fukuda, Gunji, Asaoka, Hirai, Seo, Tsukaya and Ferjani2021). MRM transition information is shown in Supplemental Table S4.
4.4. Lipidome analysis using LC-qTOF-MS
0.8 mg (DW) of mature seeds (50 dry seeds per sample) or 50 etiolated seedlings grown under complete darkness on Suc-free MS medium were used as the starting material for lipidomic analysis. Dry seeds (three biological replicates) or etiolated seedlings (six biological replicates) placed in a 2-mL centrifuge tube were mixed with an 800-fold volume of extraction solvent [methyl tert-butyl ether/methanol = 3/1 (v/v) containing 1 $\unicode{x3bc} $
M 1,2-didecanoyl-sn-glycero-3-phosphocholine, Sigma-Aldrich], and milled by shaking at 900 rpm at 4°C for 5 min on the Shake Master Neo (BMS, Tokyo, Japan) using zirconia beads. A 200-fold volume of water was added to the homogenate. After vigorous stirring on a vortex mixer and dark incubation for 15 min on ice, the homogenate was centrifuged at 1,000 × g for 5 min. The upper layer (200
$\unicode{x3bc} $
M 1,2-didecanoyl-sn-glycero-3-phosphocholine, Sigma-Aldrich], and milled by shaking at 900 rpm at 4°C for 5 min on the Shake Master Neo (BMS, Tokyo, Japan) using zirconia beads. A 200-fold volume of water was added to the homogenate. After vigorous stirring on a vortex mixer and dark incubation for 15 min on ice, the homogenate was centrifuged at 1,000 × g for 5 min. The upper layer (200 $\unicode{x3bc} $
L) was transferred to a new 1.5-mL microcentrifuge tube. The organic phase was evaporated to dryness using a centrifugal concentrator (ThermoSavant SPD2010, Thermo Fisher Scientific) at room temperature. The residue was dissolved in 250
$\unicode{x3bc} $
L) was transferred to a new 1.5-mL microcentrifuge tube. The organic phase was evaporated to dryness using a centrifugal concentrator (ThermoSavant SPD2010, Thermo Fisher Scientific) at room temperature. The residue was dissolved in 250 $\unicode{x3bc} $
L ethanol and centrifuged at 10,000 × g for 15 min. Then, 200
$\unicode{x3bc} $
L ethanol and centrifuged at 10,000 × g for 15 min. Then, 200 $\unicode{x3bc} $
L of the supernatant was transferred to a vial with a glass insert for performing LC-MS/MS analysis. The method for LC-MS analysis was described previously (Okazaki & Saito, Reference Okazaki and Saito2018).
$\unicode{x3bc} $
L of the supernatant was transferred to a vial with a glass insert for performing LC-MS/MS analysis. The method for LC-MS analysis was described previously (Okazaki & Saito, Reference Okazaki and Saito2018).
4.5. SPAD measurement
Plants were cultured as described above, and etiolated seedlings were placed under the light to develop etioplasts into chloroplasts. SPAD values were recorded at 4, 6 and 12 hr using the cotyledons of etiolated seedlings (Konica-Minolta, Japan, SPAD-502 plus). Single data described as one replicate contained 10–11 technical replicates using 10 etiolated seedlings.
4.6. Bioinformatics analyses
Statistical analyses were performed using Student’s t-test or Dennett’s test (R ver. 3.5.1; R Core Team, 2018). Multiple comparisons were performed using the multcomp package (Hothorn et al., Reference Hothorn, Bretz and Westfall2008). PCA plots were calculated and designed in MetaboAnalyst4 (Chong et al., Reference Chong, Wishart and Xia2019). Venn diagrams were designed using Venny 2.1 (Oliveros, Reference Oliveros2007–2015). HCAs were performed using the pheatmap package (Kolde, Reference Kolde2019). Pathway analysis was performed using VANTED software (Rohn et al., Reference Rohn, Junker, Hartmann, Grafahrend-Belau, Treutler, Klapperstück, Czauderna, Klukas and Schreiber2012) and the KEGG database (Kanehisa, Reference Kanehisa2002; Kanehisa & Goto, Reference Kanehisa and Goto2000; Okuda et al., Reference Okuda, Yamada, Hamajima, Itoh, Katayama, Bork, Goto and Kanehisa2008). BL-SOM analysis was performed using the simple SOM programme (Abe et al., Reference Abe, Kanaya, Kinouchi, Ichiba, Kozuki and Ikemura2003; Kanaya et al., Reference Kanaya, Kinouchi, Abe, Kudo, Yamada, Nishi, Mori and Ikemura2001). Bean plots were performed using the beanplot package (Kampstra, Reference Kampstra2008). Calculation of log10 p-values and log2 fold change values for the volcano plots, p-values for the Venn diagram and autoscaling sample data for HCA were conducted using MetaboAnalyst4 and 5 (Chong et al., Reference Chong, Wishart and Xia2019).
Acknowledgements
We thank Kouji Takano (RIKEN Center for Sustainable Resource Science) for his technical assistance with LC-qTOF-MS analysis. We thank Dr. Kensuke Kawade (NIBB) and Dr. Takashi Nobusawa (Hiroshima University) for critical reading of the manuscript and valuable comments. We thank Prof. Ian Graham (The University of York) and Dr. Alison Gilday (The University of York) for providing icl–2, mls–2 and pck1–2 mutant seeds. We also thank Professor Bonnie Bartel (Rice University) and Dr. Lucia C. Strader (Duke University) for providing ibr1-2, ibr3-1 and ibr10-1 seeds.
Financial support
This work was supported by Grant-in-Aid for Scientific Research (B) (16H04803 to AF); Grant-in-Aid for Scientific Research on Innovative Areas (25113002 to AF; 25113010 to MYH); Grant-in-Aid for Scientific Research on Innovative Areas (18H05487 to AF). H. Tabeta is a recipient of a Research Fellowship for Young Scientists (DC1) (20J20901).
Conflicts of interest
The authors declare no conflicts of interest.
Authorship contributions
H.T. performed the experiments, collected and analysed the data, and drafted the article. Y.H. and Y.O. performed lipidomics data collection. K.T, M.W. and M.S. performed FE-SEM analysis. K.S. and M.Y.H. directed and funded the study. A.F. conceived the project, designed, supervised, funded the study and wrote the paper with input from all co-authors. All authors read and approved the final manuscript.
Data availability statement
The raw data supporting the conclusions of this article will be made available by the authors, without undue reservation, to any qualified researcher.
Supplementary Materials
To view supplementary material for this article, please visit http://doi.org/10.1017/qpb.2022.19.


 Open access
Comments
July 2, 2022
Editor-in-Chief,
Dear Prof. Olivier Hamant,
Please consider our manuscript entitled “Skotomorphogenesis exploits threonine to promote hypocotyl elongation” for publication, as an Original Research Article, in Quantitative Plant Biology.
Plant Seedlings kept in darkness adopt a skotomorphogenic developmental program, in which allocation of resources is typically directed toward hypocotyl elongation at the expense of cotyledon and root development. Energy production from seed nutrient reserves is crucial for transition of a plant seedling from a heterotrophic to autotrophic regime. In Arabidopsis thaliana, sucrose (Suc) is synthesized from the triacylglycerol (TAG) of the oil bodies via a sequence of metabolic reactions including core β-oxidation, glyoxylate and TCA cycles, and cytosolic gluconeogenesis, and Suc is used to replenish energy supply during seedling development.
To date, the short hypocotyl phenotype has been ascribed to lowered Suc production during seed germination. While mutants with defects in TAG-to-Suc conversion display short hypocotyls due to limited Suc availability, we previously reported that hypocotyl elongation of indole-3-butyric acid response 10 (ibr10) etiolated seedlings was unaffected despite a 40% reduction in Suc content compared with the wild type (Tabeta et al., 2021 PLOS Genetics). This counter-intuitive phenotype suggests that the length of hypocotyls does not necessarily reflect endogenous Suc content, hinting to the presence of other compounds involved in the regulation of this complex trait. This study, in which a multi-platform metabolome analysis combined with bioinformatics approaches was adopted to unveil the function of IBR10, attempts to tackle this long-standing debate.
Here, to dissect the metabolic complexity behind cell elongation, a quantitative-based phenotypic analysis combined with a multi-platform metabolomics approach was applied. We revealed that TAG and diacylglycerol breakdown was disrupted in the ibr10 mutant, resulting in low sugar content and poor photosynthetic ability. Importantly, batch-learning self-organized map clustering revealed that the endogenous threonine level was correlated with hypocotyl length. Consistently, exogenous threonine supply stimulated hypocotyl elongation, indicating that Suc levels are not always correlated with etiolated seedling length, suggesting the contribution of amino acids in this developmental process.
As you may have appreciated, this study reveals a new role of the amino acid threonine in cell elongation, allowing for the first time the uncoupling of certain etiolated mechanisms using a quantitative metabolic approach. Finally, our findings demonstrate the importance of quantitative plant biology approaches in depicting and visualizing the unseen side(s) of plant development and provide meaningful insight into uncharacterized regulatory mechanisms.
This manuscript is the result of a collaboration between several research groups. Dr. Masami Hirai is an expert in plant metabolomics. Dr. Yozo Okazaki is an expert in plant lipidomics, and Dr. Kiminori Toyooka is an expert of electron microscopy.
We believe that our findings will interest a range of scientists who are interested in developmental biology, metabolomics and the related fields of cell biology.
The submitted version has been approved by all authors. This manuscript has not been submitted to another journal, and none of the results have been published elsewhere. The manuscript has been proofread by two native English speakers.
We believe that our manuscript reports findings of key importance about the metabolic complexity behind cell elongation during Skotomorphogenesis from interdisciplinary and quantitative angles. Please do not hesitate to contact us if you require any additional information.
I look forward to hearing from you.
Sincerely,
Ali FERJANI
Ph. D (Associate Professor)
Tokyo Gakugei University