


1. Introduction
Meristems in land plants share conserved roles in shaping plant body formation. They remain undifferentiated while driving cell proliferation and organ development (Greb & Lohmann, Reference Greb and Lohmann2016; Heidstra & Sabatini, Reference Heidstra and Sabatini2014; Meyerowitz, Reference Meyerowitz1997). In contrast to their conserved functions, plant meristems develop highly diversified structures and morphology (Evert, Reference Evert2006; Steeves & Sussex, Reference Steeves and Sussex1989). In seed plants, shoot apical meristems and root apical meristems consist of clonally different cell layers and distinct functional zones (Gaillochet & Lohmann, Reference Gaillochet and Lohmann2015; Geng & Zhou, Reference Geng and Zhou2021; Han et al., Reference Han, Liu and Zhou2020; Heidstra & Sabatini, Reference Heidstra and Sabatini2014; Meyerowitz, Reference Meyerowitz1997; Tsukaya, Reference Tsukaya2021). On the other hand, meristems in seed-free plant lineages usually maintain one single apical cell (AC), which is also called the apical initial or initial cell (Gifford, Reference Gifford1983; Harrison, Reference Harrison2017; Philipson, Reference Philipson1990; Rensing, Reference Rensing2017) and is unidentified in meristems of seed plants. ACs have unique tetrahedral or wedge shapes, and they have been actively studied for their roles in gametophytes of seed-free non-vascular plants (bryophytes) and in sporophytes of seed-free vascular plants (ferns and lycophytes) (Frangedakis et al., Reference Frangedakis, Shimamura, Villarreal, Li, Tomaselli, Waller, Sakakibara, Renzaglia and Szövényi2021; Harrison, Reference Harrison2017; Hata & Kyozuka, Reference Hata and Kyozuka2021; Philipson, Reference Philipson1990; Rensing, Reference Rensing2017). Specifically, gametophytes of bryophytes contain one or a few morphologically distinguishable ACs (Floyd & Bowman, Reference Floyd and Bowman2007; Hata & Kyozuka, Reference Hata and Kyozuka2021). In the moss Physcomitrella patens, the persistent tetrahedral AC continuously sustains gametophyte development and leaf-like organ formation (de Keijzer et al., Reference de Keijzer, Freire Rios and Willemsen2021; Harrison et al., Reference Harrison, Roeder, Meyerowitz and Langdale2009; Kofuji & Hasebe, Reference Kofuji and Hasebe2014; Rensing et al., Reference Rensing, Goffinet, Meyberg, Wu and Bezanilla2020; Véron et al., Reference Véron, Vernoux and Coudert2021). In the liverwort Marchantia polymorpha, the AC drives notch formation and promotes thallus expansion (Bowman et al., Reference Bowman, Sakakibara, Furumizu and Dierschke2016; Hong & Roeder, Reference Hong and Roeder2017; Solly et al., Reference Solly, Cunniffe and Harrison2017). In sporophytes of ferns and lycophytes, ACs maintain a similar function (Harrison, Reference Harrison2017; Plackett et al., Reference Plackett, Stilio and Langdale2015). For example, two adjacent apical initial cells promote cell proliferation and sustain shoot development in the lycophyte Selaginella kraussiana (Harrison et al., Reference Harrison, Rezvani and Langdale2007). Transcriptomes of the AC-type shoot apical meristems were previously characterized in the lycophyte S. moellendorffii and the monilophyte Equisetum arvense (Frank et al., Reference Frank, Edwards, Schultz, McKain, Fei, Sørensen, Rose and Scanlon2015). In fern sporophytes, the single AC is sufficient to drive frond initiation and development in the fern Nephrolepis exaltata (Sanders et al., Reference Sanders, Darrah and Langdale2011), and the tetrahedral AC is also present in the fern Ceratopteris richardii (Hou & Hill, Reference Hou and Hill2002). In fern gametophytes, however, the function and activity of ACs remain largely unclear. Gametophytes of different ferns develop different types of indeterminate meristems to sustain prothallus development and sexual reproduction, including the AC-based meristem and the multicellular meristem (Atkinson & Stokey, Reference Atkinson and Stokey1964; Imaichi, Reference Imaichi2013; Nayar & Kaur, Reference Nayar and Kaur1971; Raghavan, Reference Raghavan1989). The AC-based meristem comprises the wedge-shaped AC and its immediate progenies located at the anterior part of the prothallus (Imaichi, Reference Imaichi2013; Nayar & Kaur, Reference Nayar and Kaur1971). In contrast, the multicellular meristems in fern gametophytes contain a group of adjacent narrow rectangular cells at the outermost layer, showing the cellular organization distinct from that in the AC-based meristems (Banks, Reference Banks1999; Geng et al., Reference Geng, Yan and Zhou2022; Imaichi, Reference Imaichi2013; Nayar & Kaur, Reference Nayar and Kaur1971; Takahashi et al., Reference Takahashi, Hashino, Kami and Imaichi2009; Reference Takahashi, Kami, Morita and Imaichi2012; Reference Takahashi, Kami, Ota, Morita and Imaichi2015; Wu et al., Reference Wu, Yan, McAdam, Banks, Zhang and Zhou2021; Reference Wu, Yan, Yang, Banks, Zhang and Zhou2022).
Previous studies demonstrated that the gametophytes of many examined ferns either lacked persistent ACs or maintained only an active AC for a limited time throughout the whole gametophyte development (Banks et al., Reference Banks, Hickok and Webb1993; Bartz & Gola, Reference Bartz and Gola2018; Conway & Di Stilio, Reference Conway and Di Stilio2020; Geng et al., Reference Geng, Yan and Zhou2022; Imaichi, Reference Imaichi2013; Takahashi et al., Reference Takahashi, Hashino, Kami and Imaichi2009; Reference Takahashi, Kami, Morita and Imaichi2012; Reference Takahashi, Kami, Ota, Morita and Imaichi2015; Wu et al., Reference Wu, Yan, McAdam, Banks, Zhang and Zhou2021; Reference Wu, Yan, Yang, Banks, Zhang and Zhou2022). In gametophytes of the widely studied fern C. richardii (Pteridaceae) (Banks, Reference Banks1999; Bui et al., Reference Bui, Cordle, Irish and Cheng2015; Chatterjee & Roux, Reference Chatterjee and Roux2000; Cooke et al., Reference Cooke, Hickok and Sugai1995; Eberle et al., Reference Eberle, Nemacheck, Wen, Hasebe and Banks1995; Geng et al., Reference Geng, Cai, McAdam, Banks, Wisecaver and Zhou2021a; Geng et al., Reference Geng, Yan and Zhou2022; Hickok et al., Reference Hickok, Warne and Fribourg1995; Marchant et al., Reference Marchant, Sessa, Wolf, Heo, Barbazuk, Soltis and Soltis2019; Plackett et al., Reference Plackett, Stilio and Langdale2015; Reference Plackett, Conway, Hazelton, Rabbinowitsch, Langdale and Stilio2018), the AC is only transiently present in a gametophyte after germination, and it quickly disappears as the prothallus expands (Banks, Reference Banks1999; Bartz & Gola, Reference Bartz and Gola2018). Prothallus development in Ceratopteris is mainly driven by the multicellular meristem initiated from the lateral marginal layer (Banks, Reference Banks1999; Bartz & Gola, Reference Bartz and Gola2018; Conway & Di Stilio, Reference Conway and Di Stilio2020), and this multicellular meristem does not contain any morphologically distinct ACs (Banks, Reference Banks1999; Geng et al., Reference Geng, Yan and Zhou2022). Similarly, gametophytes of Anemia phyllitidis (Anemiaceae) also develop the multicellular meristem at the lateral side, lacking an AC (Takahashi et al., Reference Takahashi, Kami, Morita and Imaichi2012). In gametophytes of three other fern species, Lygodium japonicum (Lygodiaceae), Woodsia obtusa (Woodsiaceae), and Colysis decurrens (Polypodiaceae), the ACs maintain themselves through the oblique division at early stages of gametophyte development (Imaichi, Reference Imaichi2013; Takahashi et al., Reference Takahashi, Hashino, Kami and Imaichi2009; Reference Takahashi, Kami, Ota, Morita and Imaichi2015; Wu et al., Reference Wu, Yan, Yang, Banks, Zhang and Zhou2022). After only a few rounds of cell division, the AC-based meristem disappears and is replaced by the multicellular meristem in the same central apical region of the gametophytes (Imaichi, Reference Imaichi2013; Takahashi et al., Reference Takahashi, Hashino, Kami and Imaichi2009; Reference Takahashi, Kami, Ota, Morita and Imaichi2015; Wu et al., Reference Wu, Yan, Yang, Banks, Zhang and Zhou2022). Interestingly, a recent study showed that some gametophytes of Pteris vittata (Pteridaceae) are able to maintain both the wedge-shaped AC and the multicellular meristem simultaneously at the different locations of prothalli. However, these ACs do not play a role in notch formation during prothallus development (Wu et al., Reference Wu, Yan, McAdam, Banks, Zhang and Zhou2021). All the previous findings suggest that ACs usually only contribute to the early development of gametophytes, and they disappear at late developmental stages (Imaichi, Reference Imaichi2013). Considering highly diversified gametophyte morphology and developmental processes among fern taxa (Christenhusz & Byng, Reference Christenhusz and Byng2016; PPG I, 2016; Pryer et al., Reference Pryer, Schuettpelz, Wolf, Schneider, Smith and Cranfill2004; Sessa, Reference Sessa and Fernández2018; Watkins et al., Reference Watkins, Catherine and Cardelús2012), it remains unclear whether any persistent ACs exist in fern gametophytes to sustain prothallus expansion and drive notch formation. Furthermore, the dynamic division and growth pattern of any persistent AC is also completely unknown.
We imaged and examined gametophyte development in different fern species at single-cell resolution to tackle these questions. Surprisingly, in a few previously uncharacterized ferns from the order Polypodiales, the wedge-shaped ACs can be identified even at the late stages of prothallus development, when the deep notch has been established with two wings fully expanded. Using Sphenomeris chinensis (Lindsaeaceae)—the lace fern (Hassler & Schmitt, Reference Hassler and Schmitt2019; PPG I, 2016)—as a representative species, we determined the growth dynamics of the AC and its immediate progenies during gametophyte development through time-lapse confocal imaging and quantitative analysis. In the gametophytes of S. chinensis, the AC, together with its immediate progenies, form a dynamically maintained cell packet. Quantitative results further demonstrated that active proliferation in the AC and its immediate progenies results in the increased number of small cells at the apical centre of gametophytes, contributing to prothallus expansion and notch formation. This study identified and quantitatively characterized the previously undefined ACs, which remain active at the late stages of fern gametophyte development, broadening our understanding of diversified meristem identities in land plants.
2. Results
2.1. Persistent ACs during gametophyte development in Sphenomeris chinensis
We took confocal microscopy snapshots and found that the wedge-shaped AC was continuously present in S. chinensis gametophytes at different developmental stages. At 29 days after inoculation (DAI) and 31 DAI, when the prothalli were composed of ~38 and ~55 cells, respectively, the wedge-shaped AC (indicated by red stars) at the centre of the apex was distinguishable from the other cells based on cell morphology (Figure 1a,b). At 37 DAI, S. chinensis gametophytes continued to develop as one single layer of cells. Interestingly, at 37 DAI, when the size of one S. chinensis prothallus increased to more than 180 cells with a deep notch at the apex, the wedge-shaped AC (indicated by the red star) was still present (Figure 1c). These observations suggested long-term maintenance of ACs in S. chinensis gametophytes. They further promoted us to determine growth and division patterns that drive AC proliferation.

Fig. 1. Confocal microscopy snapshots showing the presence of apical cells (ACs) in S. chinensis gametophytes with the established apical notch. (a–c) Three S. chinensis gametophytes were stained and imaged through laser scanning confocal microscopy at 29 (a), 31 (b), and 37 (c) days after inoculation (DAI). (a–c) Grey: propidium iodide (PI) stain; scale bar: 20 $\mu$
m. Red stars indicate the wedge-shaped apical cells. At least three independent biological replicates showed the ACs comparable to each representative snapshot in the figure.
$\mu$
m. Red stars indicate the wedge-shaped apical cells. At least three independent biological replicates showed the ACs comparable to each representative snapshot in the figure.
2.2. Cell division patterns in the AC and its immediate progenies in gametophytes
To quantitively determine the division and growth patterns of the AC and its immediate progenies in S. chinensis gametophytes, we performed confocal time-lapse imaging and computational image analysis (Figures 2, 3, Supplementary Figures S1–S8, Supplementary Tables S1–S16), using the quantitative imaging platform that we have established (Wu et al., Reference Wu, Yan, McAdam, Banks, Zhang and Zhou2021; Reference Wu, Yan, Yang, Banks, Zhang and Zhou2022). Each S. chinensis gametophyte was live-imaged at an initial time point (0 hr) and 48 hr after that (48 hr). These samples were visualized through the z-projection view of confocal stacks and were segmented using the established 2D watershed method (Vincent & Soille, Reference Vincent and Soille1991; Wu et al., Reference Wu, Yan, Yang, Banks, Zhang and Zhou2022) to identify the cell outline (Supplementary Tables S1–S16). Then, the size of each cell in gametophytes was computationally determined and colour-coded (Figures 2b,d,g,i, 3a2,a4,b2,b4,c2,c4,d2,d4,e2,e4,f2,f4). Cell divisions during the 48-h period were determined and mapped to the segmented images (Figures 2e,j, 3a5–f5). We found that the wedge-shaped AC, together with two adjacent trapezoid-shaped progenies, formed a unique three-celled packet in the wedge shape (Figures 2, 3, Supplementary Figure S9A). During prothallus development, this cell packet was dynamically maintained through a combination of cell division and expansion patterns. Specifically, the new wedge-shaped cell was produced through the conserved oblique division in an AC (Figures 2a–d,f–i, 3a1–a4, illustrated in Supplementary Figure S9A–E). The oblique division resulted in two daughter cells with a new wedge-shaped cell surrounded by a large trapezoid-shaped cell (Figures 2a–d,f–i, 3a1–a5, Supplementary Figure S9B). Following that, a periclinal division occurred in the newly formed trapezoid-shaped cell, leading to a dynamic transition from the two-celled packet to a newly established three-celled packet at the centre of the developing notch (Figure 3e1–e5,f1–f5). These results suggest that dynamic maintenance of the AC in S. chinensis gametophytes is achieved through the combination of oblique and periclinal divisions in the individual cell packet. Unlike the wedge-shaped AC, the trapezoid-shaped cell within the three-celled packet underwent an anticlinal or periclinal division, giving rise to two new slender or short trapezoid-shaped cells (Figures 2, 3a1–a5,b1–b5, Supplementary Figure S9A,D,E). In multiple gametophytes, the oblique division in the AC and the division (either in an anticlinal or periclinal orientation) in the adjacent trapezoid-shaped cell occurred within 48 hr, yielding five cells in the packet (Figures 2a–e, 3a1–a5, Supplementary Figure S9D,E). To reveal a spatial map of cell divisions during S. chinensis gametophyte development, we determined all the cells with or without cell division over 48 hr and visualized the pattern and location of these cells in the segmented images (Figures 2e,j, 3a5–f5). The division maps demonstrated that besides the conserved cell packet, cells surrounding the AC-containing cell packet also divided over the 48 hr (Figures 2e,j, 3a5–f5).

Fig. 2. Self-renewal of ACs in S. chinensis gametophytes. Two S. chinensis gametophytes (a–j) were stained and live imaged through laser scanning confocal microscopy at 0 hr (a,f) and 48 hr (c,h). (b,d,g,i) The computational segmentation and cell size quantification of confocal images in (a,c,f,h), respectively. (e,j) highlight cell division in the gametophytes (a,f), with the cells that divided during the analysed period (48 hr) shown in red and the cells that did not divide during the same period shown in green. (a) shows a gametophyte at 34 DAI, and (f) shows a gametophyte at 37 DAI. (b,g) highlight the conserved cell packet composed of an AC (indicated by a red star) and its immediate progenies (indicated by black stars) at 0 hr. (d,i) highlight the progenies of all the cells from the conserved cell packets at 48 hr, with the AC labelled with the red star. White arrows in (d,i) indicate the cell division in each packet. (a,c,f,h) Grey: propidium iodide (PI) stain; scale bar: 50 $\mu$
m. Colour bars in (b,d,g,i) show the scales for the quantified area of each segmented cell, from blue (0) to red (
$\mu$
m. Colour bars in (b,d,g,i) show the scales for the quantified area of each segmented cell, from blue (0) to red ( $\geq$
700
$\geq$
700 $\mu$
m2) in (b,d) and from blue (0) to red (
$\mu$
m2) in (b,d) and from blue (0) to red ( $\geq$
1,200
$\geq$
1,200 $\mu$
m2) in (g,i). At least three independent biological replicates showed the self-renewal of the ACs during gametophyte development.
$\mu$
m2) in (g,i). At least three independent biological replicates showed the self-renewal of the ACs during gametophyte development.
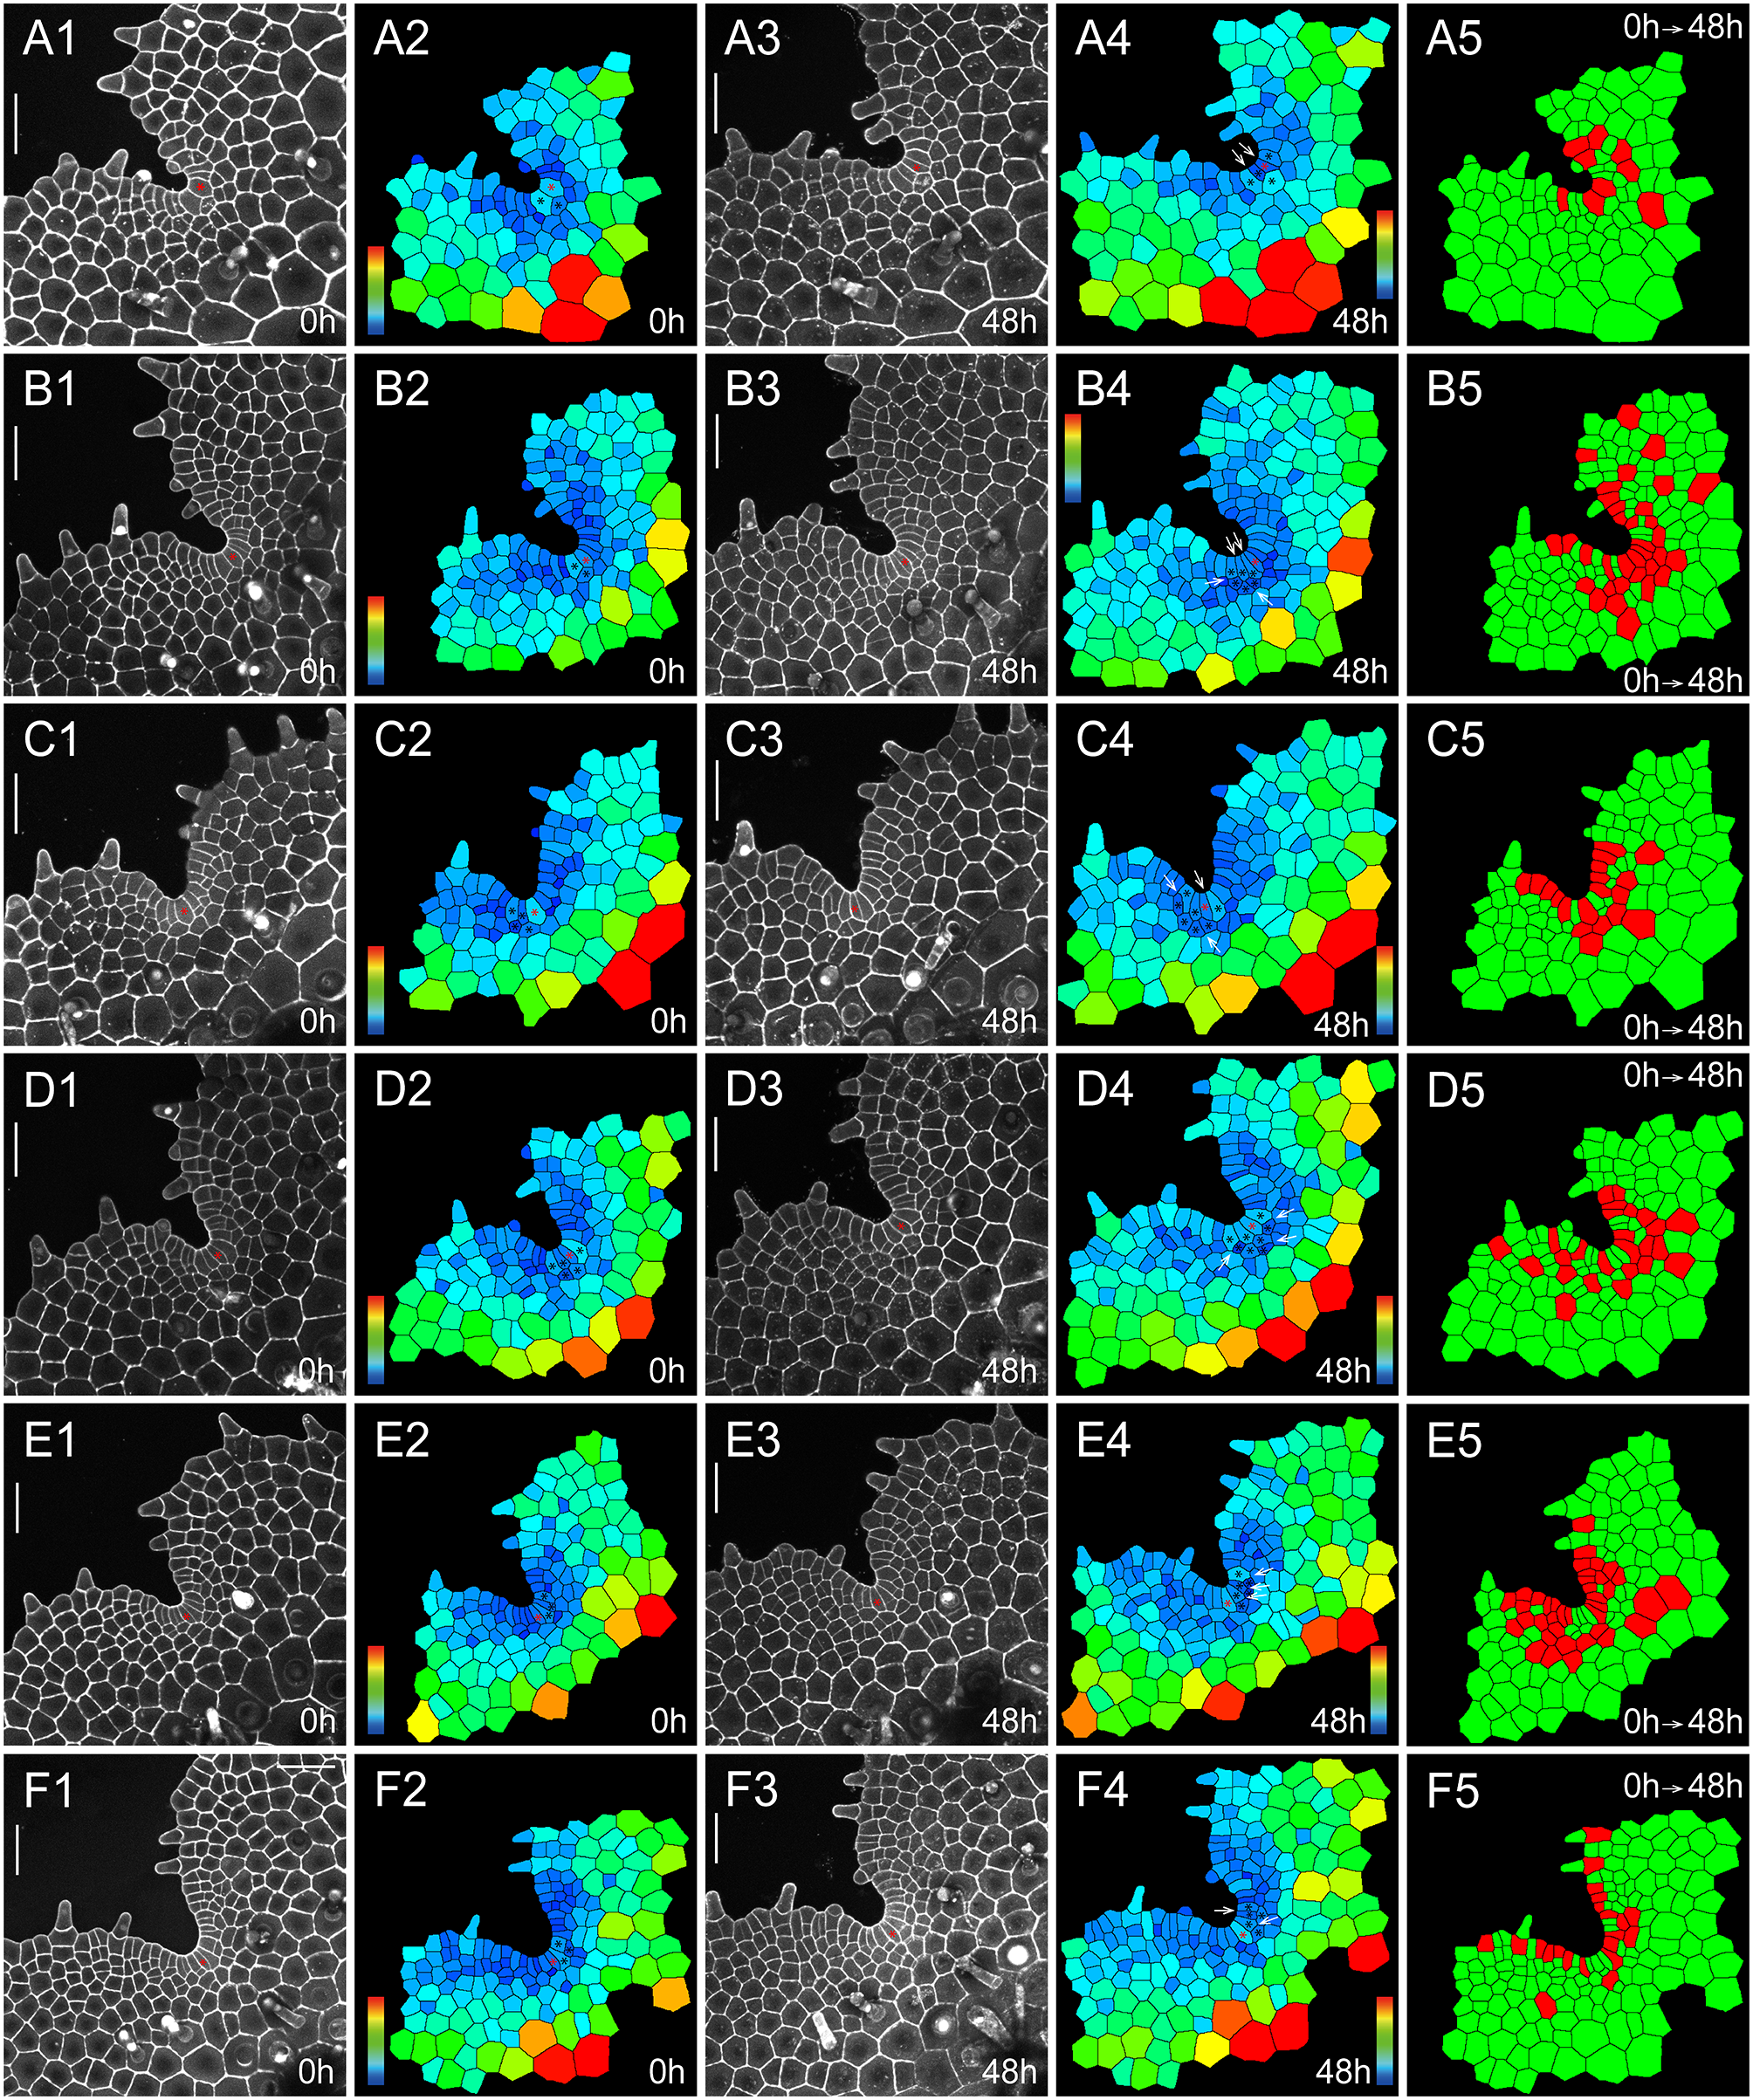
Fig. 3. The homeostasis of ACs and their immediate progenies during S. chinensis gametophyte development. Six S. chinensis gametophytes (a1–a5,b1–b5,c1–c5,d1–d5,e1–e5,f1–f5) were stained and live imaged through laser scanning confocal microscopy at 0 hr (a1,b1,c1,d1,e1,f1) and 48 hr (a3,b3,c3,d3,e3,f3). (a2,a4,b2,b4,c2,c4,d2,d4,e2,e4,f2,f4) The computational segmentation and cell size quantification of confocal images in (a1,a3,b1,b3,c1,c3,d1,d3,e1,e3,f1,f3), respectively. (a5,b5,c5,d5,e5,f5) highlight cell division in the gametophytes (a1,b1,c1,d1,e1,f1), with the cells that divided during the analysed period (48 hr) shown in red and the cells that did not divide during the same period shown in green. (a1,b1,c1,d1,e1,f1) show the gametophytes at 37 DAI. (a2,a4,b2,b4,c2,c4,d2,d4,e2,e4,f2,f4) show the conserved cell packet composed of an AC (indicated by a red star) and its immediate progenies (indicated by black stars). White arrows (a4,b4,c4,d4,e4, and f4) indicate cell division in each packet. (a1,a3,b1,b3,c1,c3,d1,d3,e1,e3,f1,f3) Grey: propidium iodide (PI) stain; scale bar: 50 $\mu$
m. Colour bars in (a2,a4,b2,b4,c2,c4,d2,d4,e2,e4,f2,f4) show the scale for the quantified area of each segmented cell, from blue (0) to red (
$\mu$
m. Colour bars in (a2,a4,b2,b4,c2,c4,d2,d4,e2,e4,f2,f4) show the scale for the quantified area of each segmented cell, from blue (0) to red ( $\geq$
1,200
$\geq$
1,200 $\mu$
m2).
$\mu$
m2).
2.3. Size and position of the AC and its derivatives in gametophytes
We would like to know if the position of these cells determines the size of cells we analysed during the AC-driven gametophyte development. To reveal the potential correlation between the cell size and cell position, we first defined the centre of the AC-based meristem in S. chinensis gametophytes, at which the wedge-shaped AC and its immediate progenies were located (circled in Supplementary Figure S10). We then considered these individual cells as the centre group (centre of the meristem) and compared them with all the other segmented cells (except trichomes) outside the centre group in gametophytes (Supplementary Figure S10). Our quantification in each independent sample (Supplementary Figure S10A–H) showed that at 0 hr, the average cell size in the centre group was significantly smaller than that of the cells outside the centre group (Figure 4a–h). In addition, at 48 hr, the average cell size of the centre group, which included all the progenies of the cells at 0 hr, was also significantly smaller than that of the segmented cells outside the centre group (Supplementary Figures S11A–H, S12A–H). The differences revealed by these statistical analyses can also be visualized from the colour-coded cell size maps, where small cells were coloured blue and large cells were coloured red (Figures 2b,d,g,i, 3a2,a4,b2,b4,c2,c4,d2,d4,e2,e4,f2,f4), showing the size gradient from small cells at the apical centre to large cells located distally to the apical notch, within the flat sheet of each prothallus.

Fig. 4. Quantified cell size variation, division activity, and cell expansion in the meristems and gametophytes. (a–h) The area quantification of the labelled cells from each gametophyte (Supplementary Figure S10A–H), respectively, at 0 hr. (a–h) The Y-axis showed the average cell area. (a–j) The X-axis represented the centre of the meristem (white) and outside the centre (black). (a) n = 10 cells at the centre of the meristem and 49 cells outside the centre. (b) n = 14 cells at the centre of the meristem and 47 cells outside the centre. (c) n = 11 cells at the centre of the meristem and 89 cells outside the centre. (d) n = 10 cells at the centre of the meristem and 131 cells outside the centre. (e) n = 14 cells at the centre of the meristem and 88 cells outside the centre. (f) n = 15 cells at the centre of the meristem and 107 cells outside the centre. (g) n = 12 cells at the centre of the meristem and 112 cells outside the centre. (h) n = 12 cells at the centre of the meristem and 138 cells outside the centre. (i) Y-axis: the average percentage of the cells that divided over 48 hr from the centre of the meristem or outside the centre (n = eight independent samples shown in Supplementary Figures S10, S11). The cells at the centre of the meristems or outside the centre of each gametophyte were determined (Supplementary Figures S10, S11). (j) Y-axis: the average relative area (48/0 hr) at the centre of the meristem or outside the centre (n = eight independent samples shown in Supplementary Figures S10, S11). During the analysed period (48 hr), the relative total cell area (48/0 hr) from the centre of meristems in each gametophyte is calculated as the area of total cells (including daughter cells) at the centre of the meristem (at 48 hr)/the area of total cells at the centre of the meristem (at 0 hr). The relative total cell area (48/0 hr) from the cell group outside the centre is calculated as the area of total cells (including daughter cells) outside the centre (at 48 hr)/the area of total cells outside the centre (0 hr). Bars: means ± SEs. **p < .01, ***p < .001 (Student’s two-tailed t-test). The source data for Figure 4i,j are included in Supplementary Tables S17 and S18.
2.4. AC and its immediate progenies serve as the active proliferation site
We wonder if the small cell size in the centre group is due to more active cell division, slower cell expansion, or both. Thus, we accessed the percentages of the cells divided from each live-imaged sample. Over the 48-hr period, the average percentage of cells in the centre group that divided (mean = 45.64%, n = 8) was significantly higher (p = .0002, two-tailed t-test) than that outside the centre group (mean = 15.10%, n = 8) (Figure 4i, Supplementary Table S17). This result can also be visualized from the cell division maps (Figures 2e,j, 3a5–f5), showing many cells at the centre of meristems divided over 48 hr (labelled in red). We then accessed the cell growth over the 48 hr in these samples by quantifying the changes in total cell area in the two groups (Figure 4j, Supplementary Table S18). Over the analysed time period, the relative total cell area (48/0 hr) in the centre group (mean = 157.63%, n = 8) was slightly higher than that outside the centre group (mean = 132.39%, n = 8), but the difference was statistically significant (p = .0011, two-tailed t-test) (Figure 4 j, Supplementary Table S18). In addition, we also generated the colour-coded cell growth maps to visualize the relative growth of each segmented cell from the eight gametophytes over 48 hr (Supplementary Figure S13A–H). All these maps showed a gradient from the fast cell growth area (indicated by red, yellow, and green) surrounding the apical notch to the slow growth region (indicated by blue) that is located distally to the notch (Supplementary Figure S13A–H). Taken together, all the results from cell division and growth quantification suggested that the AC and its immediate progenies maintain active cell proliferation, leading to the increased number of cells with small size at the apical centre of gametophytes and eventually driving prothallus development.
2.5. AC maintenance in gametophytes of different ferns
We wonder if the maintenance of ACs in gametophytes is a unique character in S. chinensis (Lindsaeaceae) or a shared trait among different fern species, so we took confocal microscopy snapshots and performed cell size quantification of the gametophytes of representative ferns from different taxa (PPG I, 2016). Among the ferns we characterized, we found that the wedge-shaped ACs were also present in the gametophytes of Blechnum australe (Blechnaceae) and Cyrtomium macrophyllum (Dryopteridaceae) at different developmental stages (Figure 5a–l), even when a prothallus contained more than 140 cells and developed a deep apical notch (Figure 5g–j). These results suggested that cell proliferation driven by the persistent AC, which was under-characterized previously, likely serves as a mechanism underlying gametophyte development across different families in Polypodiales (Supplementary Figure S14).
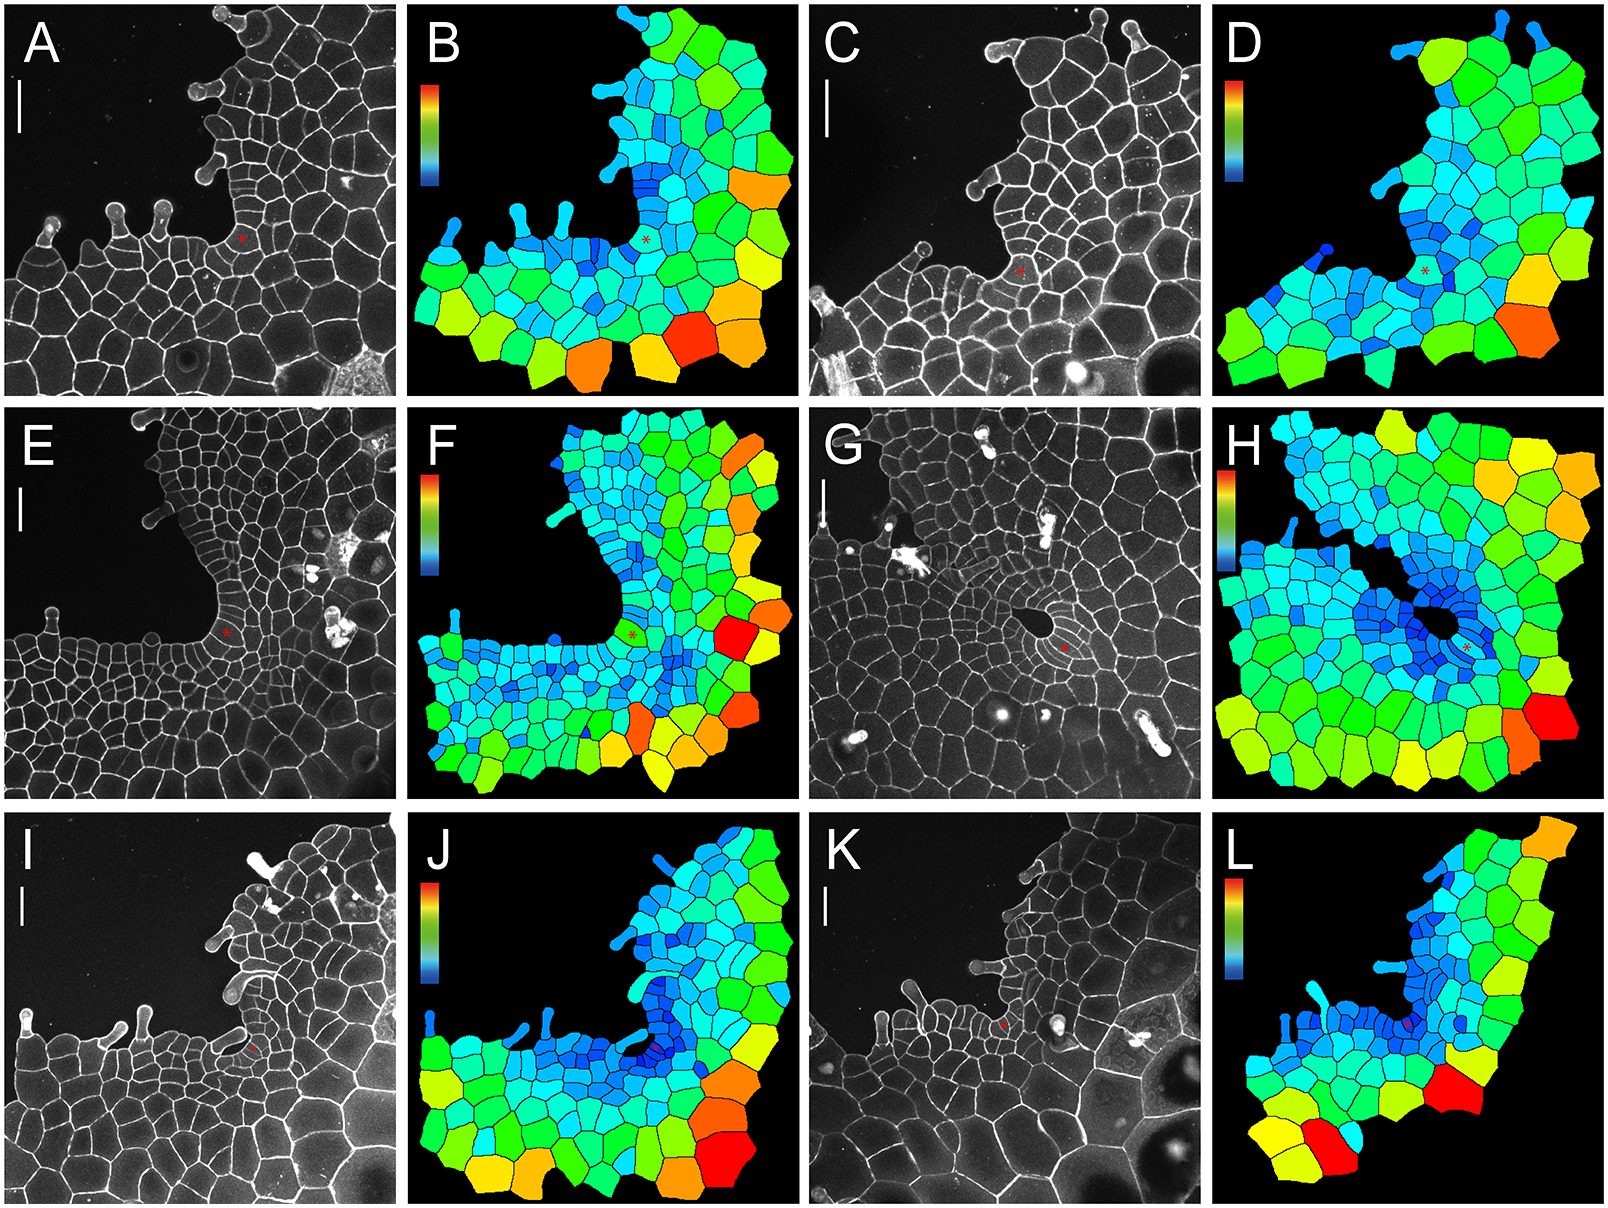
Fig. 5. The confocal imaging and computational analysis show the maintenance of ACs in gametophytes of B. australe and C. macrophyllum. Four B. australe gametophytes were stained and imaged through laser scanning confocal microscopy at 20 (a,c), 23 (e), and 31 (g) DAI. Two C. macrophyllum gametophytes were stained and imaged through laser scanning confocal microscopy at 36 (i,k) DAI. (b,d,f,h,j,l) The computational segmentation and cell size quantification of confocal images in (a,c,e,g,i,k), respectively. (a,c,e,g,i,k) Grey: propidium iodide (PI) stain; scale bar: 50 $\mu$
m. Red stars indicate the wedge-shaped ACs. Colour bars in (b,d,f,h,j,l) show the scales for the quantified area of each segmented cell, from blue (0) to red (
$\mu$
m. Red stars indicate the wedge-shaped ACs. Colour bars in (b,d,f,h,j,l) show the scales for the quantified area of each segmented cell, from blue (0) to red ( $\geq$
1,800
$\geq$
1,800 $\mu$
m2) in (b,d,f), from blue (0) to red (
$\mu$
m2) in (b,d,f), from blue (0) to red ( $\geq$
2,500
$\geq$
2,500 $\mu$
m2) in (h), and from blue (0) to red (
$\mu$
m2) in (h), and from blue (0) to red ( $\geq$
3,200
$\geq$
3,200 $\mu$
m2) in (j,l). At least three independent biological replicates showed the maintenance of an AC comparable to each representative snapshot included in the figure.
$\mu$
m2) in (j,l). At least three independent biological replicates showed the maintenance of an AC comparable to each representative snapshot included in the figure.
3. Discussion
This study shows that the wedge-shaped AC is present and maintained in the gametophytes from three fern species in the order Polypodiales, even at the late developmental stages when the gametophytes have fully expanded and formed the deep notch at the apical centre (Figures 1b,c, 5a–h). Specifically, S. chinensis (Lindsaeaceae), B. austral (Blechnaceae), and C. macrophyllum (Dryopteridaceae) all showed similar morphology of ACs even after the establishment of the apical notch (Figures 1, 5, Supplementary Figure S14). These ferns belong to different suborders: Lindsaeineae, Aspleniineae, and Polypodiineae, respectively (De Gasper et al., Reference De Gasper, Dittrich, Smith and Salino2016; Hassler & Schmitt, Reference Hassler and Schmitt2019; PPG I, 2016). On the contrary, we recently characterized W. obtusa (Woodsiaceae), a fern also belonging to the suborder Aspleniineae, and we found that W. obtusa gametophytes do not maintain any morphologically distinct AC at late developmental stages (Wu et al., Reference Wu, Yan, Yang, Banks, Zhang and Zhou2022). These results altogether promote us to interpret that this trait likely independently evolved or had diversified among different fern taxa. Furthermore, these ACs are not mitotically quiescent, and they actively divide in S. chinensis gametophytes (Figures 2–4, Supplementary Figure S12). These results provided evidence supporting a long-standing assumption that the AC in fern gametophytes can continuously drive prothallus expansion and shape gametophyte morphology (Nayar & Kaur, Reference Nayar and Kaur1971), independent of multicellular apical or marginal meristems.
Through quantitative time-lapse confocal imaging, we determined cellular dynamics underlying the AC-driven proliferation in S. chinensis gametophytes, which is unique and distinct from the previously characterized cell growth patterns in gametophytes of C. richardii (Pteridaceae), P. vittata (Pteridaceae), W. obtusa (Woodsiaceae), L. japonicum (Lygodiaceae), A. phyllitidis (Anemiaceae) or C. decurrens (Polypodiaceae) (Takahashi et al., Reference Takahashi, Hashino, Kami and Imaichi2009; Reference Takahashi, Kami, Morita and Imaichi2012; Reference Takahashi, Kami, Ota, Morita and Imaichi2015; Wu et al., Reference Wu, Yan, McAdam, Banks, Zhang and Zhou2021; Reference Wu, Yan, Yang, Banks, Zhang and Zhou2022). We demonstrated that at the apical centre of S. chinensis gametophytes, the AC and its adjacent immediate progenies form a conserved wedge-shaped cell packet (Figures 2, 3), which was dynamically maintained through the oblique division in the AC and the sequential periclinal and anticlinal divisions in its adjacent progenies (Figure 3b1–f5, Supplementary Figure S9). It has been well-documented that the oblique division plays a conserved role in renewing the ACs in gametophytes of W. obtusa (Woodsiaceae) (Wu et al., Reference Wu, Yan, Yang, Banks, Zhang and Zhou2022), L. japonicum (Lygodiaceae) (Takahashi et al., Reference Takahashi, Kami, Ota, Morita and Imaichi2015), P. vittata (Pteridaceae) (Wu et al., Reference Wu, Yan, McAdam, Banks, Zhang and Zhou2021), and C. decurrens (Polypodiaceae) (Takahashi et al., Reference Takahashi, Hashino, Kami and Imaichi2009). However, in the species examined previously (Takahashi et al., Reference Takahashi, Kami, Ota, Morita and Imaichi2015; Wu et al., Reference Wu, Yan, Yang, Banks, Zhang and Zhou2022), the oblique division was maintained for only a limited time, leading to the disappearance of wedge-shaped ACs and the replacement of the AC-based meristem by the multicellular apical meristem, which is different from the ACs in gametophytes of S. chinensis (Lindsaeaceae). Future studies focusing on the regulatory signals that sustain the oblique division in ACs will provide more insights into AC maintenance in ferns. In addition, compared to meristems in angiosperm sporophytes, such as shoot apical meristems in Arabidopsis (Jones et al., Reference Jones, Forero-Vargas, Withers, Smith, Traas, Dewitte and Murray2017; Laufs et al., Reference Laufs, Grandjean, Jonak, Kiêu and Traas1998; Louveaux et al., Reference Louveaux, Julien, Mirabet, Boudaoud and Hamant2016; Meyerowitz, Reference Meyerowitz1997; Shapiro et al., Reference Shapiro, Tobin, Mjolsness and Meyerowitz2015; Willis et al., Reference Willis, Refahi, Wightman, Landrein, Teles, Huang, Meyerowitz and Jönsson2016; Yang et al., Reference Yang, Wightman and Meyerowitz2017), the AC-based meristems in fern gametophytes show distinct division patterns and activities. It will be interesting to determine whether shared or different mechanisms regulate cell divisions in these two different meristem identities.
Our quantitative data revealed that at the centre of the meristem in S. chinensis gametophytes, the cell size from the group—including the AC, its immediate progenies, and their adjacent cells—was significantly smaller than that of the cells outside the group (Figure 4a–h, Supplementary Figures S10–S12). In addition, the cell division activity and cell growth within this group are significantly higher than outside the group (Figure 4i,j, Supplementary Figures S10, S11). In addition, the colour-coded growth maps revealed that the region of active cell expansion is surrounding the apical notch, in contrast to the slow growth region located distally to the notch (Supplementary Figure S13). All these results uncover the relationship between the cell position, size, growth, and division activity in gametophytes, suggesting cell position plays a role during AC-driven cell proliferation in fern gametophytes.
4. Methods
4.1. Plant materials and growth condition
The spores of S. chinensis (order number: 1884), B. australe (order number: 440), and C. macrophyllum (order number: 744) were requested from and kindly provided by the American Fern Society (AFS). The spores of S. chinensis were propagated and generously shared by Dr. McNickle at Purdue. The spores were germinated on the pots containing SunGro horticulture propagation mix in continuous light at 25°C. All the growth pots were covered and sealed with transparent plastic wrap to retain moisture.
4.2. Confocal live imaging and image analysis
To reveal the morphology of S. chinensis, B. australe, and C. macrophyllum at single-cell resolution, the snapshots of different gametophytes were taken using a Zeiss LSM 880 upright confocal microscope. Specifically, each gametophyte was transferred on the FM plates, stained with propidium iodide (PI), and rinsed with sterilized water two or three times before confocal imaging, as described in Wu et al. (Reference Wu, Yan, McAdam, Banks, Zhang and Zhou2021; Reference Wu, Yan, Yang, Banks, Zhang and Zhou2022). The confocal snapshots included: S. chinensis gametophytes from 29 days after inoculation (DAI) to 37 DAI, B. australe gametophytes from 20 DAI to 31 DAI, and C. macrophyllum gametophytes at 36 DAI. The confocal imaging setting was described previously in detail (Geng & Zhou, Reference Geng and Zhou2019; Wu et al., Reference Wu, Yan, McAdam, Banks, Zhang and Zhou2021; Reference Wu, Yan, Yang, Banks, Zhang and Zhou2022; Zhou et al., Reference Zhou, Yan, Han, Li, Geng, Liu and Meyerowitz2018).
Time-lapse confocal imaging was performed as described previously (Wu et al., Reference Wu, Yan, McAdam, Banks, Zhang and Zhou2021; Reference Wu, Yan, Yang, Banks, Zhang and Zhou2022) to quantitatively determine the growth and division patterns of the AC and its immediate progenies during S. chinensis gametophyte development. A 48-hr period was used in the time-lapse imaging based on the cell number and growth and gametophyte morphology indicated by the confocal snapshots (Figure 1a–c). In total, 19 independent samples were live imaged at 0 and 48 hr, all showing active proliferation of ACs and their immediate progenies. Among them, eight samples were segmented and quantitatively analysed, shown in Figures 2a–j, 3a1–a5,b1–b5,c1–c5,d1–d5,e1–e5, and f1–f5. All the samples (imaged at 37 DAI or 34 DAI) showed comparable cell division and growth patterns. The Image J / Fiji was used for generating the maximum intensity Z projection view of confocal images (Schindelin et al., Reference Schindelin, Arganda-Carreras, Frise, Kaynig, Longair, Pietzsch, Preibisch, Rueden, Saalfeld, Schmid, Tinevez, White, Hartenstein, Eliceiri, Tomancak and Cardona2012). The 2D image segmentation of the confocal images was performed following the established method described by Vincent and Soille (Reference Vincent and Soille1991) and Wu et al. (Reference Wu, Yan, McAdam, Banks, Zhang and Zhou2021). As shown in Supplementary Tables S1–S16, the area of each segmented cell from the gametophytes imaged at 0 and 48 hr was quantified using MATLAB software (2020b). The scale of each colour bar in each figure was specified in figure legends. The cells that divided or did not divide during the analysed period were determined based on the segmented time-lapse images over 48 hr and were labelled using MATLAB.
4.3. Quantification and statistical analysis
The centre of the meristem in each gametophyte was defined and included in the quantification (Figure 4, Supplementary Figures S10–S12). At 0 hr, the centre of the meristem—the centre group (highlighted with purple circles in Supplementary Figure S10)—included the wedge-shaped AC (labelled by red stars) and its adjacent progenies (labelled by black stars) and their surrounding cells (labelled with white dots). At 48 hr, the centre of the meristem (highlighted with purple circles in Supplementary Figure S11) included all the cells and their progenies from the centre group defined at 0 hr. All the other segmented cells (except trichomes) from each gametophyte were included in quantification as the group outside the centre (Figure 4, Supplementary Figures S10–S12). The division activity of the cells (except trichomes) at the centre of meristems or outside the centre in gametophytes (Figure 4i) was quantified using the following equations:
The percentage of cells that divided over 48 hr (at the centre of the meristem) = Number of cells (at the centre of the meristem) that divided over 48 hr / Number of total cells (at the centre of the meristem) at 0 hr x 100%;
The percentage of cells that divided over 48 hr (outside the centre) = Number of cells (outside the centre) that divided over 48 hr / Number of total cells (outside the centre) at 0 hr x 100%.
The increase of cell area in the meristems and gametophytes (except trichomes) (Figure 4j) was quantified using the following equations:
The relative total cell area (48/0 hr) in the centre of the meristem = area of total cells (including daughter cells) from the centre of the meristem (at 48 hr) / area of total cells from the centre of the meristem (at 0 hr) x 100%;
The relative total cell area (48/0 hr) outside the centre group = area of total cells (including daughter cells) from the group outside the centre (at 48 hr) / area of total cells from the group outside the centre (at 0 hr) x 100%.
To generate relative cell growth maps (Supplementary Figure S13), the area of each segmented cell at 0 and 48 hr (shown in Supplementary Tables S1–S16) was first calculated. Next, based on manually curated cell lineage information, the relative growth of cells was calculated using the cell areas data at 0 and 48 hr accordingly, using the following equation: The relative growth of each cell = [the cell area (including the area of its progenies) at 48 hr – the cell area at 0 hr] / the cell area at 0 hr. For the cell divided during the time interval, areas of its daughter cells were added up as the final cell area. Finally, the relative cell growth was plotted onto the segmented cells at 0 hr using MATLAB. The relative growth of each cell was quantitatively indicated by colours, with a scale from blue (0) to red ( $\geq$
1). Blue indicates zero relative growth, and red indicates 100% or above relative growth during the 48-hr interval.
$\geq$
1). Blue indicates zero relative growth, and red indicates 100% or above relative growth during the 48-hr interval.
4.4. Construction of the phylogenetic tree
The phylogenetic tree of nine fern species with the characterized AC division and growth in their gametophytes (Banks et al., Reference Banks, Hickok and Webb1993; Geng et al., Reference Geng, Yan and Zhou2022; Takahashi et al., Reference Takahashi, Hashino, Kami and Imaichi2009; Reference Takahashi, Kami, Morita and Imaichi2012; Reference Takahashi, Kami, Ota, Morita and Imaichi2015; Wu et al., Reference Wu, Yan, McAdam, Banks, Zhang and Zhou2021; Reference Wu, Yan, Yang, Banks, Zhang and Zhou2022) was generated, through PHYLOT (https://phylot.biobyte.de/index.cgi) as described previously (Geng et al., Reference Geng, Guo, Han, Liu, Banks, Wisecaver and Zhou2021b). Based on the search results from the NCBI taxonomy database (https://www.ncbi.nlm.nih.gov/Taxonomy/Browser/wwwtax.cgi), the homotypic synonym Odontosoria chinensis for S. chinensis and the homotypic synonym Leptochilus decurrens for C. decurrens were used as NCBI taxonomy IDs, for constructing the phylogenetic tree (Supplementary Figure S14) through PHYLOT.
Acknowledgements
The authors would like to thank the American Fern Society, Brian Aikins, and Gordon McNickle for kindly sharing the spores used in this study. The authors also thank Purdue Bindley Bioscience Facility for the access to the ZEISS LSM880 confocal microscope.
Financial support
This work was supported by funds from Purdue Centre for Plant Biology and by the National Science Foundation (grant number IOS-1931114) to Y.Z.
Conflicts of interest
The authors declare no conflict of interest.
Authorship contributions
Y.Z. conceived the research direction, X.W. performed all the live imaging experiments, X.W., X.L., S.Z., and Y.Z. discussed the experimental results, A.Y. and Y.Z. performed image analysis, X.W. performed the quantification and statistical analyses, X.W. and Y.Z. wrote the manuscript, A.Y., X.L. and S.Z. revised the manuscript, and all authors approved the manuscript.
Data availability statement
The data that support the results and conclusions of this study are available within the paper and its supplementary materials. Any other supporting information and the code are available from the corresponding author upon request.
Supplementary Materials
To view supplementary material for this article, please visit http://doi.org/10.1017/qpb.2022.21.


 Open access
Comments
Dear Editor,
We are submitting the manuscript titled “Quantitative live-imaging reveals dynamics of apical cells during fern gametophyte development” for publication in Quantitative Plant Biology as a research article.
All multicellular organisms face the same problem: how to specify and maintain different cell fates during continuous growth and development. Plant meristems represent an ideal model to address this fundamental question, because they contain self-renewing stem cells that maintain themselves undifferentiated, while continuously adding new cells that eventually form differentiated organs.
Land plants alternate between the generations of asexual sporophytes and sexual gametophytes. Sporophytes of seed plants develop meristems that sustain organ formation and shape plant architecture, while gametophytes of seed plants are dependent on their sporophytes and are lacking meristems. In contrast, gametophytes and sporophytes of seed-free vascular plants, including ferns, are independent of each other, and fern gametophytes develop pluripotent meristems to drive independent growth. Furthermore, meristems of seed-free plants usually develop one single tetrahedral (pyramid-shaped) or wedge-shaped apical cell (AC) as the initial, which is lacking in seed plants. To date, it remains unclear how the AC promotes cell proliferation in fern gametophytes. It is also unknown whether any long-lived AC exists in fern gametophytes to continuously sustain prothallus development and determine gametophyte morphology.
To tackle this question, we used Sphenomeris chinensis, the lace fern as a research system to quantitatively determine the AC dynamics in fern gametophytes. Frist, we identified the long-lived AC during Sphenomeris chinensis gametophyte development, which is different from the previously characterized, transiently present ACs in gametophytes of many other fern species. Through confocal time-lapse imaging, computational image analysis, and quantification of cell size, expansion and division activity, we then determined unique patterns of cell growth and division that maintain the homeostasis of the persistent AC and its immediate progenies. We also uncovered a linkage among the small cell size, active cell division and expansion, and cell position in fern gametophytes, suggesting a previously undefined mechanism underlying AC proliferation in fern gametophytes. Furthermore, we found the maintenance of long-lived ACs in gametophytes, though not conserved for all the fern species, is a shared character among different fern taxa.
All these findings provide quantitative insight into the cellular basis and evolution of meristems in seed-free plant lineages, and they suggest both conserved and diversified mechanisms underlying meristem and gametophyte development across land plants. We think this work is of broad interest to the general plant biology research community.
Thank you so much for your consideration!
Best,
Yun Zhou Ph. D.
Assistant Professor
Department of Botany and Plant Pathology
Center for Plant Biology, Purdue University