1. Introduction
The active galactic nucleus (AGN) of a radio galaxy has a typical lifetime on the order of approximately 108 yr (Cordey Reference Cordey1986). These finite lifetimes give rise to an observationally rare stage of a radio galaxy’s life where the radio plasma forming the lobes may remain visible after the core has shut down and the supply of freshly accelerated plasma provided to the lobes by the resultant jets has ceased. As energy loss due to synchrotron radiation is proportional to square of the electron energy, the highest energy electrons lose energy more quickly (see Pacholczyk Reference Pacholczyk1970), and these remnant lobes are usually observed with steep spectral indices, α,Footnote a above some time-dependent break frequency (Parma et al. Reference Parma, Murgia, de Ruiter, Fanti, Mack and Govoni2007; Murgia et al. Reference Murgia2011; de Gasperin et al. Reference de Gasperin, Intema, Williams, Brüggen, Murgia, Beck and Bonafede2014; Brienza et al. Reference Brienza2016). Such dying sources have predominantly been found within the dense environment of galaxy clusters where it is thought the external pressure from the intra-cluster medium is able to stall the dissipation of the lobes (Murgia et al. Reference Murgia2011). However, examples of dead and dying radio sources outside of clusters have been found (e.g. de Gasperin et al. Reference de Gasperin, Intema, Williams, Brüggen, Murgia, Beck and Bonafede2014; Brienza et al. Reference Brienza2016), and such sources in underdense environments have the potential to reach sizes in excess of >700 kpc becoming so-called giant radio galaxy (GRG; e.g. Saripalli et al. Reference Saripalli, Hunstead, Subrahmanyan and Boyce2005). A GRG with an active AGN located in the field is expected to have a low-surface brightness, and a dying, fading source much more so. Before the advent of low-frequency radio interferometers such as the Murchison Widefield Array (MWA; Tingay et al. Reference Tingay2013; Bowman et al. Reference Bowman2013) and the LOw-Frequency ARray (LOFAR; van Haarlem et al. Reference van Haarlem2013), such sources—except in rare cases—were rendered mostly undetectable due to their steep spectra in the gigahertz regime (see e.g. Cordey Reference Cordey1987; Giovannini et al. Reference Giovannini, Feretti, Gregorini and Parma1988).
A second class of radio galaxy with—at present—low known numbers are dust-rich disk galaxies (lenticular and spiral) with large-scale radio lobes. Radio-loud AGN typically resides within large elliptical galaxies, whereas the denser material within spiral and lenticular galaxies may impede jet propagation, resulting in the sub-kpc-scale jets often seen in Seyfert AGN (e.g. Ulvestad, Wilson, & Sramek Reference Ulvestad, Wilson and Sramek1981; Gallimore et al. Reference Gallimore, Axon, O’Dea, Baum and Pedlar2006). At present there are only nine spiral (Ledlow, Owen, & Keel Reference Ledlow, Owen and Keel1998; Hota et al. Reference Hota2011; Bagchi et al. Reference Bagchi2014; Mao et al. Reference Mao2015; Singh et al. Reference Singh, Ishwara-Chandra, Sievers, Wadadekar, Hilton and Beelen2015; Mulcahy et al. Reference Mulcahy2016) and four lenticular (Burbidge & Burbidge Reference Burbidge and Burbidge1957; Cooper, Price, & Cole Reference Cooper, Price and Cole1965; Ekers et al. Reference Ekers, Goss, Kotanyi and Skellern1978; Johnston-Hollitt et al., submitted) galaxies hosting large-scale radio emission, and the cause of their lack of detection is not clear as their radio powers, while lower on average than equivalent size radio galaxies, are still high enough to be detected by most radio instruments (Johnston-Hollitt et al., submitted).
NGC 1534 is a lenticular galaxy at a redshift of z = 0.017816 (da Costa et al. Reference da Costa, Pellegrini, Davis, Meiksin, Sargent and Tonry1991) and is part of the HDC 269 and LDC 292 galaxy groups (Crook et al. Reference Crook, Huchra, Martimbeau, Masters, Jarrett and Macri2007). Hurley-Walker et al. (Reference Hurley-Walker2015) serendipitously discovered remnant radio emission surrounding NGC 1534 with the MWA. The large field of view of the observation and the sensitivity to large-scale structure enabled its detection. The low-surface brightness sensitivity of the MWA is due to the large number of short baselines between the antenna tiles, with a minimum baseline length of 7.7 m and 689 baselines <60 m. In Phase I, the MWA had a maximum baseline of 2 873.3 m, which at the MWA operating frequencies results in arcmin-scale synthesised beams. Despite this resolution limitation, large-scale extended structures can be studied in great detail due to the instrument’s large fractional bandwidth, with individual observations able to observe with instantaneous bandwidths of 30.72 MHz. Hurley-Walker et al. (Reference Hurley-Walker2015) considered the remnant radio plasma most likely associated with NGC 1534, considering it to be ancient lobes from a past cycle of core activity. This conclusion was motivated by the steep spectral index found, $\alpha_{185}^{843} = -2.1$
, along with the general agreement in alignment between NGC 1534 and the remnant emission.
$\alpha_{185}^{843} = -2.1$
, along with the general agreement in alignment between NGC 1534 and the remnant emission.
In this paper, we present follow-up observations of the source with the Australia Telescope Compact Array (ATCA; Frater, Brooks & Whiteoak Reference Frater, Brooks and Whiteoak1992) in the 16-cm (2.1 GHz) and 15-mm (17 and 19 GHz) bands as well as a complementary low-frequency analysis with data from the GaLactic and Extragalactic All-sky MWA survey (GLEAM; Wayth et al. Reference Wayth2015).
This paper assumes a flat Λ cold dark matter (CDM) cosmology, with H 0=67.7 km s−1 Mpc−1, Ω m =0.307, and ΩΛ=1-Ω m (Planck Collaboration et al. 2016). At the redshift of NGC 1534, 1 arcmin corresponds to 22.4 kpc. For the calculation of image rms noise, we use the Background and Noise Estimation tool, bane,Footnote b part of the AegeanTools software package (Hancock et al. Reference Hancock, Murphy, Gaensler, Hopkins and Curran2012; Hancock, Trott & Hurley-Walker Reference Hancock, Trott and Hurley-Walker2018).
2. Data
2.1. Megahertz frequencies—MWA
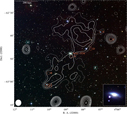
The remnant emission surrounding NGC 1534 was originally detected serendipitously with the MWA at 185 MHz during a calibration pointing towards PKS B0408-658 (Hurley-Walker et al. Reference Hurley-Walker2015). We confirm the detection of the emission with data spanning 72–231 MHz from the GLEAM survey. GLEAM is a recently completed survey of the southern sky (δJ2000<+25) performed with the Phase I MWA using a drift scan imaging method to reduce primary beam calibration issues (Wayth et al. Reference Wayth2015). The survey covers the frequency range 72–231 MHz with a declination- and band-dependent synthesised beam and sensitivities. One of the main products of the survey is the availability of three 30.72-MHz bandwidth wideband images (hereafter 30-MHz subband images) as well as a single, more sensitive 60-MHz wideband image centred on 200.315 MHz (hereafter the 200-MHz band/image). Currently, imaging has been performed with a robust parameter of —1 in the ‘Briggs’ weighting scheme (Briggs Reference Briggs1995)—close to uniform weighting. The remnant radio emission is detected in the 200-MHz image. Figure 1 shows the 200-MHz contours overlaid on the Red-green-blue (RGB) optical image from the Digitised Sky Survey (DSS2). Additionally, the emission is detected in the three 30-MHz wideband images providing additional flux densities across the MWA band. GLEAM image properties are summarised in Table 1 and full imaging details can be found in Hurley-Walker et al. (Reference Hurley-Walker2017).
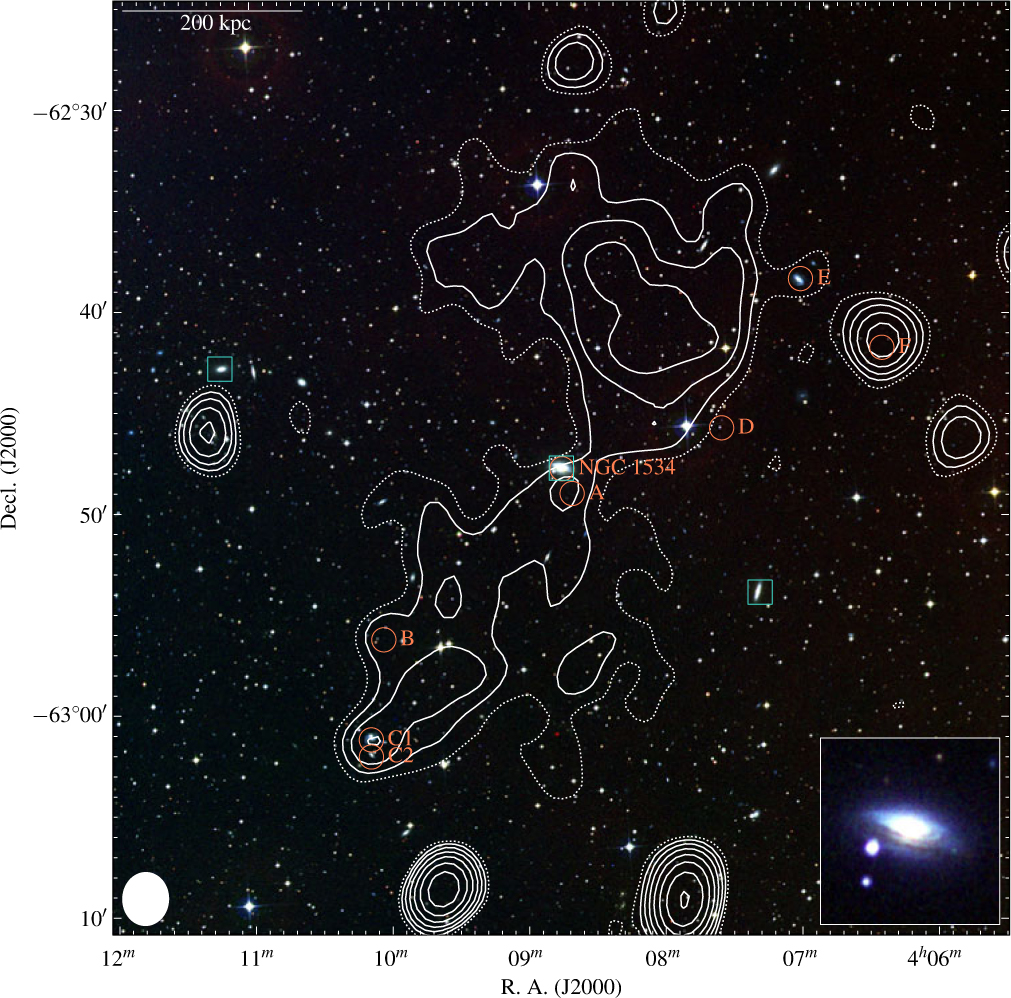
Figure 1. The region surrounding NGC 1534. The background is an RGB image formed using the IR, red, and blue bands of the Digitized Sky Survey 2 (DSS2), and the contours overlaid are from the GLEAM survey at 200 MHz. Solid, white contours begin at 42.2 mjy beam−1 (3σrms) increasing with $\sqrt{2}$
. The dotted white contour is at 2σrms. The GLEAM data will be discussed in Section 2.1. The linear scale is at the redshift of NGC 1534, and the inset is an RGB image formed using images generated by SuperCOSMOS (Hambly et al. Reference Hambly2001a; Hambly, Irwin & MacGillivray Reference Hambly, Irwin and MacGillivray2001b; Hambly et al. Reference Hambly, Davenhall, Irwin and MacGillivray2001c). Various sources are marked in the figure: orange circles are those that show significant radio emission that may add to low-resolution flux density measurements, discussed in Section 3.1; cyan squares are part of the group HDC 269, discussed in Section 4.3. Other sources detected in the GLEAM image in this field are miscellaneous radio sources not discussed here. The white ellipse is the shape of the synthesised beam of the GLEAM data.
$\sqrt{2}$
. The dotted white contour is at 2σrms. The GLEAM data will be discussed in Section 2.1. The linear scale is at the redshift of NGC 1534, and the inset is an RGB image formed using images generated by SuperCOSMOS (Hambly et al. Reference Hambly2001a; Hambly, Irwin & MacGillivray Reference Hambly, Irwin and MacGillivray2001b; Hambly et al. Reference Hambly, Davenhall, Irwin and MacGillivray2001c). Various sources are marked in the figure: orange circles are those that show significant radio emission that may add to low-resolution flux density measurements, discussed in Section 3.1; cyan squares are part of the group HDC 269, discussed in Section 4.3. Other sources detected in the GLEAM image in this field are miscellaneous radio sources not discussed here. The white ellipse is the shape of the synthesised beam of the GLEAM data.
Table 1. Properties of the wide GLEAM subbands
The central frequency, νc, is that specified in the image cube header of the survey products. The rms noise, σrms, is calculated at the reference pixel of the image cube images, which are centred on NGC 1534.
2.2. ATCA observations at 2.1 GHz
ATCA observations with the Compact Array Broadband Backend (CABB; Wilson et al. Reference Wilson2011) of the remnant emission and NGC 1534 were carried out at 2.1, 17, and 19 GHz. Table 2 summarises the properties of the observations. The 2.1-GHz observations were carried out in 2014 and 2017 with the EW367 and H75 (PI Johnston-Hollitt), and H168 (PI Duchesne) configurations as part of project code CX287. PKS B1934-638 is used as the bandpass, gains, and flux calibrator, and PKS B0302-623 is used for phase calibration for the EW367 and H75 observations and PKS 0407-658 is used for the H168 observation. The use of PKS 0407-658 resulted in a loss of all antenna 6 data from this observation as the longer baselines show structure in the calibrator. Additionally, antenna 4 was unavailable for the 2.1-GHz H168 observations due to maintenance. Observations were performed as a three-pointing mosaic to ensure the full extent of the emission was covered.
Table 2. Details for the ATCA observations
The scan time for mosaics is given as the total scan time for all three pointings. The frequency, ν, is the observing frequency. A 2-GHz bandwidth is used for each observing frequency.
2.2.1. Calibration and flagging
Data reduction follows standard reduction procedure using the software package miriad (Sault, Teuben & Wright Reference Sault, Teuben, Wright, Shaw, Payne and Hayes1995). In the following, we briefly outline the process. The data are imported into miriad and bands with known Radio-frequency interference (RFI) or self-generating interference are flagged, along with the 40 edge channels of the initial 2 049 due to bandpass rolloff. The 2.1-GHz data are split into four subbands centred at 1 510, 1 942, 2 375, and 2 807 MHz, which are chosen to be 432 MHz to give equal frequency coverage based on the non-flagged channels. Calibration, and further RFI flagging, is performed for each of the subbands and pointings individually. We find that the lowest subband, at 1 510 MHz, is more heavily affected by RFI reducing the usable data and resulting in a lessened sensitivity compared to the other bands. This is a common problem in the 1 100–1 400 MHz part of the 2.1-GHz band for the ATCAFootnote c and has been noted by several authors (e.g. Martinez Aviles et al. Reference Martinez Aviles2016, Reference Martinez Aviles2018; Shakouri, Johnston-Hollitt & Pratt Reference Shakouri, Johnston-Hollitt and Pratt2016). RFI flagging makes use of the miriad task pgflag, which utilises the SumThreshold method for detecting RFI in the u–v data (Offringa et al. Reference Offringa, van de Gronde and Roerdink2012). Calibration follows by first solving for complex gains and bandpass using the appropriate calibrator, then solving for complex gains and leakages on the secondary calibrators, finally applying a fluxscale correction based on PKS B1934-638 and copying calibration solutions to the NGC 1 534 pointings. After data are calibrated and flagged, we use a number of imaging processes to make subband and full-band images. Figure 2 shows the combined u–v coverage for a single pointing (Pointing 1) of the combined EW367, H75, and H168 data for the 1 510-MHz subband after flagging.
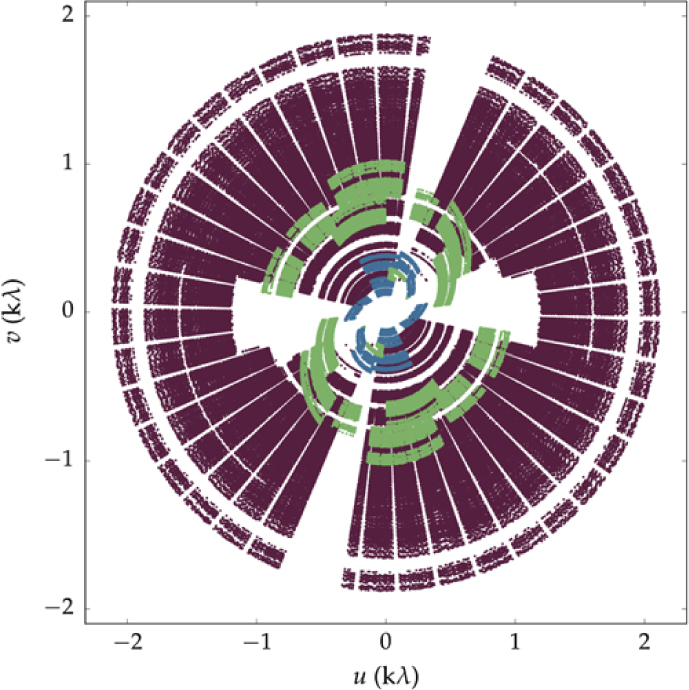
Figure 2. The u–v coverage for a single pointing of the combined EW367 (mauve), H75 (blue), and H168 (green) mosaic observations excluding antenna 6. Note that antenna 2 is missing from all H75 data, and antenna 4 is missing from all H168 data. This is for the 1 510-MHz subband which features the most visibility flagging due to RFI.
2.2.2. High-resolution imaging
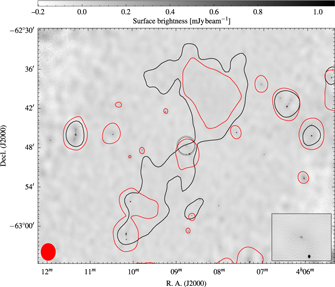
The first set of subband images we produced use the full set of visibilities and use a ‘Briggs’ weighting scheme with robust parameter of 0 giving a balance between resolution and sensitivity. As the synthesised beam changes considerably across the bands, we use the multi-frequency deconvolution task, mfclean (Sault & Wieringa Reference Sault and Wieringa1994). After deconvolution, we perform one cycle of phase-only self-calibration, CLEANing for more iterations in the second run of mfclean. For the mosaic observation, this procedure is performed for each pointing, and the clean models, beam, and dirty maps are individually combined via the task restor. Finally the pointings are linearly mosaicked together with the task linmos. We also created a stacked full-band image by combining each pointing and subband image which maximises sensitivity which is shown in Figure 3. The properties of images produced are listed in Table 3. The remnant lobe emission is not detected though we find that NGC 1534 itself is detected across the 2.1-GHz band.
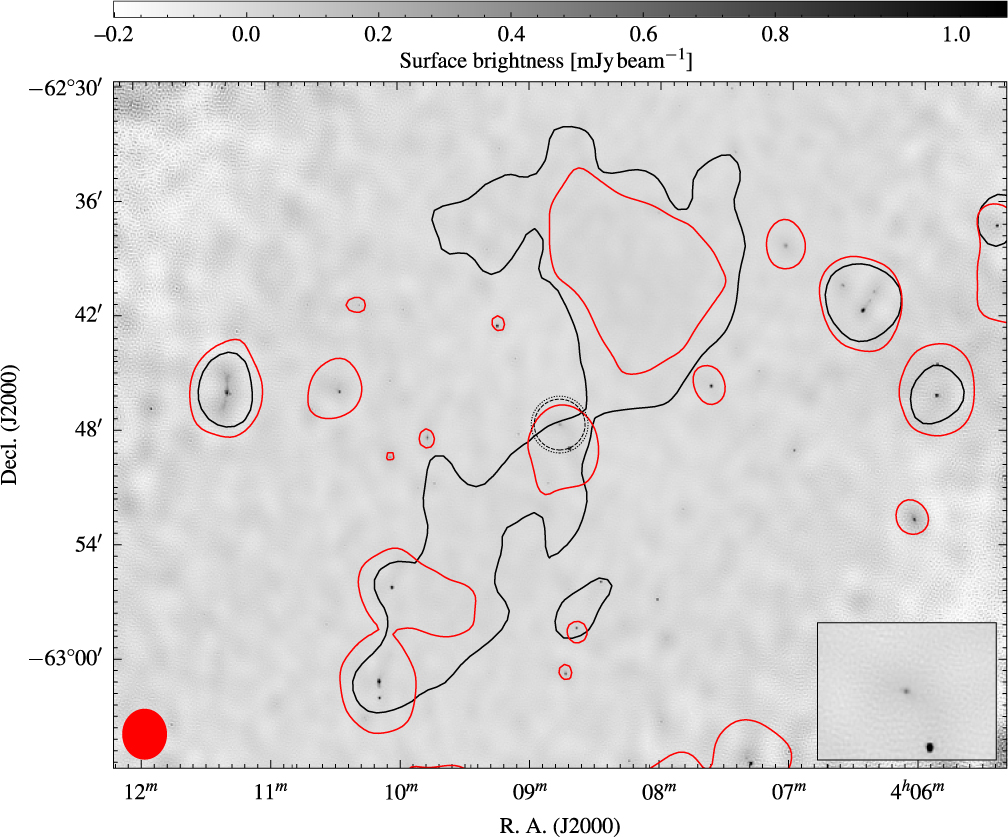
Figure 3. High-resolution, stacked 2 200-MHz ATCA image. The single, black contour is the GLEAM 200-MHz image at 43 mjy beam−1, and the single, red contour is the low-resolution 1 510-MHz ATCA image at 1.41 mjy beam−1. The red ellipse in the lower left is the beam shape of the low-resolution 1 510-MHz image, and the black, dotted, and dashed circles at the centre are the primary beams at 17 and 19 GHz, respectively. The inset shows this same central region.
Table 3. ATCA image properties
The rms noise is the average at the centre of the map, as calculated by bane. For the 2 200-MHz full-band image the higher-resolution, normally weighted images are convolved to a common beam shape (approximately equivalent to the 1 510-MHz subband). The max. angular scale is estimated from the minimum baseline of the H75 array (43 m without antenna 2) for the 2.1-GHz band images. Note that medium- and low-resolution images use a robust parameter of +0.5 whereas higher-resolution images use a robust parameter of 0. Values in parenthesis are for (medium-resolution) and [low-resolution] images.
a Medium- and low-resolution images have common beam shapes, unless otherwise specified: (88 arcsec × 78 arcsec) [157 arcse c× 136 arcsec].
b For 88 arcsec × 73 arcsec images.
2.2.3. Lower-resolution imaging
We also made two sets of images without antenna 6 (hence removing baselines >367 m) to maximise sensitivity to large-scale structures. The procedure is the same as for the high-resolution images except we use a robust parameter of +0.5 to further increase sensitivity at a small cost to beam shape and do not phase calibrate, as the significant residual phase errors were only present on baselines involving antenna 6. We designate this first set as ‘medium-resolution’ images and they have a common beam size of 88 arcsec×73 arcsec. The second set of images follows the first, but were convolved with a Gaussian kernel to match the resolution of the 200-MHz GLEAM wideband from which we measure the flux density of the remnant emission. These images are designated as ‘low resolution’ and they have a common beam size of 157 arcsec × 136 arcsec. The northern emission is well-detected in the 1 510- and 1 942-MHz low- and medium-resolution images, though approaches the 3σrms detection limit in the 2 375- and 2 807-MHz images. Figure 4 shows the 1 510-MHz medium-resolution image with the northern emission visible. The emission from the southern lobe is also detected in the 1 510-MHz medium- and low-resolution images. The image properties are listed in Table 3.
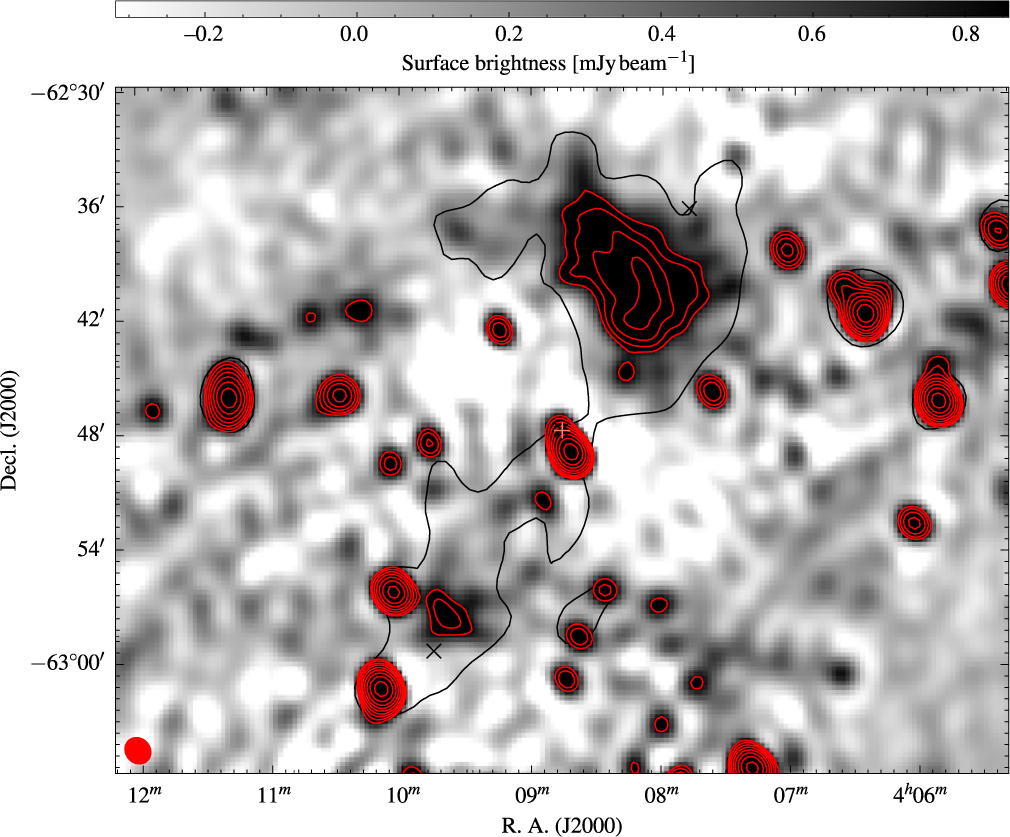
Figure 4. Medium-resolution (88 arcsec × 73 arcsec) 1 510-MHz subband ATCA image. The single, black contour is as in Figure 3. The red contours are the 1 510-MHz medium-resolution image, beginning at 810 µjy beam−1 and increasing with factors of
$\sqrt{2}$
. The red ellipse in the lower left is the beam shape of the 1 510-MHz image. The black crosses are the mosaic pointing centres, and the orange ‘+’ indicates the position of NGC 1534.
2.3. ATCA observations at 17 and 19 GHz
Complementary to the 2.1-GHz observations of the entire source, an observation at 17 and 19 GHz of the core of NGC 1534 was carried out with the H168 configuration in 2016 (Project Code CX366; PI Hurley-Walker). This was a single pointing, with NGC 1534 at the phase centre. The primary beam in this band is significantly smaller and only encompasses NGC 1534 and the nearby radio source, Sydney University Molonglo Sky Survey (SUMSS) J040841-624908 (Source A in Figure 1). These observations were performed in an attempt to constrain the spectral index of NGC 1534, the putative host of the radio emission. This observation similarly used PKS B1934-638 for flux calibration, though required PKS B1921-293 for bandpass calibration and PKS B0516-621 for both phase and pointing calibration. The observation details are presented in Table 2.
2.3.1. Calibration, flagging, and imaging
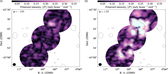
The 17- and 19-GHz data reduction followed a similar procedure to the 2.1-GHz reduction, though RFI is less problematic and subbands are not made due to the smaller fractional bandwidth. As with the 2.1-GHz data, we make high-resolution, robust 0 images as well as medium-resolution, robust +0.5 images without antenna 6. The 17-GHz images are shown in Figure 5, and image properties are listed in Table 3. Note that there was no emission detected in the 19-GHz image and thus it is not considered any further.
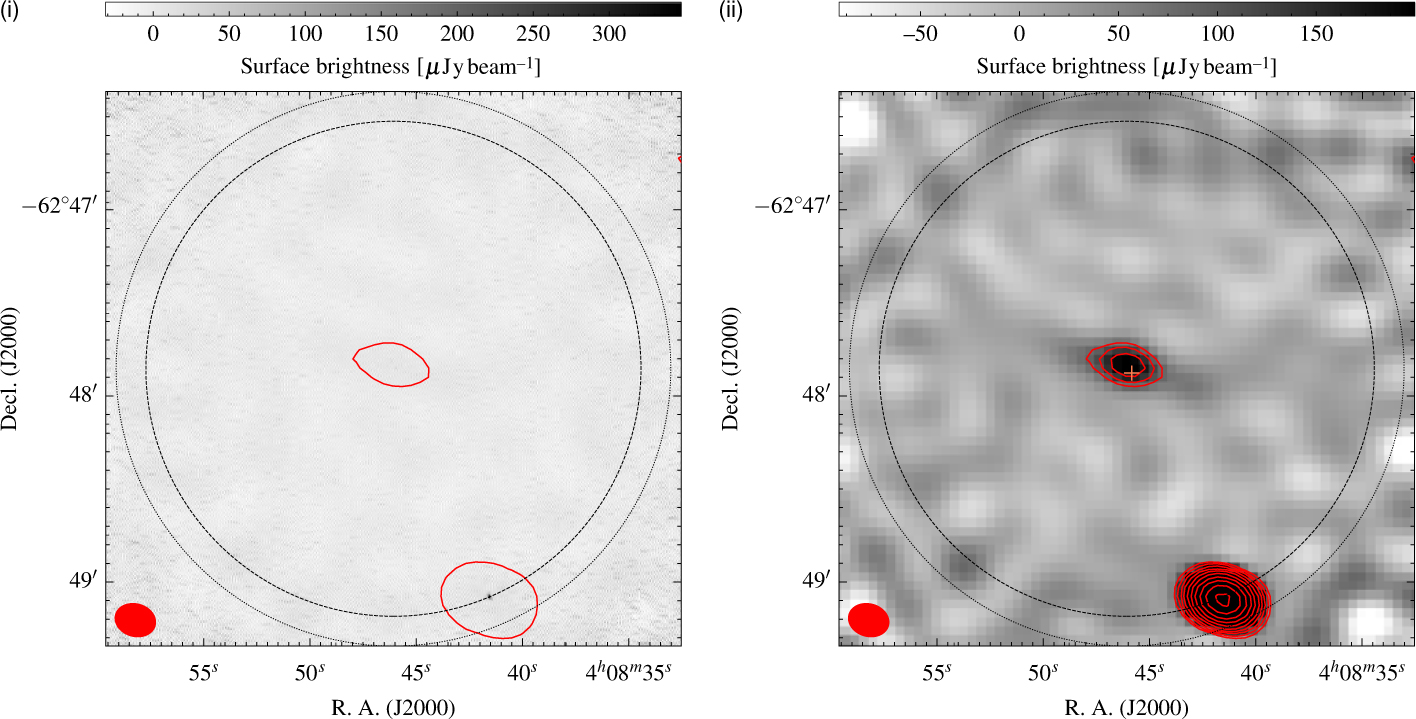
Figure 5. Seventeen gigahertz ATCA images. (i) High-resolution, robust 0 image. (ii) Medium-resolution, robust +0.5 image. The red contour(s) in both images are of the medium-resolution 17-GHz image starting at 84 µjy beam−1. The dotted and dashed circles are the Full-width at half maximum (FWHM) of the ATCA primary beam at 17 and 19 GHz, respectively, and the red ellipse in the lower-left corner is the beam shape of the 17-GHz medium-resolution image. The orange ‘+‘ in (ii) is the position of NGC 1534.
3. Analysis
3.1. Radio flux density
We measured the integrated radio flux density of the remnant emission from the GLEAM subbands and also estimated limits from the 2.1-GHz ATCA data. We begin by estimating contribution of flux density from interloping radio sources.
3.1.1. Interloping radio sources
We measure the flux densities of the sources labelled in Figure 1 across our ATCA subband images, as well as from 843-MHz data taken from the SUMSS (Bock, Large & Sadler Reference Bock, Large and Sadler1999; Mauch et al. Reference Mauch, Murphy, Buttery, Curran, Hunstead, Piestrzynski, Robertson and Sadler2003). Table 4 summarises the flux density measurements and spectral indices, and gives the names of the sources. Figure 6 plots the spectral energy distribution (SED) of each source. Source E is not a point source at the full resolution of the ATCA images and so we measure flux densities for this source from the low-resolution ATCA subbands, and Source F has extended emission to the north west in the high-resolution ATCA images. We use two methods for source measurements: for confirmed point sources, we utilise the source-finding, measuring, and characterising software, aegean (Hancock et al. Reference Hancock, Murphy, Gaensler, Hopkins and Curran2012, Reference Hancock, Trott and Hurley-Walker2018) with a detection threshold of 6σrms and source growth threshold of 3σrms. Thus we are making sure sources are detected above 6σrms and that they are being measured out to 3σrms. For other sources we use an in-house python code to identify connected pixels that comprise an extended source—using a flood-fill algorithm as in aegean and measuring integrated flux density in the same manner as the source-finding software duchamp (Whiting Reference Whiting2012). Error calculations are made using rms maps generated by bane, allowing the rms to vary across the source, yielding
 \begin{equation}{\sigma _{{S_\nu }}} = \sqrt {{{\left( {{\kern 1pt} f{\kern 1pt} {S_\nu }} \right)}^2} + {{\left( {\sum\limits_i {\sigma _{p,i}}} \right)}^2}} \quad [{\rm{Jy}}],\end{equation}
(1)
\begin{equation}{\sigma _{{S_\nu }}} = \sqrt {{{\left( {{\kern 1pt} f{\kern 1pt} {S_\nu }} \right)}^2} + {{\left( {\sum\limits_i {\sigma _{p,i}}} \right)}^2}} \quad [{\rm{Jy}}],\end{equation}
(1)
where σ p,i is the rms at a specific pixel in Jy pixel−1, and f the additional uncertainty for the flux scale/calibration uncertainties of the specific map.
Table 4. Spectral properties of sources marked in Figure 1
These sources, along with the core of NGC 1534, are the main sources of additional flux density GLEAM images. Integrated flux densities in the ATCA subbands are measured down to 3σrms, where σrms is computed for each pixel by bane except in the case of NGC 1534 where we measure down to 2σrms. The spectral index is calculated between the lowest- and highest-frequency measurements. Dashes in the flux density columns indicate no measurement available. 843-MHz measurements are made using aegean/python except for Sources C1 and C2.
a Total flux density of C1 and C2 from the SUMSS catalogue (Murphy et al. Reference Murphy, Mauch, Green, Hunstead, Piestrzynska, Kels and Sztajer2007); not used in fitting the spectral index.
b Total flux density of Source F and nearby sources; not used in fitting.
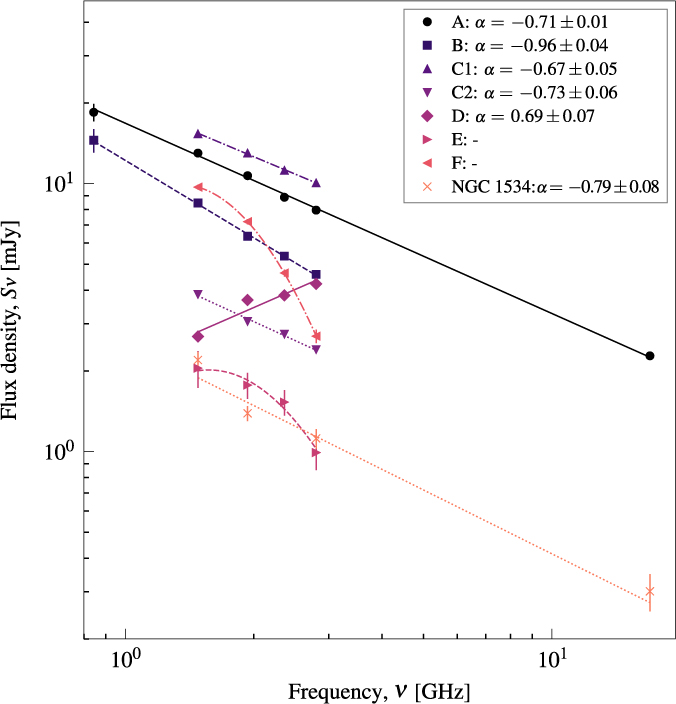
Figure 6. The SEDs of sources within the remnant emission. The data are also presented in Table 4.
Source A is a curious case as measuring the peak flux density and comparing to the integrated flux density shows a significant discrepancy in the SUMSS data. The integrated flux density is lower, at S843±2 mJy (cf. 843-MHz peak flux density measurement in Table 4). The discrepancy is likely due to the source’s location within a negative bowl resulting in an underestimated flux density measurement. For consistency, we measure the peak flux density values of Source A for all measurements, and note that in all images Source A is unresolved. Further, Source A is at the edge of the 19-GHz primary beam, thus we do not measure the flux density in this band. For the emission from NGC 1534, the full-resolution ATCA images show little nuclear activity, but detect extended emission in the disk of the galaxy, likely from star formation. We note the lower sensitivity of the 2 375-MHz image made measurement of the NGC 1534 emission problematic and no measurement there is provided. Most of the sources show typical power law spectra of radio galaxies, with SEDs fit by
 \begin{equation}{S_\nu } = C{\nu ^\alpha },\end{equation}
(2)
\begin{equation}{S_\nu } = C{\nu ^\alpha },\end{equation}
(2)
where α is the spectral index and C the flux normalisation. For Sources E and F, the SEDs show significant curvature and are fit by a generic curved power law model of the form:
 \begin{equation}{S_\nu } = C{\nu ^\alpha }{{\rm{e}}^{q{{\left( {\ln \nu } \right)}^2}}},\end{equation}
(3)
\begin{equation}{S_\nu } = C{\nu ^\alpha }{{\rm{e}}^{q{{\left( {\ln \nu } \right)}^2}}},\end{equation}
(3)
where α is the equivalent spectral index in the case of no curvature and q is the curvature index (e.g. Duffy & Blundell Reference Duffy and Blundell2012; Callingham et al. Reference Callingham2017). In Table 4 we only report the power law index when using Equation (2).
Fitting is done via non-linear weighted least squares methods using the Levenberg–Marquardt algorithm implemented in lmfit (Newville et al. Reference Newville, Stensitzki, Allen and Ingargiola2014). The errors on the flux density measurements are the quadrature sum of the aegean/python measurements with the percentage uncertainty associated with the maps [as in Equation (1) for the in-house python code]. For the ATCA, this is 2% (see e.g. Venturi et al. Reference Venturi, Bardelli, Morganti and Hunstead2000; Johnston-Hollitt et al. Reference Johnston-Hollitt, Sato, Gill, Fleenor and Brick2008), and for the SUMSS map this is 3% (Mauch et al. Reference Mauch, Murphy, Buttery, Curran, Hunstead, Piestrzynski, Robertson and Sadler2003).
The power law model fit for NGC 1534 suggests a 1.4-GHz flux density of 1.97±0.15. This translates to a 1.4-GHz power of P1.4=(1.5±0.1)×1021 W Hz−1.
3.1.2. The remnant radio emission
We measure the integrated flux densities of the northern lobe from the GLEAM wideband images as well as the 1 510- and 1 942-MHz low-resolution ATCA images. Due to the blended nature of compact and extended emission within the southern lobe at MWA frequencies, we measure the integrated flux densities of the total emission in the GLEAM images, subtracting the northern lobe contribution for the initial estimate of the flux density of the southern lobe. As the southern lobe is only well-detected, and not blended in the 1 510-MHz medium-resolution image, we measure it there. 2 375- and 2 807-MHz lower limits are placed on the northern lobe based on vague detection at 2σrms. Similarly, a lower limit at 1 942 MHz is placed on the southern lobe, though 2 375- and 2 807-MHz upper limits are not estimated here due to confusion with compact sources.
Flux densities for the extended emission are measured using the in-house python code, where we limit measured pixels to those above 2σrms. This σrms cut is chosen for consistency with Hurley-Walker et al. (Reference Hurley-Walker2015) and because we have prior knowledge that the emission is of particularly low-surface brightness. We consider the rms noise on a pixel-by-pixel basis using bane. bane uses sparse pixel grids to account for instances where noise may change rapidly across the image. Uncertainties in flux density measurements are given by Equation (1). We use the model parameters of the interloping sources to extrapolate to MWA frequencies for subtraction from GLEAM images, where appropriate. This is not necessary for the ATCA subband images as no significant interloping sources are found within the emission region at these frequencies. Table 5 summarises the measured flux densities, with additional literature data measured by Hurley-Walker et al. (Reference Hurley-Walker2015) from SUMSS (Bock et al. Reference Bock, Large and Sadler1999; Mauch et al. Reference Mauch, Murphy, Buttery, Curran, Hunstead, Piestrzynski, Robertson and Sadler2003), a reprocessed Molonglo Reference Catalogue image (Large et al. Reference Large, Mills, Little, Crawford and Sutton1981), and an upper limit from CHIPASSFootnote d (Calabretta, Staveley- Smith & Barnes Reference Calabretta, Staveley-Smith and Barnes2014). Using the 200-MHz GLEAM image and the 1 510-MHz low-resolution ATCA image, we estimate the projected size of the emission assuming it is indeed emission associated with NGC 1534. The projection separation between the peaks in the northern and southern lobes is approximately 20 arcmin which translates to a projected linear size of approximately 450 kpc at the redshift of NGC 1534. This is smaller than the size found by Hurley-Walker et al. (Reference Hurley-Walker2015) though their estimate includes Source C1/C2 and extends further north. We do not include Source C1/C2 as there is no evidence that the emission continues beyond the southern peak at 1 510 MHz. However, the emission may continue further northwest, in which case the projected size may be up to approximately 610 kpc. We cannot be sure this is the case, as there are a number of faint point sources which may be contributing to the morphology of the emission at the northwestern end.
Table 5. Flux density measurements of the total, northern, and southern lobe emission
Flux densities are measured out to 2σrms as per Hurley-Walker et al. (Reference Hurley-Walker2015).
a This work.
b Hurley-Walker et al. (Reference Hurley-Walker2015).
3.1.3. The SED
In the frequency regime measured here, the SED is not described by a simple power law model, and instead we consider the continuous injection (CI) models (Kardashev Reference Kardashev1962; Pacholczyk Reference Pacholczyk1970; Jaffe & Perola Reference Jaffe and Perola1973) implemented in the Broadband Radio Astronomy ToolS (BRATS; Harwood et al. Reference Harwood, Hardcastle, Croston and Goodger2013; Harwood, Hardcastle, & Croston Reference Harwood, Hardcastle and Croston2015) package.Footnote e The standard CI model is fit under the assumption that the magnetic field is in equipartition with the emitting electron population. We assume that the AGN has switched off, as the ATCA data suggest no prominent nuclear activity—hence, we fit the CIoff model which describes remnant radio emission described in Komissarov & Gubanov (Reference Komissarov and Gubanov1994) as a modification to the CI model as described in Jaffe & Perola (Reference Jaffe and Perola1973). For CIoff fitting we assume the emission is at the redshift of NGC 1534.
In fitting we require an injection index, αinj = (1-δinj)/2, that describes the observed emission from a CI of fresh electrons with a power law energy distribution of index δinj, assuming synchrotron and inverse-Compton losses. Figure 7 shows power law fits to the GLEAM subband data from which we obtain αinj, which is valid if a break frequency, νb , occurs above this regime, further motivated by no clear break seen across the GLEAM bands. We also require an estimate of the equipartition magnetic field, B eq. The choice of B eq is motivated by Equation (2) of Miley (Reference Miley1980) and from Jamrozy et al. (Reference Jamrozy, Klein, Mack, Gregorini and Parma2004) we use
 \begin{equation}{B_{{\rm{eq}}}} = 7.91{\left[ {{{1 + k} \over {{{\left( {1 + z} \right)}^{\alpha - 3}}}}{S \over {{\nu ^\alpha }{\theta _x}{\theta _y}l}}{{\nu _{{\rm{max}}}^{\alpha + {1 \over 2}} - \nu _{{\rm{min}}}^{\alpha + {1 \over 2}}} \over {\alpha + 0.5}}} \right]^{{2 \over 7}}}[\mu G],\end{equation}
(4)
\begin{equation}{B_{{\rm{eq}}}} = 7.91{\left[ {{{1 + k} \over {{{\left( {1 + z} \right)}^{\alpha - 3}}}}{S \over {{\nu ^\alpha }{\theta _x}{\theta _y}l}}{{\nu _{{\rm{max}}}^{\alpha + {1 \over 2}} - \nu _{{\rm{min}}}^{\alpha + {1 \over 2}}} \over {\alpha + 0.5}}} \right]^{{2 \over 7}}}[\mu G],\end{equation}
(4)
where k is the relativistic proton–electron energy ratio, θx and θy are the size of the source on the sky in arcseconds, l is the line-of-sight depth, and ν max and ν min are the integration bounds for the luminosity and are chosen to be ν max=100 GHz and ν min=0.01 GHz. Here we choose k to be 100 (e.g. Moffet Reference Moffet1975) though could be anywhere between 1 and 2 000 (Pacholczyk Reference Pacholczyk1970). The choice of k is not overly important as the impact in this range is a change of less than an order of magnitude (0.9 µG ≲ Beq ≲ 6 µG for 1 ≤k ≤ 2000). We estimate the size of the northern lobe as θx = 570 arcsec, θy = 340 arcsec on the sky and we assume a line-of-sight depth of l = 127 kpc. We choose 118 MHz as the reference frequency and assume α = α inj. We estimate Beq ≈ 2.7 µG for the northern lobe, and in the absence of indication of any asymmetry in the environment that would result in lobe asymmetry we make the assumption that the southern lobe has an equivalent magnetic field strength, as we cannot estimate its magnetic field via Equation (4) without better knowledge of the extent of the emission (see e.g. Figures 1, 3, and 4). We will only report here on the northern lobe fitting results, though for completeness show all fits in Figure 7.
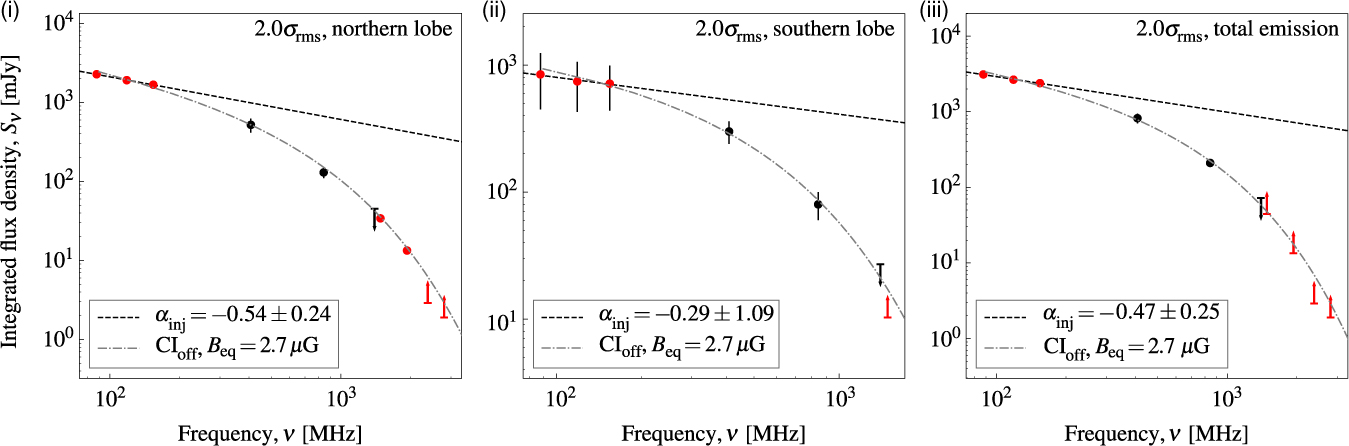
Figure 7. The SED of the emission surrounding NGC 1534 after a 2σrms cut to the pixels. (i) Emission from the northern lobe. (ii) Emission from the southern lobe. (iii) Combined emission from the northern and southern lobes. Measured flux densities have sources subtracted, where appropriate, based on spectral indices derived in Section 3.1.1. A CIoff model is fit for the northern and southern lobes separately, then for the combined emission. Limits are indicated by arrows, points in black are from the literature (see Table 5), and points in red are measured in this work. Limits are not used in the fitting process.
Figure 7(i)–(iii) shows the SEDs of the northern lobe, southern lobe, and total emission, along with model fits. We find that, given α
inj = −0.54 for the northern lobe emission, a total source age is found to be ts
= 203±5 Myr with an injection time of t
on = 44±5 Myr and time since it switched off of toff = 158 ± 2 Myr. Note that quoted errors are simply those from model fitting, and the true uncertainties are much greater as many assumptions are made in this process. Notably, our value of ts
suggests a break frequency of approximately 502 MHz [see e.g. Equation (1) of Alexander & Leahy Reference Alexander and Leahy1987], above the GLEAM frequency coverage validating our choice of α
inj found from those data. As discussed in Harwood (Reference Harwood2017), these times should be considered as ‘characteristic’. From the CIoff model of the northern lobe, we estimate the 1.4-GHz flux density as $S_{1.4}^{\mathrm{north}} \approx 41\,\text{mJy}$
. Assuming the source size is the same as at the 1.51-GHz size of approximately 60 arcmin2, then the surface brightness is approximately 0.7 mJy arcmin−2. Assuming NGC 1534 is the original host, and assuming the true emission is represented by a symmetric set of lobes of flux density
$S_{1.4}^{\mathrm{north}} \approx 41\,\text{mJy}$
. Assuming the source size is the same as at the 1.51-GHz size of approximately 60 arcmin2, then the surface brightness is approximately 0.7 mJy arcmin−2. Assuming NGC 1534 is the original host, and assuming the true emission is represented by a symmetric set of lobes of flux density $2\times S_{1.4}^{\mathrm{north}}$
, the core-to-lobe luminosity ratio is
$2\times S_{1.4}^{\mathrm{north}}$
, the core-to-lobe luminosity ratio is $P_{1.4}^{\mathrm{core}}/P_{1.4}^\mathrm{lobe} \approx 0.02$
.
$P_{1.4}^{\mathrm{core}}/P_{1.4}^\mathrm{lobe} \approx 0.02$
.
Assuming the host of the emission is NGC 1534 and with a distance of 230 kpc from northern lobe centre (i.e. the equivalent hotspot) to NGC 1534, the minimum velocity of the lobe must be approximately 0.014c, which is on the same order of magnitude as FR-II (Fanaroff & Riley Reference Fanaroff and Riley1974) sources (e.g. Liu, Pooley & Riley Reference Liu, Pooley and Riley1992).
One should be cautious comparing integrated flux densities of maps with different u–v coverage. As there are differences between not only the MWA and ATCA observations, but also the Molonglo and ATCA observations, we may be biasing the spectrum to be much steeper above 1 GHz. This high-frequency, steep-spectrum bias suggests the t off estimate is an upper limit, as the true age will be younger with a flatter high-frequency spectrum. Further ATCA observations to fill in the u–v plane would be required to confirm this. We note that Hurley-Walker et al. (Reference Hurley-Walker2015) find a significantly higher integrated flux density at 185 MHz than what is suggested here; however, subsequent improvements to the MWA primary beam model and general flux scale used by Hurley-Walker et al. (Reference Hurley-Walker2017) can account for this discrepancy.
3.2. Polarimetry
The ATCA operates with linear XX, YY, XY, and YX cross-correlations which allow measurement of Stokes I, Q, U, and V, thus we investigate the polarisation properties of the emission surrounding NGC 1534. We are interested in the linear polarisation defined via Stokes Q and U,
 \begin{equation}P = Q + iU,\end{equation}
(5)
\begin{equation}P = Q + iU,\end{equation}
(5)
with, assuming no circularly polarised emission (Stokes V), the total polarisation intensity
 \begin{equation}\parallel P\parallel = \sqrt {{Q^2} + {U^2}}.\end{equation}
(6)
\begin{equation}\parallel P\parallel = \sqrt {{Q^2} + {U^2}}.\end{equation}
(6)
3.2.1. Rotation measure (RM) synthesis
As the 2.1-GHz data have a large fractional bandwidth and reasonably small channels, we perform RM synthesis (Brentjens & de Bruyn Reference Brentjens and de Bruyn2005)—a method to investigate rotation measure on a non-contiguous spectrum, building on the rotation measure work of Burn (Reference Burn1966). As in Burn (Reference Burn1966), Brentjens & de Bruyn (Reference Brentjens and de Bruyn2005) define the Faraday depth, φ, via
 \begin{equation}\phi (r) = 0.81\int\limits_{\rm{0}}^{\rm{L}} {n_e}\boldsymbol{B} \cdot {\rm{d}}r\quad [\text{rad}\,\text{m}^{ - 2}],\end{equation}
(7)
\begin{equation}\phi (r) = 0.81\int\limits_{\rm{0}}^{\rm{L}} {n_e}\boldsymbol{B} \cdot {\rm{d}}r\quad [\text{rad}\,\text{m}^{ - 2}],\end{equation}
(7)
where ne is the electron density in cm−2, B is the intervening magnetic field in µG, and d r is an infinitesimal element along the path of length L in pc. Though we cannot usually measure the electron density, the sign of the Faraday depth gives the average magnetic field direction, where a negative φ is given by a magnetic field in the direction of the observer. Additionally, the Faraday depth spectrum may show other sources along the line of sight. Intrinsic source rotation measure is defined as
 \begin{equation}{\rm{R}}{{\rm{M}}_0} = {{{\rm{d}}{\chi _P}} \over {{\rm{d}}{\lambda _{{\rm{obs}}}}^2}}{\left( {1 + z} \right)^2} - {\rm{R}}{{\rm{M}}_{{\rm{gal}}}} - {\rm{R}}{{\rm{M}}_{{\rm{other}}}}\quad [\text{rad}\,\text{m}^{ - 2}],\end{equation}
(8)
\begin{equation}{\rm{R}}{{\rm{M}}_0} = {{{\rm{d}}{\chi _P}} \over {{\rm{d}}{\lambda _{{\rm{obs}}}}^2}}{\left( {1 + z} \right)^2} - {\rm{R}}{{\rm{M}}_{{\rm{gal}}}} - {\rm{R}}{{\rm{M}}_{{\rm{other}}}}\quad [\text{rad}\,\text{m}^{ - 2}],\end{equation}
(8)
where λ obs is the observed wavelength, z is the redshift of the source in question, RMgal is RM contribution from Galactic Faraday rotation, and RMother is the RM contribution from other foreground or background sources. The rotation measure gives insight into the source magnetic field as well as any intervening or background magnetic field sources.
For RM synthesis, we use the EW367 ATCA data and create Stokes Q and U cubes with axes α J2000, δ J2000, and ν, where ν represents a single channel of 1 MHz. Only the EW367 observation is used as it had the least flagging due to RFI which enabled a larger fractional bandwidth/more individual channels to be used at only a small loss to sensitivity and u–v coverage. Each plane in the cube, corresponding to a 1-MHz channel of the original 2.1-GHz data, is imaged to the same dimensions—no CLEANing is done on the 1-MHz images. Primary beam corrections are applied for each plane at the given frequency, though pixels outside the Full-width at half maximum (FWHM) of the primary beam of the highest frequency 1-MHz image are blanked in the output image cube, thus we do not expect noise to vary significantly across the planes. The imaging is done on a per-pointing basis, with each plane a mosaic using linmos as in Section 2.2.2. For channels where all data are flagged, we skip those in the cube-forming/imaging process and move on to the next channel.
The Q and U cubes, along with a list containing frequencies for each plane, are then used by the RM synthesis code developed by M. A. Brentjens (Reference Brentjens and de Bruyn2005)Footnote f to generate a rotation measure transfer function [RMTF, also known as the rotation measure synthesis function, shown in Figure 8(i)] and cube of α J2000, δ J2000, and Faraday depth φ in units of the Faraday dispersion function, F(φ). The resolution chosen for synthesising RM is 1 rad m−2. We synthesised the Faraday dispersion in the range −1650 ≤ φ ≤ + 1650. The top panel of Figure 8 shows the RMTF. The polarised intensity, ∥P∥ in Jy beam−1 rmtf−1, is equal to the Faraday dispersion function, F(φ), in the case of sources that are discrete in φ (de Bruyn & Brentjens (Reference Brentjens and de Bruyn2005)).
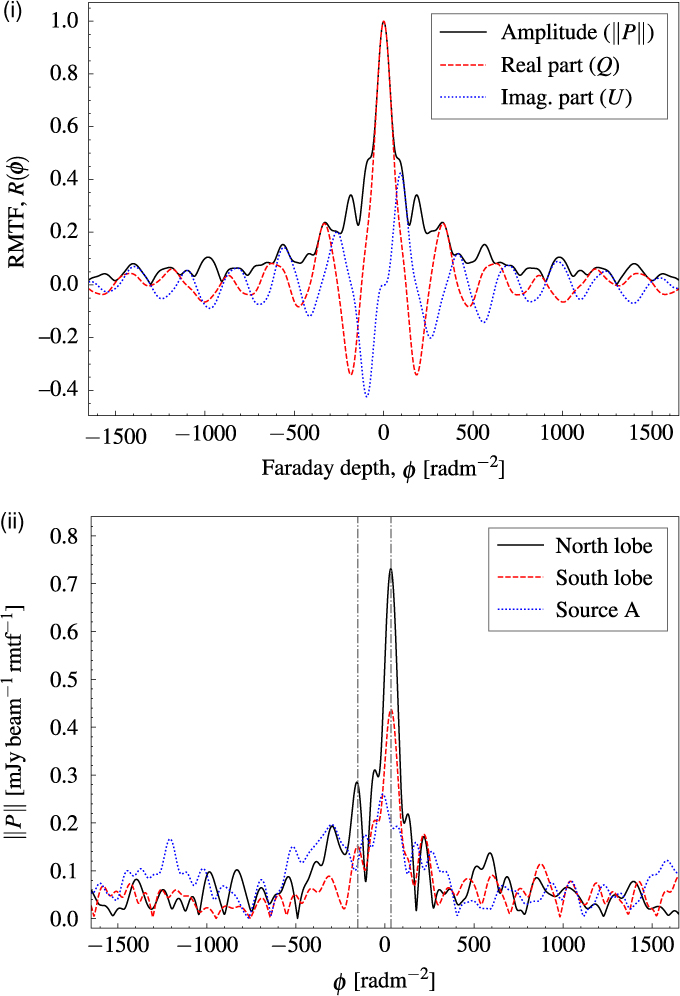
Figure 8. (i) The RMTF between −1650 ≤ φ ≤ 1650. (ii) The polarised intensity along the Faraday depth cube of three pixels corresponding to a pixel within the northern lobe (black, solid—04h08m29.s7, −62°38′56.′′8), within the southern lobe (red, dashed—04h09m39.s7, −62°58′08.′′9), and Source A (blue, dotted—04h08m42.s0, −62°33′00.′′8). Marked with vertical lines are peaks of interest in the Faraday depth spectrum. In both panels, the resolution in φ is 1 rad m−2. The vertical lines represent the two detected RM features at −153 and +33 rad m−2.
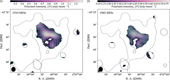
Figure 8(ii) shows the Faraday depth spectra of three representative pixels: within the northern lobe (04h08h29.s7, −62°38′56.′′8), the southern lobe (04h09h39.s7, −62°58′08.′′9), and Source A (04h08h42.s0, −62°33′00.′′8). The north and south lobe pixels have peaks at a Faraday depth of +33 and +34 rad m−2, respectively, and Source A shows a peak at −12 rad m−2. The main peak in the north and south lobes is close to the estimated Galactic foreground RM of +27 rad m−2 (Oppermann et al. Reference Oppermann2015, but see also Oppermann et al. Reference Oppermann2012). This Galactic foreground value is taken from an average value within 1 000 arcsec of NGC 1534, which comprises approximately four pixels of the Hierarchical Equal Area isoLatitude Pixelization (HEALPIX) Górski et al. Reference Górski2005 image of the Galactic Faraday depth produced by Oppermann et al. (Reference Oppermann2015). Figure 9(ii) shows the plane in the Faraday depth cube at φ = +33, showing large-scale emission beyond the size of the emission from NGC 1534, further suggesting Galactic (or otherwise foreground) origin rather than the intrinsic magneto-ionic plasma of NGC 1534’s lobes. Figure 9(i) shows the second isolated peak in the Faraday depth spectrum of the northern lobe pixel [marked in Figure 8(ii)] at −153 rad m−2. We do not have enough information about the intergalactic medium to know with 100% certainty whether this peak corresponds to a non-Galactic screen external to the radio plasma, or to the radio lobe itself. However, as the position corresponds to the peak brightness of the polarised emission in the lobes, it is likely to be associated with the radio galaxy itself.
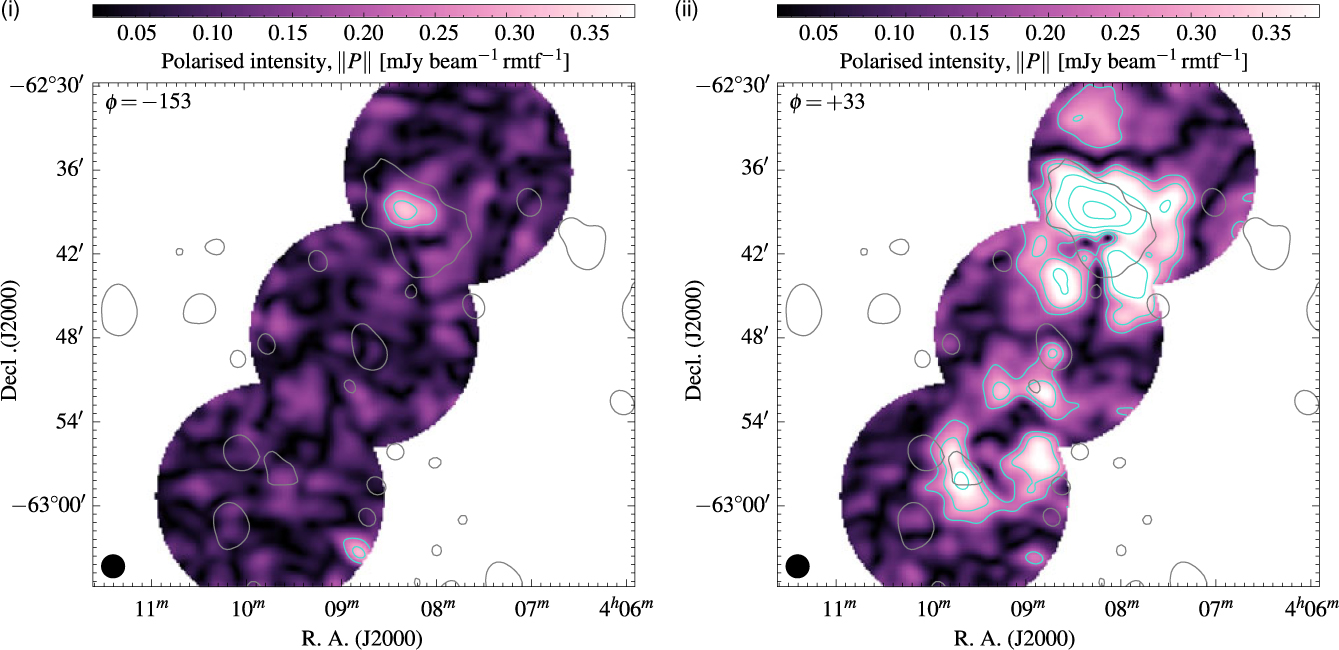
Figure 9. Planes in the Faraday depth cube as indicated in Figure 8(ii). (i) φ = −153. (ii) φ = +33. In both panels, the single black contour is of the medium-resolution 1 510-MHz image at 810 µjy beam−1. The turquoise contours are the linear polarisation intensity at the specific Faraday depth, beginning at 210 µJy beam−1 rmtf−1 and increasing with factors of
$\sqrt{2}$
. The black ellipse in the lower-left corner is the beam shape of the Faraday depth cube. Both images share the same linear colour scale.
3.2.2. Continuum polarimetry
We follow a similar imaging procedure as in Section 2.2.3 (i.e. without antenna 6). The Stokes I images are deconvolved in a similar manner to the Stokes I images of Section 2.2.3, though for the Stokes Q and U images we use the complex implementation of the Steer–Dewdney–Ito (SDI; Steer, Dewdney & Ito Reference Steer, Dewdney and Ito1984) CLEAN algorithm offered by the task cclean (Pratley & Johnston-Hollitt Reference Pratley and Johnston-Hollitt2016). The SDI CLEAN algorithm is better at CLEANing extended sources than the traditional Hogböm (Högbom Reference Högbom1974) or Clark (Clark Reference Clark1980) CLEAN algorithms as used by mfclean. Complex CLEAN acts on both Stokes Q and U in a dependent fashion. As linear polarisation, P, is a complex quantity, the complex CLEAN algorithm properly accounts for this complex vector nature of the signal. We produce total polarisation intensity maps (∥P∥), shown in Figure 10, overlaid with vectors of magnitude proportional to the fractional polarisation, mP = ∥P∥/1, and directions representing the apparent magnetic field, χ P + π / 2 − RMλ2, where χ P is the electric vector position angle defined via
 \begin{equation}{\chi _P} = {1 \over 2}\arctan {U \over Q},\end{equation}
(9)
\begin{equation}{\chi _P} = {1 \over 2}\arctan {U \over Q},\end{equation}
(9)
and RM is the total line-of-sight RM. In making polarisation images (intensity, fractional polarisation, and position angle) we use a 3σ rms,QU , 3σ rms,I cut to the intensity and a 3σ rms = 10° cut to the position angle. This results in no detected polarised emission from the 2 375- and 2 807-MHz bands. Figure 10(i) and (ii) shows the polarisation intensity maps for the 1 510- and 1 942-MHz bands, respectively, with vectors of magnitude defined by the fractional polarisation and magnetic field directions. We de-rotate the position angles based on an assumed Galactic Faraday depth of +33 rad m−2 and for the additional peak at −153 rad m−2 (see Section 3.2.1). The average fractional polarisation across the source in the 1 510- and 1 942-MHz bands is 42 ± 14 and 43 ± 14%, respectively, and in the higher bands little polarisation is detected, following the Stokes I images. The field directions appear curled which is not typically seen in the intrinsic magnetic fields of radio galaxy lobes (e.g. Bridle & Perley Reference Bridle and Perley1984), unless the lobe is bent or twisted (e.g. Laing et al. Reference Laing, Bridle, Parma, Feretti, Giovannini, Murgia and Perley2008); however, the curling seen here would require the northern lobe to have fallen completely back in on itself.
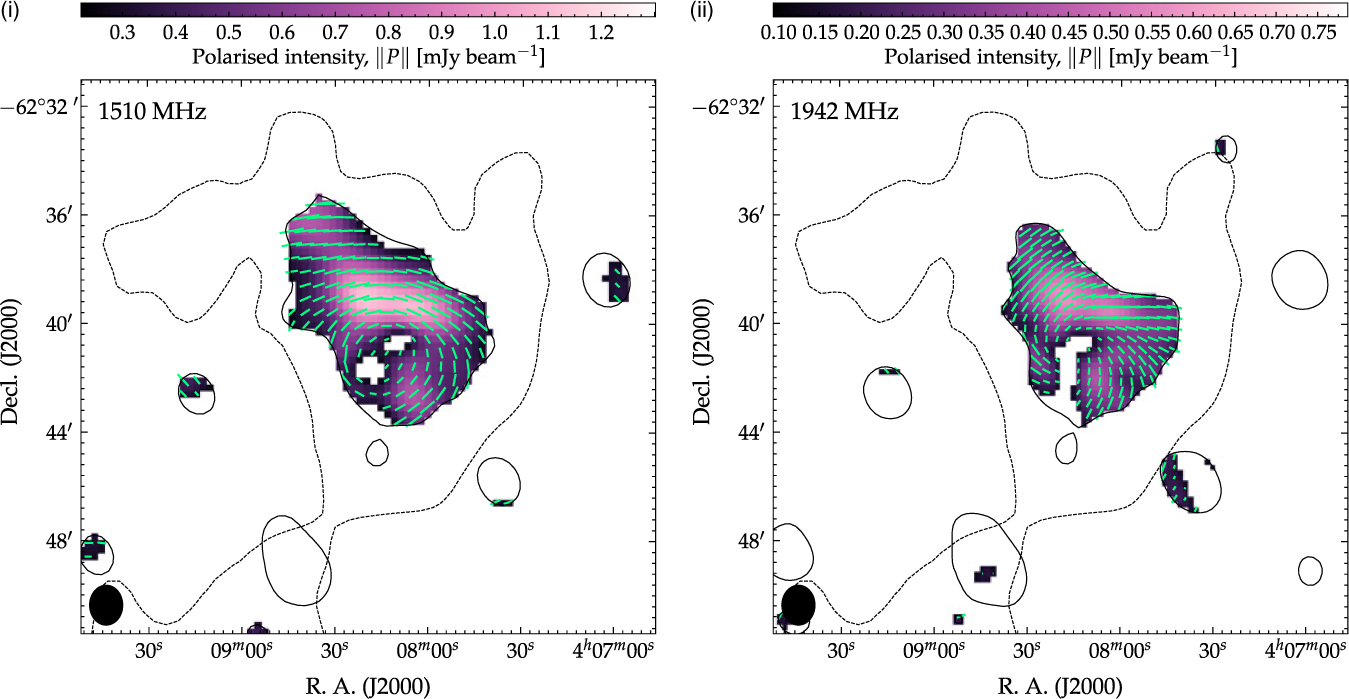
Figure 10. Polarisation images. (i) 1 510-MHz subband image. (ii) 1 942-MHz subband image. The background in both panels is the total linear polarisation intensity map (i.e. $\|P\|=\sqrt{Q^2 + U^2}$
) which is overlaid with a single black, dashed GLEAM 200-MHz contour at 3σrms and a single black, solid ATCA Stokes I contour at 3σrms of the medium-resolution image. The fields are the B-field and the vector lengths are proportional to m
P where five pixels correspond to m
P = 1. The position angles are corrected for Galactic Faraday rotation, assuming φ
gal = +33 rad m−2, and an additional Faraday screen at φ = −153 rad m−2.
$\|P\|=\sqrt{Q^2 + U^2}$
) which is overlaid with a single black, dashed GLEAM 200-MHz contour at 3σrms and a single black, solid ATCA Stokes I contour at 3σrms of the medium-resolution image. The fields are the B-field and the vector lengths are proportional to m
P where five pixels correspond to m
P = 1. The position angles are corrected for Galactic Faraday rotation, assuming φ
gal = +33 rad m−2, and an additional Faraday screen at φ = −153 rad m−2.
4. Discussion
NGC 1534 represents the rare chance to study a relatively nearby radio galaxy with diffuse low-surface brightness emission. It is peculiar for a number of reasons including its position in the field, not a cluster, and the seeming discrepancy between the position of the optical galaxy and typical position for radio emissions appears to be slightly offset. Here we consider the properties of NGC 1534 and the environment that surrounds it and argue that it is not inconsistent that if the AGN has switched off, we could see a drift in the position of the source in the loose group environment which could account for the slight misalignment of optical host and radio jet positions.
4.1. Radio emission from disk galaxies in the NGC 1534 field
Radio emission is detected in four disk galaxies in the NGC 1534 field, including NGC 1534 itself. Figure 11(i)–(iii) shows the relevant galaxies with 2.2-GHz contours overlaid. NGC 1534 and Source E show typical diffuse emission consistent with low nuclear activity; however, both Sources C1 and C2 have reasonably strong nuclear activity, with Source C1 showing extensions north and south. Sources C1 and C2 are reported as part of the galaxy triple AM 0409-630 (z = 0.0481 ± 0.0002; Strauss et al. Reference Strauss, Huchra, Davis, Yahil, Fisher and Tonry1992), though no redshift is directly available for Source C2. At this redshift, the extension seen in the radio structure of Source C1 is of the order 10 kpc. Additionally, further extension in the radio emission traces the central portion of the bar. Source E is part of the triple AM 0406-624, though itself has no redshift. Its triple members, PGC 014488 and LEDA 075047 have redshifts z = 0.0189 ± 0.0002 and z = 0.0193 ± 0.0002 (Jones et al. Reference Jones2009), respectively. If the triple association is correct, then we estimate a redshift of z ∼ 0.0191. At this redshift, the separation from NGC 1534 is only ∼ 380 Km s−1. This implies a loose group association.
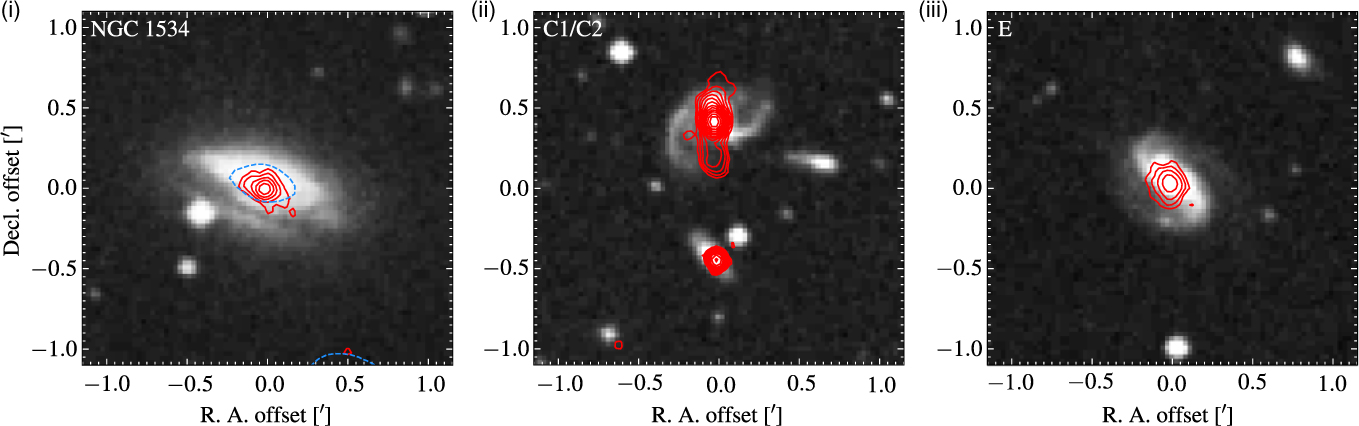
Figure 11. Disk galaxies in the NGC 1534 field with significant radio emission at 2.2 GHz. (i) NGC 1534. (ii) Sources C1 and C2. (iii) Source E. The background images are the blue band UK Schmidt Telescope (UKST) images, and the solid, red contours are from the 2.2-GHz wideband ATCA image, beginning at 3σrms for NGC 1534 and 4σrms for Sources C1/C2 and E. The dashed, blue contour in (i) is the 17-GHz medium-resolution image at 3σrms
Importantly, we see from Figures 5 and 11 that the radio emission from the core NGC 1534 is extended and diffuse, even at high frequencies. It is therefore very likely to be the result of only star formation in the disk of the galaxy, and there is no significant AGN present in the NCG 1534 core.
4.2. Star formation in NGC 1534
As mentioned above, our ATCA images at 2.1 and 17 GHz clearly show that the main component of radio emission from NGC 1534 is extended and diffuse, likely originating within the disk from star formation rather than from any significant nuclear activity. We can test the validity of this assertion by comparing the mid-infrared star-formation rate (SFR) estimators via Widefield Infrared Survey Explorer (WISE; Wright et al. Reference Wright2010; Mainzer et al. Reference Mainzer2011) measurements (e.g. Jarrett et al. Reference Jarrett2013) with the 1.4-GHz SFR estimator via our 2.1-GHz ATCA measurements (Condon Reference Condon1992; Hopkins et al. Reference Hopkins, Mobasher, Cram and Rowan-Robinson1998; Cram et al. Reference Cram, Hopkins, Mobasher and Rowan-Robinson1998). At present, one must be cautious when using radio luminosity an SFR estimator as doing so assumes all radio emission is directly related to past star formation and not AGN or other nuclear activity. In the case of a normal radio galaxy with typical double-lobed structure, the AGN component will dramatically dominate the comparatively feeble radio emission from supernova remnants thus providing a massively overestimated SFR. Likewise, infrared SFR estimators will run into similar problems, though much less dramatically.
Fortunately, NGC 1534 is detected in all four bands of the WISE all-sky catalogue, AllWISE (Cutri et al. Reference Cutri2013). WISE has bands W1–W4, corresponding to wavelengths 3.4, 4.6, 12, and 22 µm. Table 6 presents W1–W4 band Vega-calibrated magnitudes as well as flux densities and luminosities assuming a spectral index across the W1–W4 bands of 0.2. In comparison to Figure 11 of Yan et al. (Reference Yan2013), we can see from WISE colours W1–W2 = −0.012 and W2–W3 = 2.184 that NGC 1534 may indeed have some form of nuclear activity, though may also be considered as star-forming. With reference to Equation (2) of Jarrett et al. (Reference Jarrett2013), we estimate the SFR from the W4 measurement: SFR22 = 0.37 ± 0.04 M⊙ yr−1. Note that the WISE W4 band traces mostly the warm interstellar medium dust emission and is a lower estimate of the full SFR.
Table 6. Mid-infrared properties of NGC 1534 from WISE (Cutri et al. Reference Cram, Hopkins, Mobasher and Rowan-Robinson2013)
For these data we estimate a spectral index of 0.2 for obtaining correction factors for magnitude to flux density conversion and for estimating luminosity, Lν . The solar luminosity, L⊙, is taken to be .3.839 × 1033.. W as per Jarrett et al. (Reference Jarrett2013).
For the 1.4-GHz SFR, we use the 1.4-GHz power of NGC 1534 derived in Section 3.1.1. We use the 1.4-GHz SFR estimator of Hopkins (Reference Cram, Hopkins, Mobasher and Rowan-Robinson1998, Equation (7.1); adapted from Condon Reference Condon1992) to estimate SFR1.4=0.38 ± 0.03 M⊙yr−1, which is valid for the non-thermal synchrotron component, mostly tracing supernova remnants and is valid for stars with M ≥ 5 M⊙. This value is in good agreement with SFR22 derived from WISE results. The agreement in these two estimators suggests a lack of significant emission from an AGN and further suggests NGC 1534, if the original host of the radio lobes, is no longer fuelling them.
4.3. A dead radio galaxy
Hurley-Walker et al. (Reference Hurley-Walker2015) consider NGC 1534 to be a previously active radio galaxy, with the emission seen surrounding it the remnants of the ancient lobes. The ATCA observations of NGC 1534 point toward a lack of AGN activity, which, coupled with the offset of NGC 1534 from the centre of the lobes, suggests a dying—or dead—radio galaxy. Such an object is less common outside of galaxy clusters (e.g. Cordey Reference Cordey1987; Murgia et al. Reference Murgia2011). The spectral properties of the lobes of NGC 1534 are consistent with the cluster-based dead radio galaxy sample of Murgia et al. (Reference Murgia2011) as well as non-cluster-based examples (e.g. Jamrozy et al. Reference Jamrozy, Klein, Mack, Gregorini and Parma2004; Parma et al. Reference Parma, Murgia, de Ruiter, Fanti, Mack and Govoni2007; Brienza et al. Reference Brienza2016). However, in dense cluster environments the radio plasma becomes confined and the lobe size also remains much smaller (Murgia et al. Reference Murgia2011). In the case of NGC 1534, we have emission ≳ 600 kpc outside of any dense environment which provides an interesting example of a dead field radio galaxy.
The emission surrounding NGC 1534 has many similarities with the remnant emission ‘blob1’ (Brienza et al. Reference Brienza2016)—namely its location in an underdense environment, its projected size, and the SED. The t off / ts ratio of its ‘characteristic time’, 0.8, is also similar; however, the spectral age determined through CIoff modelling may be poorly represented (see e.g. Harwood Reference Harwood2017). Assumptions such as a constant magnetic field over the lifetime of the source or a constant spectrum over the extent of the source can lead to uncertain spectral ages (see e.g. Harwood Reference Harwood2017; Harwood et al. Reference Harwood2017; Turner et al. Reference Turner, Rogers, Shabala and Krause2018a; Turner, Shabala, & Krause Reference Turner, Shabala and Krause2018b), and adiabatic losses will result in an underestimate to the dynamical age (particularly in an underdense medium; Blundell & Rawlings Reference Blundell and Rawlings2000). Work has been done to incorporate adiabatic losses into radio galaxy spectral models (see Godfrey, Morganti, & Brienza Reference Godfrey, Morganti and Brienza2017; Heesen et al. Reference Heesen2018), and model fitting across the extent of a resolved source can alleviate the issues with integrated spectra (e.g. Harwood Reference Harwood2017; Harwood et al. Reference Harwood, Hardcastle, Croston and Goodger2013, Reference Harwood, Hardcastle and Croston2015 with the use of brats in this regard). Additionally, Turner et al. (Reference Turner, Shabala and Krause2018b) discuss how the CI spectrum can be modelled independent of the magnetic field, though note that the magnetic field strength is required for an estimate of the source’s synchrotron age. Interestingly, we see that the intrinsic magnetic field of dead radio galaxies does not differ much based on environment (assuming a fixed magnetic field strength)—from a mixture of cluster and non-cluster sources, for both the samples of Parma et al. (Reference Parma, Murgia, de Ruiter, Fanti, Mack and Govoni2007) and Murgia et al. (Reference Murgia2011), a mean equipartition magnetic field of approximately 13 µG exists, though note that their equipartition calculations use a fixed energy range rather than a fixed frequency range as used here and as a result their magnetic fields are up to a factor of two larger. Additionally, ‘blob1’ has 1 µG (Brienza et al. Reference Brienza2016), emission surrounding NGC 5580 and NGC 5588 in a poor group has 2.5 µG (de Gasperin et al. Reference de Gasperin, Intema, Williams, Brüggen, Murgia, Beck and Bonafede2014, though note the authors are uncertain of its classification), and the archetypal B2 0924 + 30 in the poor cluster ZwCL 0926.5 + 30.26 (Ekers et al. Reference Ekers, Fanti, Lari and Ulrich1975; Cordey Reference Cordey1987; Jamrozy et al. Reference Jamrozy, Klein, Mack, Gregorini and Parma2004; Shulevski et al. Reference Shulevski2017) with B eq ranging from 0.89 to 1.6 µG, which is consistent with B eq ≈ 2.7 µG we find for NGC 1534.
With so few examples of of dead radio galaxies outside of rich clusters, adding counts to this population will only help in understanding the life cycles of radio galaxies.
4.4. The group environment
NGC 1534 is catalogued as part of the HDC 269 and LDC 292 galaxy groups (Crook et al. Reference Crook, Huchra, Martimbeau, Masters, Jarrett and Macri2007), which have line-of-sight velocity dispersions 119.3 and 198.7 Km s-1. The high density group, HDC 269, has three members: NGC 1534 itself, NGC 1529, and 2MASX J04111365-6242521; locations of these group members are indicated in Figure 1 as cyan squares. The group velocity is calculated to be 5 201 Km s-1 (Crook et al. Reference Crook, Huchra, Martimbeau, Masters, Jarrett and Macri2007). If NGC 1534 is indeed the host, then we see from the offset position of the optical galaxy and the thinnest point of the radio emission that NGC 1534 must have moved from its old lobes, leaving the radio plasma to gradually diffuse and lose energy to the intergalactic medium. The shortest timescale available for NGC 1534 for movement is if all velocity is in the transverse direction. If we assume that the transverse velocity is no more than its radial velocity, we can assume that the projected transverse velocity is given by the velocity dispersions which allow us to determine the maximum distance NGC 1534 could have drifted from its original position or alternatively the minimum age of the emission had NCG 1534 drifted this far, assuming the greatest possible transverse velocity. Assuming the pinching point between the lobes was the original location of NGC 1534, we calculate a projected separation of 1.72 arcmin corresponding to 38.5 kpc. With our assumed projected transverse velocities, this indicates a minimum age of the emission (and since NGC 1534 stopped producing it) of 190 Myr (or 316 Myr). Given that this is an underdense environment, the relic plasma will continue to move along the same path as NGC 1534, which pushes these times up further, and movement in any direction not transverse will do the same. This time scale is on the same order as the ‘off’ spectral age of approximately 158 Myr making it plausible that NGC 1534 is the original host, despite the current imperfect alignment of the galaxy and the emission.
4.5. Implications for future studies
It is worth noting that originally, the emission was not found in a survey but as part of a set of targeted observations. However, surveys such as GLEAM, the Tata Institute of Fundamental Research Giant Metrewave Radio Telescope (TFIR GMRT)Footnote g Sky Survey (TGSS alternate data release 1; Intema et al. Reference Intema, Jagannathan, Mooley and Frail2017), the LOFAR Multifrequency Snapshot Sky Survey (MSSS; Heald et al. Reference Heald2015), and the LOFAR Two-metre Sky Survey (LoTSS; Shimwell et al. Reference Shimwell2017) are providing the low-frequency observations required to uncover a heretofore unseen population of faint, steep-spectrum sources. With GLEAM (and the MWA in general), the u–v coverage offered by its short baseline observations allows for the detection of low-surface brightness, large-scale emission and where there exists overlap with the TGSS, there is the benefit of complementary, higher-resolution data to confirm, for example, cores or other compact structure within the emission. However, while emission with such large angular extent such as that presented here is comparatively rare, such low-surface brightness sources do not have to be so large. Smaller-scale, low-surface brightness emission (at higher redshift or otherwise) may be missed if using only the low-resolution GLEAM survey, though this may be alleviated somewhat with upcoming MWA Phase II surveys using the extended tile configuration, which will have a resolution on the order of two times that of GLEAM at a small cost to surface brightness sensitivity (Wayth et al. Reference Wayth2018).
Remnant emission like that around NGC 1534 (or ‘blob1’; Brienza et al. Reference Brienza2016) would likely be missed in surveys focused within a small frequency band such as that offered by GLEAM due to their reasonably flat low-frequency spectra. It has been suggested (Murgia et al. Reference Murgia2011; Brienza et al. Reference Brienza2016, Reference Brienza2017, but see also Sohn, Klein & Mack Reference Sohn, Klein and Mack2003) that using the spectral curvature, SPC = α high – α low, where α high and α low are high- and low-frequency spectral indices, respectively, would be a useful tool in detecting dead radio galaxies, as SPC <− 0.5 implies a non-active source. Such a diagnostic tool requires a good choice of α high and α low, though Harwood (Reference Harwood2017) notes that even this may not be sufficient due to the different α inj between FR-I and FR-II sources. Furthermore, such a survey would require high- and low-frequency data and at present the most sensitive, higher frequency southern sky counterpart to GLEAM is SUMSS, which may not be high enough in frequency. The upcoming Evolutionary Map of the Universe (Norris et al. Reference Norris2011) with the Australia Square Kilometre Array Pathfinder (Johnston et al. Reference Johnston2007) is expected to have an rms sensitivity on the order of 10 μjy beam−1. This, coupled with its low-surface brightness sensitivity and the frequency range 1130–1430 MHz, will give another high-frequency counterpart to GLEAM (and future MWA Phase II surveys) for searches of remnant radio galaxies, paving the way to vastly increase the detection rate of this population.
Within the context of searching for radio lobes of disk galaxies (e.g. Singh et al. Reference Singh, Ishwara-Chandra, Sievers, Wadadekar, Hilton and Beelen2015), the larger and possibly faint lobes of giant radio galaxies (e.g. Saripalli et al. Reference Saripalli, Hunstead, Subrahmanyan and Boyce2005), or searching for dead radio sources (e.g. Murgia et al. Reference Murgia2011), the low-frequency surveys can be paired with optical surveys such as Pan-STARRS1 (Panoramic Survey Telescope and Rapid Response System; Kaiser et al. Reference Kaiser2010, PS1; Tonry et al. Reference Tonry2012, Chambers et al. Reference Chambers2016) for δ >− 30° or the SkyMapper Southern Sky Survey (SMSS; Wolf et al. Reference Wolf2018 Footnote h ) for δ ≲ + 2° for confirmation of the optical host. On top of the additional depth of the surveys, PS1 has five optical bands from near infrared to blue and SMSS has six from near infrared (NIR) to near ultraviolet (NUV) allowing better estimation of photometric redshifts which is vital when spectroscopic redshifts are unavailable. Further in the future, southern spectroscopic surveys such as the Taipan Galaxy Survey (da Cunha et al. Reference da Cunha2017), in conjunction with SMSS, will provide an analogue to the Sloan Digital Sky Surveys (York et al. Reference York2000, specifically surveys such as the Legacy Survey; Abazajian et al. Reference Abazajian2009) and will facilitate surveys for disk galaxies hosting large-scale radio emission as well as surveys of dead or dying radio sources.
5. Conclusion
In this paper we have presented follow-up observations with the ATCA of the remnant emission surrounding the lenticular galaxy NGC 1534 originally detected by Hurley-Walker et al. (Reference Hurley-Walker2015). We combined this with new low-frequency MWA data to study the emission from 72 to 19 GHz, including polarimetric study in the ATCA 16-cm band. We summarise the main results here.
We find the northern lobe to be well-fit by a CIoff model with a fixed Beq ≈ 2.7 μG and . α = 0.54 ± 0.24, obtain an estimate of the spectral age of the emission on the order of approximately 203 Myr, having been active for only ∼ 44 Myr.
The ATCA 2.1- and 17-GHz data corroborate the notion that NGC 1534 has no significant core emission, with low-brightness, diffuse emission seen from the galaxy with no compact counterpart.
We find consistency between the radio- and mid-infrared-derived SFRs for NGC 1534 with .SFR1.4 = 0.38 ± 0.03 M⊙ yr−1 and SFR22 = 0.37 ± 0.04 M⊙ yr−1, consistent with a lack of significant nuclear activity.
The northern lobe is shown to be highly linearly polarised at 1 510 and 1 942 MHz, with mP, 1510 = 42 ± 13% and mP, 1942 = 43 ± 14 %.
RM synthesis of the region detects a significant Galactic foreground screen at +33 rad m−2 with an additional peak in the Faraday spectrum of the northern lobe at −153 rad m−2.
Analysis of the position of NGC 1534 with the improved expected position of the host galaxy suggests that the host has drifted away from its original position over a time period commensurate with the cessation of AGN activities.
From these findings, we see that the lenticular galaxy NGC 1534 and the surrounding emission are consistent with remnant radio galaxies, and we confirm its classification as a rare ‘dead’ radio galaxy not associated with a galaxy cluster. It additionally sits with the rare class of radio galaxies associated with dusty disk galaxies. With such a wealth of data soon available from upcoming and currently underway sky surveys at multiple wavelengths, we expect to be able to greatly expand both the number of such sources detected and, using the panchromatic data available, better understand their host systems.
Acknowledgements
S. W. D. acknowledges a Doctoral Scholarship from Victoria University of Wellington and an Australian Government Research Training Programme scholarship administered through Curtin University. The Australia Telescope Compact Array is part of the Australia Telescope National Facility which is funded by the Australian Government for operation as a National Facility managed by CSIRO. The authors would like to thank the anonymous referee for comments and suggestions that helped to improve this paper. This research made use of astropy, a community-developed core python package for Astronomy (Astropy Collaboration et al. 2013), along with aplpy, an open-source plotting package for python hosted at http://aplpy.github.com. This research also made use of NumPy (van der Walt, Colbert, & Varoquaux Reference van der Walt, Colbert and Varoquaux2011), matplotlib (Hunter Reference Hunter2007), and iPython (Pérez & Granger Reference Pérez and Granger2007) which are part of the SciPy library for python: https://www.scipy.org/. This research has made use of the VizieR catalogue access tool, CDS, Strasbourg, France. The original description of the VizieR service was described in Ochsenbein, Bauer, & Marcout (Reference Ochsenbein, Bauer and Marcout2000). This research also made use of the NASA/IPAC Extragalactic Database (NED) which is operated by the Jet Propulsion Laboratory, California Institute of Technology, under contract with the National Aeronautics and Space Administration. The Digitized Sky Surveys were produced at the Space Telescope Science Institute under US Government grant NAG W-2166. The images of these surveys are based on photographic data obtained using the Oschin Schmidt Telescope on Palomar Mountain and the UK Schmidt Telescope. The plates were processed into the present compressed digital form with the permission of these institutions.