


1. Introduction
Radio-loud active galactic nuclei (AGN) are one manifestation of the supermassive black holes (SMBHs,  $10^5$
–
$10^5$
– $10^9\,\text{M}_\odot$
) which lie at the centre of nearly all galaxies. They are powered by bipolar relativistic outflows (i.e. jets) of ionised material originating close to the SMBH (Rees Reference Rees1978). In the local Universe, radio-loud AGN are typically hosted by passive elliptical galaxies with negligible accretion rates (Eddington ratio
$10^9\,\text{M}_\odot$
) which lie at the centre of nearly all galaxies. They are powered by bipolar relativistic outflows (i.e. jets) of ionised material originating close to the SMBH (Rees Reference Rees1978). In the local Universe, radio-loud AGN are typically hosted by passive elliptical galaxies with negligible accretion rates (Eddington ratio  $<1\%$
, see Heckman & Best Reference Heckman and Best2014, and below). However, many of the most powerful radio-loud AGN in the distant Universe are powered by SMBH with very high accretion rates (e.g. Drouart et al. Reference Drouart2014). This difference is thought to be due to differing natures of the accretion disc at high and low accretion rates. Typically, these rates are normalised to the theoretical maximum accretion rate (the ‘Eddington’ rate,
$<1\%$
, see Heckman & Best Reference Heckman and Best2014, and below). However, many of the most powerful radio-loud AGN in the distant Universe are powered by SMBH with very high accretion rates (e.g. Drouart et al. Reference Drouart2014). This difference is thought to be due to differing natures of the accretion disc at high and low accretion rates. Typically, these rates are normalised to the theoretical maximum accretion rate (the ‘Eddington’ rate,  $\lambda_{\rm EDD}=1$
). By comparison to stellar mass black holes in our own galaxy (Merloni, Heinz, & di Matteo Reference Merloni and Heinz2003; Fender, Belloni, & Gallo Reference Fender, Belloni and Gallo2004; McHardy et al. Reference McHardy, Koerding, Knigge, Uttley and Fender2006), SMBHs with low Eddington accretion rates,
$\lambda_{\rm EDD}=1$
). By comparison to stellar mass black holes in our own galaxy (Merloni, Heinz, & di Matteo Reference Merloni and Heinz2003; Fender, Belloni, & Gallo Reference Fender, Belloni and Gallo2004; McHardy et al. Reference McHardy, Koerding, Knigge, Uttley and Fender2006), SMBHs with low Eddington accretion rates,  $\lambda_{\rm EDD}\le 0.01$
, are thought to have a thick disc, efficient at producing jets whereas SMBHs with high Eddington accretion rates,
$\lambda_{\rm EDD}\le 0.01$
, are thought to have a thick disc, efficient at producing jets whereas SMBHs with high Eddington accretion rates,  $\lambda_{\rm EDD}> 0.01$
, are thought to have a thin disc (TD) which is less efficient at producing jets. However, both states of accretion disc can produce jets with powers proportional to the SMBH mass, spin, and accretion (Meier Reference Meier2002). However, converting from the observed radio luminosity to jet power is complex and involves taking into account the environment of the AGN (e.g. Krause et al. Reference Krause2019).
$\lambda_{\rm EDD}> 0.01$
, are thought to have a thin disc (TD) which is less efficient at producing jets. However, both states of accretion disc can produce jets with powers proportional to the SMBH mass, spin, and accretion (Meier Reference Meier2002). However, converting from the observed radio luminosity to jet power is complex and involves taking into account the environment of the AGN (e.g. Krause et al. Reference Krause2019).
Giant radio galaxies (GRGs) are a rare class of radio-loud AGN with projected maximum angular extents  $>1\,$
Mpc of which only a few hundred are known (Kuźmicz et al. Reference Kuźmicz, Jamrozy, Bronarska, Janda-Boczar and Saikia2018, and references therein). It is unusual for radio sources to grow so large as it presumably requires a low enough density in the local intergalactic medium (IGM) to travel far, but a high enough density that the observed jets have something to work against, thereby creating ‘hotspots’ where the jets terminate against the IGM. Giant radio sources are believed to be the late stage in the evolution of otherwise normal radio galaxies such as Cygnus A (Ishwara-Chandra & Saikia Reference Ishwara-Chandra and Saikia1999). If this is true then there must be many more giant radio sources than known today, but are missed due to observational selection effects. Komberg and Pashchenko (Reference Komberg and Pashchenko2009) have shown that GRGs are no different to the population of less extended radio-loud AGN in terms of lobe asymmetry, prevalence of high excitation lines in host, radio powers, and environments. Indeed, GRGs are found in both isolated environments and rich clusters.
$>1\,$
Mpc of which only a few hundred are known (Kuźmicz et al. Reference Kuźmicz, Jamrozy, Bronarska, Janda-Boczar and Saikia2018, and references therein). It is unusual for radio sources to grow so large as it presumably requires a low enough density in the local intergalactic medium (IGM) to travel far, but a high enough density that the observed jets have something to work against, thereby creating ‘hotspots’ where the jets terminate against the IGM. Giant radio sources are believed to be the late stage in the evolution of otherwise normal radio galaxies such as Cygnus A (Ishwara-Chandra & Saikia Reference Ishwara-Chandra and Saikia1999). If this is true then there must be many more giant radio sources than known today, but are missed due to observational selection effects. Komberg and Pashchenko (Reference Komberg and Pashchenko2009) have shown that GRGs are no different to the population of less extended radio-loud AGN in terms of lobe asymmetry, prevalence of high excitation lines in host, radio powers, and environments. Indeed, GRGs are found in both isolated environments and rich clusters.
Broadband radio surveys can provide key insights into the astrophysics occurring at these wavelengths in radio-loud AGN (e.g. Callingham et al. Reference Callingham2017). To model the radio emission and constrain radio jet powers and ages (e.g. Shabala et al. Reference Shabala, Ash, Alexander and Riley2008; Turner & Shabala Reference Turner and Shabala2015; Hardcastle et al. Reference Hardcastle2019; Turner et al. Reference Turner, Rogers, Shabala and Krause2018a) require surveys with broadband radio data. The ideal region of sky for this work is the Galaxy And Mass Assembly (GAMA, Driver et al. Reference Driver2009) survey field at RA  $\sim 23^{\rm h}$
and dec.
$\sim 23^{\rm h}$
and dec.  $\sim -32.5^\circ$
(hereafter the ‘G23 field’) due to its declination and superb multi-wavelength coverage. As part of this effort, the GAMA Legacy Australia Telescope Compact Array (ATCA) Southern Survey (GLASS) is providing deep (
$\sim -32.5^\circ$
(hereafter the ‘G23 field’) due to its declination and superb multi-wavelength coverage. As part of this effort, the GAMA Legacy Australia Telescope Compact Array (ATCA) Southern Survey (GLASS) is providing deep ( ${\sim} 30\,\mu$
Jy/beam RMS) radio observations at 5.5 and 9.5 GHz over G23. As an extension of GLASS, this field has also been observed with the upgraded Giant Metre-wavelength Radio Telescope (uGMRT) as part of the uGMRT/GLASS project at 250–500 and 500–
${\sim} 30\,\mu$
Jy/beam RMS) radio observations at 5.5 and 9.5 GHz over G23. As an extension of GLASS, this field has also been observed with the upgraded Giant Metre-wavelength Radio Telescope (uGMRT) as part of the uGMRT/GLASS project at 250–500 and 500– $800\,$
MHz.
$800\,$
MHz.
In this paper, we present the most sensitive radio images of PKS  $2250-351$
, a GRG lying in G23, using Australian Square Kilometre Array Pathfinder (ASKAP), uGMRT, ATCA, and the Murchison Widefield Array (MWA). These observations allow us to detect various morphological features, in particular, the diffuse extended emission in the lobes and hotspots. We study the broadband radio properties of PKS
$2250-351$
, a GRG lying in G23, using Australian Square Kilometre Array Pathfinder (ASKAP), uGMRT, ATCA, and the Murchison Widefield Array (MWA). These observations allow us to detect various morphological features, in particular, the diffuse extended emission in the lobes and hotspots. We study the broadband radio properties of PKS  $2250-351$
, the multi-wavelength properties of the its host galaxy, its AGN characteristics, and environment. This paper is organised into the following sections. Section 2 presents the radio observations and GAMA data on the host galaxy. In Section 3, we present the modelling and analysis of both the radio data and the host galaxy data. We discuss these results in Section 4 and conclude this work in Section 5. Throughout this paper, we use a flat ‘concordance’ cosmology of
$2250-351$
, the multi-wavelength properties of the its host galaxy, its AGN characteristics, and environment. This paper is organised into the following sections. Section 2 presents the radio observations and GAMA data on the host galaxy. In Section 3, we present the modelling and analysis of both the radio data and the host galaxy data. We discuss these results in Section 4 and conclude this work in Section 5. Throughout this paper, we use a flat ‘concordance’ cosmology of  $H_0=70\,$
km s–1 and
$H_0=70\,$
km s–1 and  $\Omega_M = 0.3 = 1- \Omega_\Lambda$
. We define radio spectral index,
$\Omega_M = 0.3 = 1- \Omega_\Lambda$
. We define radio spectral index,  $\alpha$
, by
$\alpha$
, by  $S_\nu\propto\nu^\alpha$
.
$S_\nu\propto\nu^\alpha$
.
2. Observations
2.1. Radio data
Brown and Burns (Reference Brown and Burns1991) associated PKS  $2250-351$
with the cluster Abell 3936 and assigned both an estimated redshift from Abell, Corwin, and Olowin (Reference Abell, Corwin and Olowin1989). Note all the radio surveys mentioned below (literature and new) use, or are matched to within 1–2% of, the Baars et al. (Reference Baars, Genzel, Pauliny-Toth and Witzel1977) flux density scale.
$2250-351$
with the cluster Abell 3936 and assigned both an estimated redshift from Abell, Corwin, and Olowin (Reference Abell, Corwin and Olowin1989). Note all the radio surveys mentioned below (literature and new) use, or are matched to within 1–2% of, the Baars et al. (Reference Baars, Genzel, Pauliny-Toth and Witzel1977) flux density scale.
2.1.1. Literature radio data
The NRAO VLA Sky Survey (NVSS at 1.4 GHz, Condon et al. Reference Condon, Cotton, Greisen, Yin, Perley, Perley, Taylor and Broderick1998) and the Sydney University Molonglo Sky Survey (SUMSS at 0.843 GHz, Bock, Large, & Sadler Reference Bock, Large and Sadler1999) images of PKS  $2250-351$
reveal the classic lobe–core–lobe morphology, typical of a resolved radio galaxy. From these images, we observe that it is approximately 5 arcmin in maximum extent. Based upon the spectroscopic redshift of its host,
$2250-351$
reveal the classic lobe–core–lobe morphology, typical of a resolved radio galaxy. From these images, we observe that it is approximately 5 arcmin in maximum extent. Based upon the spectroscopic redshift of its host,  $z=0.2115$
[from the 2dF Galaxy Redshift Survey (2dFGRS) (Colless et al. Reference Colless2001, see Section 2.2.1)], this radio source is
$z=0.2115$
[from the 2dF Galaxy Redshift Survey (2dFGRS) (Colless et al. Reference Colless2001, see Section 2.2.1)], this radio source is  ${\ge}1\,$
MpcFootnote a in size. The Tata Institute of Fundamental Research (TIFR) GMRT Sky Survey Alternative Data Release 1 (TGSS ADR1 at
${\ge}1\,$
MpcFootnote a in size. The Tata Institute of Fundamental Research (TIFR) GMRT Sky Survey Alternative Data Release 1 (TGSS ADR1 at  ${\sim} 0.15\,$
GHz, Intema et al. Reference Intema, Jagannathan, Mooley and Frail2017) detects the lobes, and presents faint, uncatalogued emission at the position of the core at 15–20 mJy/beam. The core of PKS
${\sim} 0.15\,$
GHz, Intema et al. Reference Intema, Jagannathan, Mooley and Frail2017) detects the lobes, and presents faint, uncatalogued emission at the position of the core at 15–20 mJy/beam. The core of PKS  $2250-351$
is detected in the Australia Telescope 20 GHz (AT20G) survey (Murphy et al. Reference Murphy2006) which also provides 5 and 8 GHz measurements. In the AT20G catalogue, this source has a quality flag of ‘poor’, meaning the flux densities were measured from lower quality data. The radio photometry from NVSS, SUMSS, AT20G, and TGSS is presented in Table 1.
$2250-351$
is detected in the Australia Telescope 20 GHz (AT20G) survey (Murphy et al. Reference Murphy2006) which also provides 5 and 8 GHz measurements. In the AT20G catalogue, this source has a quality flag of ‘poor’, meaning the flux densities were measured from lower quality data. The radio photometry from NVSS, SUMSS, AT20G, and TGSS is presented in Table 1.
Table 1. Radio flux densities of the components of PKS  $\text{2250-351}$
. The GLASS, ATCA green time, ASKAP and uGMRT data are presented here for the first time. The other data here come from AT20G (Murphy et al. Reference Murphy2010), NVSS (Condon et al. Reference Condon, Cotton, Greisen, Yin, Perley, Perley, Taylor and Broderick1998), SUMSS (Bock, Large, & Sadler Reference Bock, Large and Sadler1999), GLEAM DR1 (Hurley-Walker et al. Reference Hurley-Walker2017), and TGSS ADR1 (Intema et al. Reference Intema, Jagannathan, Mooley and Frail2017). The extended lobe emission seen in the ASKAP and uGMRT images was determined by summing the flux density over an irregular polygon measured on the ASKAP image (see text for more details). For the higher resolution GLASS data, we present the flux densities of just the hotspots as the lobes are resolved out. The columns are: radio telescope used, survey the data are from, the component measured depending on resolution and brightness sensitivity, the observed frequency, the bandwidth, then the flux density (with uncertainty
$\text{2250-351}$
. The GLASS, ATCA green time, ASKAP and uGMRT data are presented here for the first time. The other data here come from AT20G (Murphy et al. Reference Murphy2010), NVSS (Condon et al. Reference Condon, Cotton, Greisen, Yin, Perley, Perley, Taylor and Broderick1998), SUMSS (Bock, Large, & Sadler Reference Bock, Large and Sadler1999), GLEAM DR1 (Hurley-Walker et al. Reference Hurley-Walker2017), and TGSS ADR1 (Intema et al. Reference Intema, Jagannathan, Mooley and Frail2017). The extended lobe emission seen in the ASKAP and uGMRT images was determined by summing the flux density over an irregular polygon measured on the ASKAP image (see text for more details). For the higher resolution GLASS data, we present the flux densities of just the hotspots as the lobes are resolved out. The columns are: radio telescope used, survey the data are from, the component measured depending on resolution and brightness sensitivity, the observed frequency, the bandwidth, then the flux density (with uncertainty ${^{\rm f}}$
) of the east lobe, core, west lobe, and the total flux.
${^{\rm f}}$
) of the east lobe, core, west lobe, and the total flux.
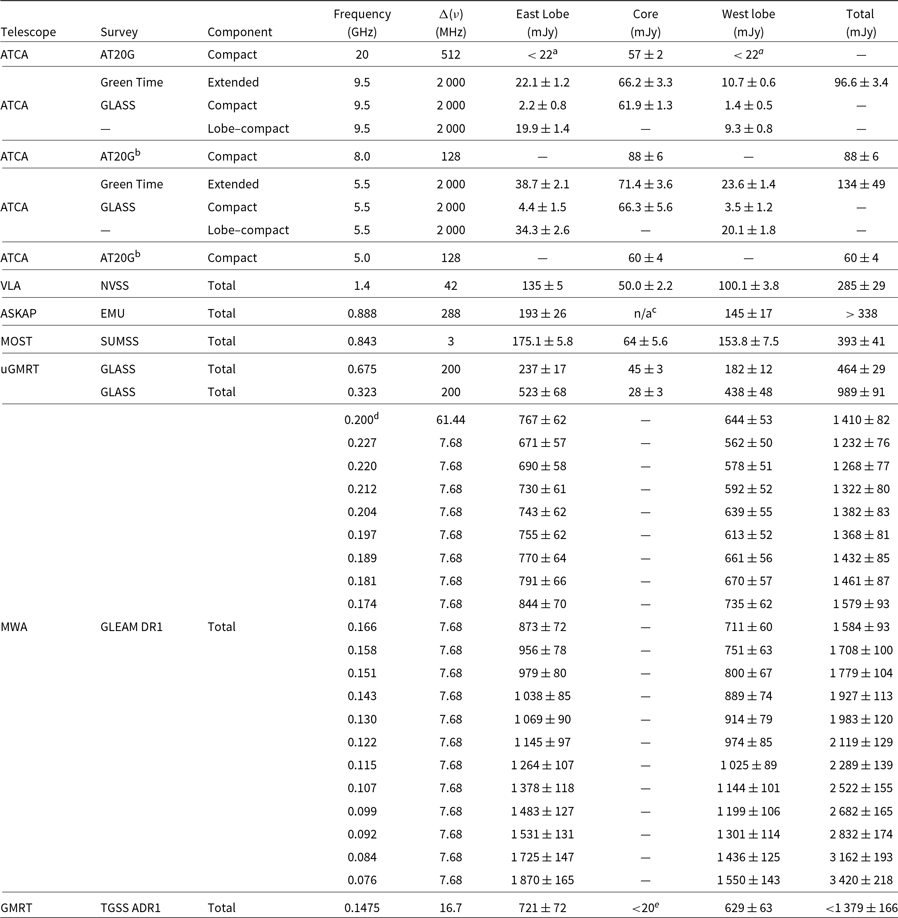
aThe MWA uncertainties include an additional 8% to account for the overall flux calibration.
b2σ upper limits from 20GHz image provided by P. Hancock (private communication).
cNote AT20G images at 5 and 8GHz are not available so there are no constraints on the lobes at these frequencies
dIt is not possible to determine the core flux density in the ASKAP image due to bandwidth smearing.
e0.2GHz MWA flux determined from wide-band (170-230 MHz) image. The other MWA photometry uses the position in the wide-band image as a prior (see §2.1.1).
fEstimated upper limit from visual inspection of image (see §2.1.1).
We also use data from the low-frequency GaLactic and Extragalactic All-sky MWA (GLEAM) survey (Wayth et al. Reference Wayth2015) conducted in phase 1 of the MWA (Tingay et al. Reference Tingay2013). The first GLEAM extragalactic data release (hereafter DR1 Hurley-Walker et al. Reference Hurley-Walker2017) provides 20 band photometry across 70–230 MHz over a large fraction of the southern sky. Radio sources were detected, and had their flux densities measured, in a deep, high-resolution 170–230 MHz image. Each detected source then had its flux density measured in each of the 20 sub-bands using the positions found in the deep 170–230 MHz image as priors (see Hurley-Walker et al. Reference Hurley-Walker2017, for more details). This approach ameliorated the blending of sources at lower frequencies. The two lobes of PKS  $2250-351$
are detected at high significance at 170–230 MHz and their published MWA flux densities are reported in Table 1. Note the corresponding uncertainties have had an 8% systematic uncertainty added in quadrature.
$2250-351$
are detected at high significance at 170–230 MHz and their published MWA flux densities are reported in Table 1. Note the corresponding uncertainties have had an 8% systematic uncertainty added in quadrature.
2.1.2. ASKAP early science data
ASKAP (Johnston et al. Reference Johnston2007; McConnell et al. Reference McConnell2016) utilises the revolutionary phased array feeds (PAFs) that densely sample the focal plane of the 12 m antennas with 188 dipoles. To cover the full field of view of the PAF, 36 beams are electronically formed by combining the signals from individual dipoles. Each beam is correlated with the corresponding beam from every other antenna. These data were obtained before the fringes were tracked for each beam (rather than just the centre of the field of view) which results in significant peak flux density suppression for sources near the field edges due to bandwidth smearing.
The G23 field was observed several times during the commissioning and early science period of ASKAP (e.g. Leahy et al. Reference Leahy2019). In this paper, we include data observed on 2018 September 30 with 28 of the final 36 antennas which simultaneously observed 36 primary beams arranged in a square  $6\times6$
footprint as part of Evolutionary Map of the Universe (EMU, Norris et al. Reference Norris2011) project early science. The total integration time was 11 h with 288 MHz bandwidth centred on 888 MHz.
$6\times6$
footprint as part of Evolutionary Map of the Universe (EMU, Norris et al. Reference Norris2011) project early science. The total integration time was 11 h with 288 MHz bandwidth centred on 888 MHz.
The data were processed using the ASKAPsoft pipelineFootnote b on the Galaxy supercomputer hosted by the Pawsey Supercomputing Centre. The data for each of the 36 beams were bandpass and flux calibrated by observing the primary calibrator source PKS B $1934-638$
at the centre of each primary beam for approximately 3 min. The bandpass was then solved using the Reynolds (Reference Reynolds1994) model and the solutions were applied to the science target observations. Images for each beam were produced independently in parallel by gridding the visibility data using the WProject ASKAPsoft gridder then deconvolving the dirty images with the BasisfunctionMFS clean solver, an improved version of the MultiScale algorithm available in CASA (McMullin et al. Reference McMullin, Waters, Schiebel, Young and Golap2007). Two iterations of phase-only self-calibration were performed: the first used only a single delta function scale and included only detected components at
$1934-638$
at the centre of each primary beam for approximately 3 min. The bandpass was then solved using the Reynolds (Reference Reynolds1994) model and the solutions were applied to the science target observations. Images for each beam were produced independently in parallel by gridding the visibility data using the WProject ASKAPsoft gridder then deconvolving the dirty images with the BasisfunctionMFS clean solver, an improved version of the MultiScale algorithm available in CASA (McMullin et al. Reference McMullin, Waters, Schiebel, Young and Golap2007). Two iterations of phase-only self-calibration were performed: the first used only a single delta function scale and included only detected components at  ${>}20\sigma$
in the calibration model. The second iteration also used a single delta function scale, but with a lower component threshold of
${>}20\sigma$
in the calibration model. The second iteration also used a single delta function scale, but with a lower component threshold of  $8\sigma$
. The self-calibration solutions were then applied to the data and a final image was produced for each beam using three deconvolution scales: 0 (i.e. the delta function), 15, and 30 pixels. All 36 individual beam images were then combined using a linear mosaic algorithm that corrects for the primary beam attenuation and combines the images using a weighted average.
$8\sigma$
. The self-calibration solutions were then applied to the data and a final image was produced for each beam using three deconvolution scales: 0 (i.e. the delta function), 15, and 30 pixels. All 36 individual beam images were then combined using a linear mosaic algorithm that corrects for the primary beam attenuation and combines the images using a weighted average.

Figure 1. Greyscale image of PKS  $\text{2250-351}$
from our 888 MHz ASKAP continuum data. The local RMS is
$\text{2250-351}$
from our 888 MHz ASKAP continuum data. The local RMS is  ${\sim} \text{64}\,\mu$
Jy/beam and the restoring beam has a full-width half maximum of
${\sim} \text{64}\,\mu$
Jy/beam and the restoring beam has a full-width half maximum of  $\text{10.55}$
arcsec
$\text{10.55}$
arcsec  $\times \text{7.82}$
arcsec (indicated in the lower left). The greyscale is a linear stretch in Jy/beam as indicated by the colour bar. The red contours start at
$\times \text{7.82}$
arcsec (indicated in the lower left). The greyscale is a linear stretch in Jy/beam as indicated by the colour bar. The red contours start at  $\text{4}\sigma$
and increase by factors of
$\text{4}\sigma$
and increase by factors of  $\sqrt{\text{2}}$
. The two black rectangles indicate the regions of the GLASS data presented in Figure 2. The core is clearly identified as well as hotspots positioned on top of diffuse emission from the lobes. Within the eastern lobe, the jet is observed with several knots. The total angular size is
$\sqrt{\text{2}}$
. The two black rectangles indicate the regions of the GLASS data presented in Figure 2. The core is clearly identified as well as hotspots positioned on top of diffuse emission from the lobes. Within the eastern lobe, the jet is observed with several knots. The total angular size is  $\text{5.66}$
arcmin (
$\text{5.66}$
arcmin ( $\equiv\,\text{1.17}\,$
Mpc
$\equiv\,\text{1.17}\,$
Mpc $^{\text{1}}$
) with equal lobe lengths. However, the width of each lobe is markedly different with the western lobe being
$^{\text{1}}$
) with equal lobe lengths. However, the width of each lobe is markedly different with the western lobe being  $\text{1.4}\times$
wider than the eastern lobe.
$\text{1.4}\times$
wider than the eastern lobe.
In Figure 1, we present the continuum image of a cutout around PKS  $2250-351$
from these data. This image nicely reveals the bright hotspots located on top of diffuse lobe emission and it also highlights the eastern jet. The high fidelity of the image is due to the superb uv-coverage from a long integration with 36 antennas of ASKAPFootnote c. The restoring beam used in this image was 10.55 arcsec
$2250-351$
from these data. This image nicely reveals the bright hotspots located on top of diffuse lobe emission and it also highlights the eastern jet. The high fidelity of the image is due to the superb uv-coverage from a long integration with 36 antennas of ASKAPFootnote c. The restoring beam used in this image was 10.55 arcsec  $\times$
7.82 arcsec (full width half maximum for an elliptical Gaussian) with a beam position angle (BPA) of
$\times$
7.82 arcsec (full width half maximum for an elliptical Gaussian) with a beam position angle (BPA) of  $86.8^\circ$
.
$86.8^\circ$
.
Since PKS  $2250-351$
lies near the field edge, we do not use the flux density for the core as it is highly smeared. However, as flux is conserved, we can measure the total flux of each lobe by summing the flux density in bespoke irregular polygons around each lobe (tracing the approximate
$2250-351$
lies near the field edge, we do not use the flux density for the core as it is highly smeared. However, as flux is conserved, we can measure the total flux of each lobe by summing the flux density in bespoke irregular polygons around each lobe (tracing the approximate  $3\sigma$
contour and with no sigma-clipping applied). We convert from the image native units of Jy/beam to mJy using the beam sizeFootnote d converted to square pixels. Uncertainties are derived from the RMS measured within these polygons multiplied by the square root of the area of the polygon in units of beam size. These flux densities and uncertainties are reported in Table 1.
$3\sigma$
contour and with no sigma-clipping applied). We convert from the image native units of Jy/beam to mJy using the beam sizeFootnote d converted to square pixels. Uncertainties are derived from the RMS measured within these polygons multiplied by the square root of the area of the polygon in units of beam size. These flux densities and uncertainties are reported in Table 1.
From the image in Figure 1, we can more accurately estimate the total size to be  $5.66$
arcmin (
$5.66$
arcmin ( $\equiv\,1.17\,$
Mpc
$\equiv\,1.17\,$
Mpc $^1$
, projected size) and find the lobe lengths to be equal.
$^1$
, projected size) and find the lobe lengths to be equal.
2.1.3. GLASS radio data
GLASS is targeting this field over six semesters (across 2016–2019) with ATCA and will provide images and catalogues of the G23 survey field at 5.5 and  $9.5\,$
GHz. The data were acquired with a 2 GHz bandwidth at both frequencies and with the correlator in 1 MHz mode. ATCA was in a 6 and 1.5 km configuration for 69% and 31% of the time, respectively. The data used here has a restoring beam of 4 arcsec
$9.5\,$
GHz. The data were acquired with a 2 GHz bandwidth at both frequencies and with the correlator in 1 MHz mode. ATCA was in a 6 and 1.5 km configuration for 69% and 31% of the time, respectively. The data used here has a restoring beam of 4 arcsec $\times$
2 arcsec (BPA
$\times$
2 arcsec (BPA  $={} 0^\circ$
), and an RMS of
$={} 0^\circ$
), and an RMS of  ${\sim} 24\,\mu$
Jy/beam at 5.5 GHz, and 3.4 arcsec
${\sim} 24\,\mu$
Jy/beam at 5.5 GHz, and 3.4 arcsec $\times$
1.7 arcsec BPA
$\times$
1.7 arcsec BPA  $={}0^\circ$
and
$={}0^\circ$
and  ${\sim} 40\,\mu$
Jy/beam at 9.5 GHz. The data were processed in the standard fashion (see the Users GuideFootnote e) with MIRIAD (Sault, Teuben, & Wright Reference Sault, Teuben, Wright, Shaw, Payne and Hayes1995) using a method similar to that outlined in Huynh et al. (Reference Huynh, Bell, Hopkins, Norris and Seymour2015). The phase calibrator was PKS
${\sim} 40\,\mu$
Jy/beam at 9.5 GHz. The data were processed in the standard fashion (see the Users GuideFootnote e) with MIRIAD (Sault, Teuben, & Wright Reference Sault, Teuben, Wright, Shaw, Payne and Hayes1995) using a method similar to that outlined in Huynh et al. (Reference Huynh, Bell, Hopkins, Norris and Seymour2015). The phase calibrator was PKS  $2254-367$
. The bright, compact, flat-spectrum core of PKS
$2254-367$
. The bright, compact, flat-spectrum core of PKS  $2250-351$
is easily detected in GLASS, but the steep-spectrum diffuse lobes are resolved out due to the minimum short baselines of
$2250-351$
is easily detected in GLASS, but the steep-spectrum diffuse lobes are resolved out due to the minimum short baselines of  ${\sim} 100$
m (
${\sim} 100$
m ( $\equiv 3.2\,k\lambda$
at 9.5 GHz) used in GLASS. However, the two hotspots are clearly detected at both frequencies (see Figure 2).
$\equiv 3.2\,k\lambda$
at 9.5 GHz) used in GLASS. However, the two hotspots are clearly detected at both frequencies (see Figure 2).

Figure 2. Greyscale ATCA 9.5 GHz images with 5.5 GHz images overlaid as red contours. The contours of the main panel (from the ‘green time’ data) start at  $\text{3}\times\sigma$
(
$\text{3}\times\sigma$
( $\sigma \text{=} \text{200}\,\mu$
Jy/beam). The contours of the inset panels (close-ups of the hotspots from GLASS) start at
$\sigma \text{=} \text{200}\,\mu$
Jy/beam). The contours of the inset panels (close-ups of the hotspots from GLASS) start at  $\text{3}\times\sigma$
(
$\text{3}\times\sigma$
( $\sigma\text{=} \text{24}\,\mu$
Jy/beam). Both sets of contours increase by factors of
$\sigma\text{=} \text{24}\,\mu$
Jy/beam). Both sets of contours increase by factors of  $\sqrt{\text{2}}$
. The resolution is indicated in the lower left of each panel by the ellipses (solid 9.5 GHz and dashed 5.5 GHz). The greyscale stretch of the main figure, indicated by the colour bar, is in Jy/beam. The stretch of the inserts is a linear stretch from
$\sqrt{\text{2}}$
. The resolution is indicated in the lower left of each panel by the ellipses (solid 9.5 GHz and dashed 5.5 GHz). The greyscale stretch of the main figure, indicated by the colour bar, is in Jy/beam. The stretch of the inserts is a linear stretch from  $\text{-0.2}$
to
$\text{-0.2}$
to  $\text{+0.3}\,$
mJy/beam.
$\text{+0.3}\,$
mJy/beam.
We can measure the flux densities of the hotspots using small ellipses and sum up the flux in a similar fashion as with the lobes in the ASKAP images. The flux densities are converted to mJy and the uncertainties are determined as before, and presented in Table 1.
2.1.4. Additional ATCA observations
As the lobes of this radio source were resolved out in the GLASS observations, we requested ATCA ‘green time’ observations. We used the same frequencies and bandwidths as GLASS, but in the compact H168 configuration to measure the extended flux densities. These observations were taken on November 31 and 2018 December 1 with about 4 and 6.5 h on source time. The data were reduced in a standard fashion with the MIRIAD software. PKS B $1934-638$
was used to establish an absolute flux density consistent with the Baars et al. (Reference Baars, Genzel, Pauliny-Toth and Witzel1977) standard as well as to derive our bandpass correction. The data were flagged for radio frequency interference using the guided automated flagging pgflag task. The bandpass was established using the radio spectrum of PKS B
$1934-638$
was used to establish an absolute flux density consistent with the Baars et al. (Reference Baars, Genzel, Pauliny-Toth and Witzel1977) standard as well as to derive our bandpass correction. The data were flagged for radio frequency interference using the guided automated flagging pgflag task. The bandpass was established using the radio spectrum of PKS B $1934-638$
as a reference. The solutions were then copied over to the phase calibrator, PKS
$1934-638$
as a reference. The solutions were then copied over to the phase calibrator, PKS  $2254-367$
, and a time-dependent phase solution was determined.
$2254-367$
, and a time-dependent phase solution was determined.
Four pointings were used to adequately cover the full extent of PKS  $2250-351$
due to the size of the primary beam at 9.5 GHz. Each pointing was imaged independently using the mfclean task to perform image deconvolution while accounting for the spectral variation of both the synthesised beam and source intensity across the 2 GHz bandwidth. After being primary beam-corrected, these four images were then mosaiced together. We used a Briggs robustness weighting of
$2250-351$
due to the size of the primary beam at 9.5 GHz. Each pointing was imaged independently using the mfclean task to perform image deconvolution while accounting for the spectral variation of both the synthesised beam and source intensity across the 2 GHz bandwidth. After being primary beam-corrected, these four images were then mosaiced together. We used a Briggs robustness weighting of  $R=0$
at
$R=0$
at  $5.5\,$
GHz and
$5.5\,$
GHz and  $R=1$
at
$R=1$
at  $9.5\,$
GHz. In the resultant images, we obtained an RMS of
$9.5\,$
GHz. In the resultant images, we obtained an RMS of  ${\sim} 0.2\,$
mJy/beam and
${\sim} 0.2\,$
mJy/beam and  ${\sim} 0.1\,$
mJy/beam at
${\sim} 0.1\,$
mJy/beam at  $5.5$
and
$5.5$
and  $9.5\,$
GHz, respectively. The restoring beams were 46.8 arcsec
$9.5\,$
GHz, respectively. The restoring beams were 46.8 arcsec $\times$
27.8 arcsec (BPA
$\times$
27.8 arcsec (BPA $=79.1^\circ$
) and 31.0 arcsec
$=79.1^\circ$
) and 31.0 arcsec $\times$
18.6 arcsec (BPA
$\times$
18.6 arcsec (BPA $=73.5^\circ$
). We measured the flux densities using the AEGEAN package (Hancock, Trott, & Hurley-Walker Reference Hancock, Trott and Hurley-Walker2018) and report these flux densities in Table 1. We conservatively have added in quadrature a 5% absolute flux calibration uncertainty (e.g. the ATCA users guide and Partridge et al. Reference Partridge, López-Caniego, Perley, Stevens, Butler, Rocha, Walter and Zacchei2016) to the AEGEAN uncertainties to account for the ATCA absolute flux calibration. We note that the core flux densities measured here with the lower resolution configuration agree well with those measured from the higher resolution GLASS data. The lobe flux densities were derived by subtracting the compact (i.e. hotspot) emission from the total extended flux densities.
$=73.5^\circ$
). We measured the flux densities using the AEGEAN package (Hancock, Trott, & Hurley-Walker Reference Hancock, Trott and Hurley-Walker2018) and report these flux densities in Table 1. We conservatively have added in quadrature a 5% absolute flux calibration uncertainty (e.g. the ATCA users guide and Partridge et al. Reference Partridge, López-Caniego, Perley, Stevens, Butler, Rocha, Walter and Zacchei2016) to the AEGEAN uncertainties to account for the ATCA absolute flux calibration. We note that the core flux densities measured here with the lower resolution configuration agree well with those measured from the higher resolution GLASS data. The lobe flux densities were derived by subtracting the compact (i.e. hotspot) emission from the total extended flux densities.
2.1.5. uGMRT radio data
Our ongoing campaign to study the G23 field with uGMRT includes data in both band-3 (250–500 MHz) and band-4 (550–850 MHz). In band-3, the survey consists of 50 pointings with each pointing observed for about 30 min in semi-snapshot mode to cover a contiguous  $50\,\deg^2$
in total. The band-4 data consists of dedicated pointings of sources of interest in the G23 field with an ON source time of about 1.5 h. The data were recorded with the wideband correlator with 200 MHz bandwidth as well as through the narrow band legacy system (32 MHz bandwidth). The band-4 data were processed using a CASA-based pipeline following procedures appropriate for wideband imaging. For band-3, the wideband data were processed using the CASA-based pipeline and the legacy narrow band data was analysed using the SPAM pipeline (Intema et al. Reference Intema, van der Tol, Cotton, Cohen, van Bemmel and Röttgering2009).
$50\,\deg^2$
in total. The band-4 data consists of dedicated pointings of sources of interest in the G23 field with an ON source time of about 1.5 h. The data were recorded with the wideband correlator with 200 MHz bandwidth as well as through the narrow band legacy system (32 MHz bandwidth). The band-4 data were processed using a CASA-based pipeline following procedures appropriate for wideband imaging. For band-3, the wideband data were processed using the CASA-based pipeline and the legacy narrow band data was analysed using the SPAM pipeline (Intema et al. Reference Intema, van der Tol, Cotton, Cohen, van Bemmel and Röttgering2009).
PKS  $2250-351$
is near half-power beam width and since the primary beam correction is not well established for the wideband at the time of the analysis, we have used the legacy narrow band data at 325 MHz, instead of the full band-3 for flux measurements. The primary beam correction is applied to each pointing before mosaicing the images from the narrow band legacy system. The band-3 image has a best RMS of
$2250-351$
is near half-power beam width and since the primary beam correction is not well established for the wideband at the time of the analysis, we have used the legacy narrow band data at 325 MHz, instead of the full band-3 for flux measurements. The primary beam correction is applied to each pointing before mosaicing the images from the narrow band legacy system. The band-3 image has a best RMS of  ${\sim}100\,\mu$
Jy/beam, the legacy 325 MHz image has RMS of
${\sim}100\,\mu$
Jy/beam, the legacy 325 MHz image has RMS of  ${\sim}300\,\mu$
Jy/beam, and the band-4 has RMS of
${\sim}300\,\mu$
Jy/beam, and the band-4 has RMS of  ${\sim} 22\,\mu$
Jy/beam. The restoring beams are 15.8 arcsec
${\sim} 22\,\mu$
Jy/beam. The restoring beams are 15.8 arcsec $\times$
6.71 arcsec (BPA
$\times$
6.71 arcsec (BPA $=9.5^\circ$
) and 7.11 arcsec
$=9.5^\circ$
) and 7.11 arcsec $\times$
3.59 arcsec (BPA
$\times$
3.59 arcsec (BPA $=23.7^\circ$
) in band-3 and band-4, respectively (and the restoring beam of the band-3 legacy image is 12.4 arcsec
$=23.7^\circ$
) in band-3 and band-4, respectively (and the restoring beam of the band-3 legacy image is 12.4 arcsec  $\times$
8.0 arcsec, BPA
$\times$
8.0 arcsec, BPA $=15^\circ$
). Since PKS
$=15^\circ$
). Since PKS  $2250-351$
is quite bright, it is possible to map the features reasonably well. The uGMRT band-4 image is presented in Figure 3 with contours from band-3 overlaid. In band-3, the uGMRT is sensitive to scales up to 32 arcmin, well beyond the size of this GRG.
$2250-351$
is quite bright, it is possible to map the features reasonably well. The uGMRT band-4 image is presented in Figure 3 with contours from band-3 overlaid. In band-3, the uGMRT is sensitive to scales up to 32 arcmin, well beyond the size of this GRG.

Figure 3. Greyscale image of the band-4 uGMRT image (central frequency 670 MHz). The greyscale stretch in Jy/beam is indicated in the side bar. The red contours of the band-3 legacy data image (central frequency 323 MHz) and start at 2 mJy increasing by  $\sqrt{\text{2}}$
. This image reveals the same structure (the hotspots, diffuse emission, and jet) which we see from the ASKAP image in Figure 1 although does not recover the extended emission quite as well. The restoring beams are shown in the lower left for the band-3 (dashed ellipse) and band-4 (solid ellipse) images.
$\sqrt{\text{2}}$
. This image reveals the same structure (the hotspots, diffuse emission, and jet) which we see from the ASKAP image in Figure 1 although does not recover the extended emission quite as well. The restoring beams are shown in the lower left for the band-3 (dashed ellipse) and band-4 (solid ellipse) images.

Figure 4. (left) The recalibrated 2 dF spectrum of 2MASS J $\text{22533602-3455305}$
. The vertical dashed lines indicate the observed wavelength for spectral lines at
$\text{22533602-3455305}$
. The vertical dashed lines indicate the observed wavelength for spectral lines at  $\textit{z}\text{=}\text{0.2115}$
and the emission line ratios are indicative of an AGN (see text for more). (right) A false colour RGB image of the host galaxy of PKS
$\textit{z}\text{=}\text{0.2115}$
and the emission line ratios are indicative of an AGN (see text for more). (right) A false colour RGB image of the host galaxy of PKS  $\text{2250-351}$
(2MASS J
$\text{2250-351}$
(2MASS J $\text{22533602-3455305}$
). The imaging comes from GAMA with g-band (blue), r-band (green), and Z-band (red). The host galaxy appears elliptical in shape showing no signs of disturbance.
$\text{22533602-3455305}$
). The imaging comes from GAMA with g-band (blue), r-band (green), and Z-band (red). The host galaxy appears elliptical in shape showing no signs of disturbance.
To measure the lobe fluxes from the uGMRT, we used the same method as we did for the ASKAP data employing the same irregular polygons defined by the ASKAP data. The total flux density and uncertainty were determined in the same fashion using the restoring beams given above. The total flux densities of the lobes and core are presented in Table 1.
2.2. Ancillary data
2.2.1. Literature
From the bright compact radio emission at the core, we find that the host galaxy of PKS  $2250-351$
(see Figures 1 and 3) is 2MASS J
$2250-351$
(see Figures 1 and 3) is 2MASS J $22533602-3455305$
(Skrutskie et al. Reference Skrutskie2006). This galaxy has a redshift of
$22533602-3455305$
(Skrutskie et al. Reference Skrutskie2006). This galaxy has a redshift of  $z=0.2115\pm0.0003$
as determined by spectroscopy obtained as part of the 2dF Galaxy Redshift Survey (2dFGRS, Colless et al. Reference Colless2001). We recalibrated the 2dFRG spectrum so that the r-band magnitude derived from it matches the observed GAMA value, including a correction factor of 3.5 for the 2 arcsec fibre not encompassing the entire extent of the galaxy (Figure 4, right). Its spectrum (see Figure 4, left panel) features prominent narrow [OII] and [OIII] emission lines, but the H
$z=0.2115\pm0.0003$
as determined by spectroscopy obtained as part of the 2dF Galaxy Redshift Survey (2dFGRS, Colless et al. Reference Colless2001). We recalibrated the 2dFRG spectrum so that the r-band magnitude derived from it matches the observed GAMA value, including a correction factor of 3.5 for the 2 arcsec fibre not encompassing the entire extent of the galaxy (Figure 4, right). Its spectrum (see Figure 4, left panel) features prominent narrow [OII] and [OIII] emission lines, but the H $\alpha$
line is redshifted out of the observed wavelength range.
$\alpha$
line is redshifted out of the observed wavelength range.
The observed [O iii] $\lambda$
5007/H
$\lambda$
5007/H $\beta$
line ratio is
$\beta$
line ratio is  ${\sim} 0.9$
which is a relatively high value, putting it in the AGN region of [N ii]
${\sim} 0.9$
which is a relatively high value, putting it in the AGN region of [N ii] $\lambda$
6584/H
$\lambda$
6584/H $\alpha$
v [O iii]
$\alpha$
v [O iii] $\lambda$
5007/H
$\lambda$
5007/H $\beta$
parameter space (after Baldwin, Phillips, & Terlevich Reference Baldwin, Phillips and Terlevich1981) for almost all values of [N ii]
$\beta$
parameter space (after Baldwin, Phillips, & Terlevich Reference Baldwin, Phillips and Terlevich1981) for almost all values of [N ii] $\lambda$
6584/H
$\lambda$
6584/H $\alpha$
. The bright [O ii] and [O iii] lines are narrow (
$\alpha$
. The bright [O ii] and [O iii] lines are narrow ( ${<}1\,000\,$
km/s) which is consistent with this galaxy being an obscured AGN. This spectrum was obtained from a 2 arcsec fibre, smaller than the total extent of the galaxy (7–8 arcsec), hence it is perhaps not surprising that the nuclear emission lines dominate this spectrum.
${<}1\,000\,$
km/s) which is consistent with this galaxy being an obscured AGN. This spectrum was obtained from a 2 arcsec fibre, smaller than the total extent of the galaxy (7–8 arcsec), hence it is perhaps not surprising that the nuclear emission lines dominate this spectrum.
2.2.2. GAMA
The GAMA survey provides ugriz optical photometry from the VLT Survey Telescope (VST) and YJHK near-IR photometry from the Visible and Infrared Survey Telescope for Astronomy (VISTA) for the G23 field. We present the photometric data of PKS  $2250{-}351$
in Table 2 measured by the ProFound software (Robotham et al. Reference Robotham, Davies, Driver, Koushan, Taranu, Casura and Liske2018). In a zJK RGB image (Figure 4), the host galaxy appears extended and elliptical. The upcoming public release of these G23 data will include a cross-matched catalogue of
$2250{-}351$
in Table 2 measured by the ProFound software (Robotham et al. Reference Robotham, Davies, Driver, Koushan, Taranu, Casura and Liske2018). In a zJK RGB image (Figure 4), the host galaxy appears extended and elliptical. The upcoming public release of these G23 data will include a cross-matched catalogue of  $\sim$
45k high-quality optical spectra.
$\sim$
45k high-quality optical spectra.
Table 2. The GAMA UV to far-IR photometry of 2MASS J $\text{22533602-3455305}$
, the host galaxy of PKS
$\text{22533602-3455305}$
, the host galaxy of PKS  $\text{2250-351}$
. The WISE flux densities are converted from Vega magnitudes as explained in the text. PACS and SPIRE (100–500
$\text{2250-351}$
. The WISE flux densities are converted from Vega magnitudes as explained in the text. PACS and SPIRE (100–500  $\mu$
m) upper limits are determined from the public H-ATLAS images at
$\mu$
m) upper limits are determined from the public H-ATLAS images at  $\text{2.5}\times$
the local RMS. The columns are: band, effective wavelength and observed flux density with uncertainty.
$\text{2.5}\times$
the local RMS. The columns are: band, effective wavelength and observed flux density with uncertainty.

2.2.3. WISE and Herschel infrared data
The Wide-field Infrared Survey Explorer mission (WISE, Wright et al. Reference Wright2010) imaged nearly the entire sky at 3.4, 4.6, 12, and 22  $\mu$
m. We use the aperture magnitudes of 2MASS J
$\mu$
m. We use the aperture magnitudes of 2MASS J $22533602-3455305$
from the AllWISE catalogueFootnote f which are more appropriate for a slightly extended source. We then converted these to flux densities presented in Table 2 using the conversion factors from Jarrett et al. (Reference Jarrett2011) and Brown, Jarrett, and Cluver (Reference Brown, Jarrett and Cluver2014).
$22533602-3455305$
from the AllWISE catalogueFootnote f which are more appropriate for a slightly extended source. We then converted these to flux densities presented in Table 2 using the conversion factors from Jarrett et al. (Reference Jarrett2011) and Brown, Jarrett, and Cluver (Reference Brown, Jarrett and Cluver2014).
This photometry can be used to derive the following colours:  $W1-W2=0.60\pm 0.04$
and
$W1-W2=0.60\pm 0.04$
and  $W2-W3 = 2.37\pm 0.32$
(where Wx is the Vega magnitude in band x, and 1–3 corresponds to the 3.4, 4.6, and 12
$W2-W3 = 2.37\pm 0.32$
(where Wx is the Vega magnitude in band x, and 1–3 corresponds to the 3.4, 4.6, and 12  $\mu$
m bands, respectively). These colours place the host galaxy in the region of parameter space typically occupied by AGN (due to the hot dust of the torus heated by the accretion disc, Jarrett et al. Reference Jarrett2011; Mateos et al. Reference Mateos2012).
$\mu$
m bands, respectively). These colours place the host galaxy in the region of parameter space typically occupied by AGN (due to the hot dust of the torus heated by the accretion disc, Jarrett et al. Reference Jarrett2011; Mateos et al. Reference Mateos2012).
The GAMA survey fields were also covered with far-IR imaging from the Herschel Astrophysical Terahertz Large Area Survey (H-ATLAS, Eales et al. Reference Eales2010). H-ATLAS imaged large areas of the sky using Herschel’s two imaging instruments [Spectral and Photometric Imaging REceiver (SPIRE) and Photodetector Array Camera and Spectrometer (PACS)Footnote g]. The observations were obtained in PACS-SPIRE parallel mode in which both instruments are used to image the sky simultaneously. The H-ATLAS south galactic pole observations included the G23 field. Like all the other H-ATLAS observations, data were taken at 100 and 160  $\mu$
m with PACS and 250, 350, and 500
$\mu$
m with PACS and 250, 350, and 500  $\mu$
m with SPIRE. This source was not detected in any Herschel band (confirmed by visual inspection) and we list the
$\mu$
m with SPIRE. This source was not detected in any Herschel band (confirmed by visual inspection) and we list the  $2.5\sigma$
upper limits in Table 2.
$2.5\sigma$
upper limits in Table 2.
3. Interpretation and modelling
3.1. Radio morphology
The existence of bright hotspots in the 5.5 and 9.5 GHz seen in the GLASS data (see Figure 2) suggest PKS  $2250-351$
is a Fanaroff and Riley (FR) class II radio galaxy (Fanaroff & Riley Reference Fanaroff and Riley1974), compatible with its total radio luminosity (see Section 3.2.1) although it is unusual in that we observe some asymmetry in the hotspots. Its projected size of 1.17 Mpc classes it as a GRG.
$2250-351$
is a Fanaroff and Riley (FR) class II radio galaxy (Fanaroff & Riley Reference Fanaroff and Riley1974), compatible with its total radio luminosity (see Section 3.2.1) although it is unusual in that we observe some asymmetry in the hotspots. Its projected size of 1.17 Mpc classes it as a GRG.
The ASKAP and uGMRT images reveal more detail on the radio galaxy morphology confirming the asymmetric hotspots seen at 5.5 and 9.5 GHz. The bright hotspots on either side are embedded in diffuse emission which is resolved out in GLASS. On the east lobe the diffuse emission extends well past the bright hotspot, whereas on the western lobe the hotspot is at the end. We ascribe the asymmetry seen in the hotspots, jet, and width of the lobes to the environment of this GRG (see Section 3.4). We suggest that the prominence of the eastern jet is not due to beaming as it would imply a jet direction within  $10^\circ$
of the line of sight, and thus an intrinsic size
$10^\circ$
of the line of sight, and thus an intrinsic size  ${>}6.7\,$
Mpc.
${>}6.7\,$
Mpc.
3.2. Radio modelling
3.2.1. Radio component SEDs
The broadband radio SEDs of the east and west lobes as, well as the core, are presented in Figure 5 using the data in Table 1. We fit both lobes with a single power-law and a broken power-law modelFootnote h (using a least squares method) and find that the single power-law is significantly preferred (using the Akaike information criterion, corrected for small sample sizes, Akaike Reference Akaike1974; Burnham & Anderson Reference Burnham and Anderson2002). The two power-laws are  $\alpha_{\rm east}=-0.94\pm 0.01 $
and
$\alpha_{\rm east}=-0.94\pm 0.01 $
and  $\alpha_{\rm west}=-1.03\pm 0.01$
and are plotted in Figure 5. Note that the lobe fluxes have the contributions of the compact emission (i.e. the hotspots) removed at 5.5 and 9.5 GHz. This correction has only a negligible effect on the spectra (
$\alpha_{\rm west}=-1.03\pm 0.01$
and are plotted in Figure 5. Note that the lobe fluxes have the contributions of the compact emission (i.e. the hotspots) removed at 5.5 and 9.5 GHz. This correction has only a negligible effect on the spectra ( $\Delta\alpha\le 0.03$
). The slopes of the lobe SEDs are steep as expected from synchrotron emission originating from an aged population of relativistic electrons with a steep power-law energy distribution.
$\Delta\alpha\le 0.03$
). The slopes of the lobe SEDs are steep as expected from synchrotron emission originating from an aged population of relativistic electrons with a steep power-law energy distribution.
The uncertainties on these spectral indices are probably underestimated due to some correlation between the MWA flux densities (see Callingham et al. Reference Callingham2017, for a full discussion). By eye one might argue that there is weak evidence for the west lobe becoming steeper above  $1\,$
GHz, but it is possible that some extended emission is still resolved out even with the lower resolution ATCA observations. Hence, we conclude that the spectral indices of each lobe are consistent within our overall uncertainties of their value.
$1\,$
GHz, but it is possible that some extended emission is still resolved out even with the lower resolution ATCA observations. Hence, we conclude that the spectral indices of each lobe are consistent within our overall uncertainties of their value.

Figure 5. The radio (70 MHz to 20 GHz) SEDs of the core and each lobe of PKS  $\text{2250-351}$
as indicated in the insert. The lobe SEDs (with the contribution of the hotspots subtracted) are well parameterised as a single power-law with the best fits overlaid:
$\text{2250-351}$
as indicated in the insert. The lobe SEDs (with the contribution of the hotspots subtracted) are well parameterised as a single power-law with the best fits overlaid:  $\alpha_{\rm east}\text{=-0.94}\pm \text{0.01} $
and
$\alpha_{\rm east}\text{=-0.94}\pm \text{0.01} $
and  $\alpha_{\rm west}\text{=-1.03}\pm \text{0.01}$
.
$\alpha_{\rm west}\text{=-1.03}\pm \text{0.01}$
.
The compact lobe components measured from the GLASS data allow us to determine the two-point spectral (5.5–9.5 GHz) indices of the hotspots. We find values of  $\alpha_{\rm east}^{\rm hs}=-1.27\pm 0.90$
and
$\alpha_{\rm east}^{\rm hs}=-1.27\pm 0.90$
and  $\alpha_{\rm west}^{\rm hs}=-1.68\pm0.91$
. While these values are steeper than those for the lobes, they are consistent with the lobe values within the uncertainties. The hotspots are still detected in the lowest frequency, high-resolution radio image at 323 MHz from the uGMRT (see Figure 3). However, the resolution is
$\alpha_{\rm west}^{\rm hs}=-1.68\pm0.91$
. While these values are steeper than those for the lobes, they are consistent with the lobe values within the uncertainties. The hotspots are still detected in the lowest frequency, high-resolution radio image at 323 MHz from the uGMRT (see Figure 3). However, the resolution is  ${\sim} 4$
times worse compared to the GLASS images. Hence, it is difficult to quantify the contribution of the hotspots to the lobes at low frequency. The hotspots could conceivably contribute a larger fraction of the total flux at lower frequencies, but equally we might expect the hotspots to become synchrotron self-absorbed (SSA) at some low frequency.
${\sim} 4$
times worse compared to the GLASS images. Hence, it is difficult to quantify the contribution of the hotspots to the lobes at low frequency. The hotspots could conceivably contribute a larger fraction of the total flux at lower frequencies, but equally we might expect the hotspots to become synchrotron self-absorbed (SSA) at some low frequency.
The spectrum of the unresolved core appears fairly flat above  ${\sim}1\,$
GHz as expected from the classical assumption of the superposition of many separate synchrotron components each with different turnover frequencies due to SSA.
${\sim}1\,$
GHz as expected from the classical assumption of the superposition of many separate synchrotron components each with different turnover frequencies due to SSA.
There is some suggestion of a downturn at low frequencies from the uGMRT data which is further suggested by the faint emission seen in TGSS (see Section 2.1.1). However, we cannot tell with these data if this is due to SSA or free–free absorption processes. The AT20G  $8\,$
GHz flux density is a little higher than the other measurements, but as it was observed near-simultaneously with the
$8\,$
GHz flux density is a little higher than the other measurements, but as it was observed near-simultaneously with the  $5\,$
GHz data we put this down to measurement scatter or genuine variability of the core.
$5\,$
GHz data we put this down to measurement scatter or genuine variability of the core.
Using the lobe spectral indices for the k-correction, we find a total luminosity at 1.4 GHz (151 MHz) of  $L_{\rm 1.4GHz}=3.24\pm 0.25\times10^{25}\,$
W Hz-1 (
$L_{\rm 1.4GHz}=3.24\pm 0.25\times10^{25}\,$
W Hz-1 ( $L_{\rm 151MHz}= 2.70\pm 0.11 \times 10^{26}\,$
W Hz-1) consistent with PKS
$L_{\rm 151MHz}= 2.70\pm 0.11 \times 10^{26}\,$
W Hz-1) consistent with PKS  $2250-351$
being an FR II source as determined from the observations of hotspots (see Figure 1).
$2250-351$
being an FR II source as determined from the observations of hotspots (see Figure 1).
3.2.2. Jet kinetic power and source age
We use observations of the symmetric western lobe to infer jet kinetic power and source age using the Radio AGN in Semi-analytic Environments (RAiSE) dynamical model (Turner & Shabala Reference Turner and Shabala2015; Shabala et al. Reference Shabala, Deller, Kaviraj, Middelberg, Turner, Ting, Allison and Davis2017; Turner et al. Reference Turner, Rogers, Shabala and Krause2018a; Turner, Shabala, & Krause Reference Turner, Shabala and Krause2018b). We refer the interested reader to those papers for a comprehensive description of our modelling approach. Briefly, we produce luminosity-size tracks and optically thin synchrotron radio continuum spectra, for a wide range in jet kinetic power. While in some sources it is possible to infer the lobe magnetic field strength from the break in the synchrotron spectrum (Turner et al. Reference Turner, Shabala and Krause2018b), we find no break in the spectral energy distribution (SED) of PKS  $2250-351$
(Figure 5) and hence we adopt a value of 0.3 times the equipartition field. This is characteristic of FR II lobe field strengths measured through inverse-Compton observations (Croston et al. Reference Croston, Ineson, Hardcastle and Mingo2017). Modelled jets consist of a pair plasma (i.e. no protons), and we use the observed low-frequency spectral index to constrain the initial particle spectral index at the hotspots,
$2250-351$
(Figure 5) and hence we adopt a value of 0.3 times the equipartition field. This is characteristic of FR II lobe field strengths measured through inverse-Compton observations (Croston et al. Reference Croston, Ineson, Hardcastle and Mingo2017). Modelled jets consist of a pair plasma (i.e. no protons), and we use the observed low-frequency spectral index to constrain the initial particle spectral index at the hotspots,  $\alpha_{\rm inj}=-0.6$
. The injection spectral index is related to the power-law index in energy (s) as
$\alpha_{\rm inj}=-0.6$
. The injection spectral index is related to the power-law index in energy (s) as  $\alpha_{\rm inj}=\frac{-(s-1)}{2}$
. Thus, the
$\alpha_{\rm inj}=\frac{-(s-1)}{2}$
. Thus, the  $\alpha_{\rm inj}$
value we use corresponds to
$\alpha_{\rm inj}$
value we use corresponds to  $s=-2.2$
which is consistent with expectations from diffusive shock acceleration (e.g. Heavens & Drury Reference Heavens and Drury1988). The lobes have a steeper spectrum than this
$s=-2.2$
which is consistent with expectations from diffusive shock acceleration (e.g. Heavens & Drury Reference Heavens and Drury1988). The lobes have a steeper spectrum than this  $\alpha_{\rm inj}$
most likely due to energy losses (Turner et al. Reference Turner, Shabala and Krause2018b).
$\alpha_{\rm inj}$
most likely due to energy losses (Turner et al. Reference Turner, Shabala and Krause2018b).
Backflow of accelerated plasma from the hotspots inflates the radio cocoon, which expands supersonically through the intracluster gas. RAiSE models the dynamics of lobe expansion (radially and transverse), and accounts for synchrotron, adiabatic, and inverse-Compton losses from the emitting electrons. We run a grid of models for environments corresponding to group centre galaxies in haloes hot intra-cluster medium (ICM) with mass spanning  $3 \times 10^{13} - 3 \times 10^{14} \,{\rm M}_\odot$
; we consider these to be representative upper and lower limits of the (unknown) ICM conditions in the outskirts of Abell 3936. We then used maximum likelihood to find the best-fitting jet kinetic powers and dynamical ages. Regardless of environment, we consistently recover a total (i.e. for both jets) lobe-derived jet power of
$3 \times 10^{13} - 3 \times 10^{14} \,{\rm M}_\odot$
; we consider these to be representative upper and lower limits of the (unknown) ICM conditions in the outskirts of Abell 3936. We then used maximum likelihood to find the best-fitting jet kinetic powers and dynamical ages. Regardless of environment, we consistently recover a total (i.e. for both jets) lobe-derived jet power of  $Q_{\rm jet}^{\rm lobe}=1-1.5 \times 10^{38}\,$
W, and ages of 260–
$Q_{\rm jet}^{\rm lobe}=1-1.5 \times 10^{38}\,$
W, and ages of 260– $320\,$
Myr. These values do not change appreciably even if we relax our assumptions about the magnetic field. This age is quite large compared to other GRGs (Ishwara-Chandra & Saikia Reference Ishwara-Chandra and Saikia1999) and even ‘old’ regular radio-loud AGN (Murgia et al. Reference Murgia2011).
$320\,$
Myr. These values do not change appreciably even if we relax our assumptions about the magnetic field. This age is quite large compared to other GRGs (Ishwara-Chandra & Saikia Reference Ishwara-Chandra and Saikia1999) and even ‘old’ regular radio-loud AGN (Murgia et al. Reference Murgia2011).
Lobe dynamics trace time-averaged jet power, which may not be directly comparable with the (quasi-instantaneous) accretion rate determined through mid-IR observations. Godfrey and Shabala (Reference Godfrey and Shabala2013) presented a method for calculating the instantaneousFootnote i jet power from observations of hotspots; this method has been shown to be consistent with time-averaged dynamical jets powers (Shabala & Godfrey Reference Shabala and Godfrey2013) with some scatter, as expected. We obtain a hotspot-derived jet power of  $Q_{\rm jet}^{\rm hs}\sim 8 \times 10^{36}$
W for each jet, i.e.
$Q_{\rm jet}^{\rm hs}\sim 8 \times 10^{36}$
W for each jet, i.e.  $1.5 \times 10^{37}$
W in total, an order of magnitude lower than the time-averaged lobe-derived jet power. We suggest some plausible explanations for this interesting discrepancy in the discussion (Section 4.3) below.
$1.5 \times 10^{37}$
W in total, an order of magnitude lower than the time-averaged lobe-derived jet power. We suggest some plausible explanations for this interesting discrepancy in the discussion (Section 4.3) below.
3.3. The host galaxy
The radio emission from the bright compact core is unambiguously associated with the galaxy 2MASS J $22533602-3455305$
. Its morphology and colours indicate it would normally be a ‘red and dead’ massive elliptical. From Figure 4, it appears the major axis is close to perpendicular to the radio jet axis, a feature which is common in elliptical hosts of radio galaxies (Battye & Browne Reference Battye and Browne2009).
$22533602-3455305$
. Its morphology and colours indicate it would normally be a ‘red and dead’ massive elliptical. From Figure 4, it appears the major axis is close to perpendicular to the radio jet axis, a feature which is common in elliptical hosts of radio galaxies (Battye & Browne Reference Battye and Browne2009).
3.3.1. SED modelling
We fit the UV to far-IR SED using the ProSpectFootnote j code. The ProSpect code fits stellar libraries for different populations and dust templates to observed data. The IR emission from the dust is balanced by the absorption fitted to the optical/UV photometry assuming a uniform screen. As the three longer wavelength WISE bands are dominated by the AGN (as indicated by the WISE colours, see Section 2.2.1), we do not use them in the fitting of the stellar components. To account for the non-detections in the Herschel bands, we use a range of flux values from 0 to  $2.5\,\sigma$
, i.e. input flux densities of
$2.5\,\sigma$
, i.e. input flux densities of  $1.25\pm 1.25\,\sigma$
(where
$1.25\pm 1.25\,\sigma$
(where  $\sigma$
is the image RMS). The SED is best fit with an old stellar population which had a peak star formation rate (SFR) around
$\sigma$
is the image RMS). The SED is best fit with an old stellar population which had a peak star formation rate (SFR) around  $5\,$
Gyr ago.
$5\,$
Gyr ago.
We find the galaxy has a negligible current SFR of  $\ll 0.5\,{\rm M}_\odot\,$
yr–1 and a stellar mass of
$\ll 0.5\,{\rm M}_\odot\,$
yr–1 and a stellar mass of  $1.93\pm 0.07\times 10^{11}\,{\rm M}_\odot$
. This fit is shown in Figure 6 where the Herschel bands are shown as
$1.93\pm 0.07\times 10^{11}\,{\rm M}_\odot$
. This fit is shown in Figure 6 where the Herschel bands are shown as  $2.5\sigma$
upper limits. We overlay an AGN template from Symeonidis et al. (Reference Symeonidis, Giblin, Page, Pearson, Bendo, Seymour and Oliver2016) to demonstrate the AGN dominance in the WISE bands. In comparison to the general population of galaxies, these values put this galaxy far below the SFR/stellar mass ‘main sequence’ (Brinchmann et al. Reference Brinchmann, Charlot, White, Tremonti, Kauffmann, Heckman and Brinkmann2004; Noeske et al. Reference Noeske2007; Seymour et al. Reference Seymour2008) with a specific SFR of
$2.5\sigma$
upper limits. We overlay an AGN template from Symeonidis et al. (Reference Symeonidis, Giblin, Page, Pearson, Bendo, Seymour and Oliver2016) to demonstrate the AGN dominance in the WISE bands. In comparison to the general population of galaxies, these values put this galaxy far below the SFR/stellar mass ‘main sequence’ (Brinchmann et al. Reference Brinchmann, Charlot, White, Tremonti, Kauffmann, Heckman and Brinkmann2004; Noeske et al. Reference Noeske2007; Seymour et al. Reference Seymour2008) with a specific SFR of  $<< 1\times 10^{-2}\,$
Gyr–1 (i.e. ‘red and dead’).
$<< 1\times 10^{-2}\,$
Gyr–1 (i.e. ‘red and dead’).

Figure 6. We plot the UV to far-IR SED of 2MASS J $\text{22533602-3455305}$
, the host galaxy of PKS
$\text{22533602-3455305}$
, the host galaxy of PKS  $\text{2250-351}$
, with the data from Table 1. We show the best fit stellar SED model (dashed line) to these data (excluding the three longer wavelength WISE bands which are dominated by the AGN). We overlay an AGN model (dash-dot line) from Symeonidis et al. (Reference Symeonidis, Giblin, Page, Pearson, Bendo, Seymour and Oliver2016) to demonstrate how it dominates the WISE bands.
$\text{2250-351}$
, with the data from Table 1. We show the best fit stellar SED model (dashed line) to these data (excluding the three longer wavelength WISE bands which are dominated by the AGN). We overlay an AGN model (dash-dot line) from Symeonidis et al. (Reference Symeonidis, Giblin, Page, Pearson, Bendo, Seymour and Oliver2016) to demonstrate how it dominates the WISE bands.
The non-detections in the far-IR from the Herschel Space Observatory (see Table 2) imply an upper limit to the  $60\,\mu$
m luminosity of
$60\,\mu$
m luminosity of  $L_{60\,\mu {\rm m}}\lessapprox 1\times 10^{10}\,{\rm L}_\odot$
which corresponds to a SFR
$L_{60\,\mu {\rm m}}\lessapprox 1\times 10^{10}\,{\rm L}_\odot$
which corresponds to a SFR  $\lessapprox 2\,{\rm M}_\odot$
yr–1 (using the relationship from Calzetti et al. Reference Calzetti2010) and are therefore consistent with the low reported SFR. The host galaxy is also undetected in the relatively shallow ROSAT all-sky X-ray survey (Voges et al. Reference Voges1999) and has yet to be targetted by other X-ray facilities.
$\lessapprox 2\,{\rm M}_\odot$
yr–1 (using the relationship from Calzetti et al. Reference Calzetti2010) and are therefore consistent with the low reported SFR. The host galaxy is also undetected in the relatively shallow ROSAT all-sky X-ray survey (Voges et al. Reference Voges1999) and has yet to be targetted by other X-ray facilities.
3.3.2. Black hole accretion rate
The WISE colours and luminosity, along with the optical spectrum, are all consistent with ongoing obscured accretion onto a SMBH and with the lack of star formation indicated by the UV to near-IR SED. Hence, the WISE photometry can be used to estimate a mid-IR luminosity and infer an accretion rate. Interpolating between the W2 and W3 flux densities (assuming a power-law), we can measure the  $5\,\mu$
m rest-frame luminosity as
$5\,\mu$
m rest-frame luminosity as  $\nu L_{\rm 5\mu m}=1.560\pm 0.16 \times 10^{10}\,{\rm L}_\odot$
in solar luminosities. This is around an order of magnitude below the knee of the low-redshift luminosity function of mid-IR selected AGN (Lacy et al. Reference Lacy, Ridgway, Sajina, Petric, Gates, Urrutia and Storrie-Lombardi2015). Following the conversion factor of 10 from Lacy et al. (Reference Lacy, Ridgway, Sajina, Petric, Gates, Urrutia and Storrie-Lombardi2015), we find
$\nu L_{\rm 5\mu m}=1.560\pm 0.16 \times 10^{10}\,{\rm L}_\odot$
in solar luminosities. This is around an order of magnitude below the knee of the low-redshift luminosity function of mid-IR selected AGN (Lacy et al. Reference Lacy, Ridgway, Sajina, Petric, Gates, Urrutia and Storrie-Lombardi2015). Following the conversion factor of 10 from Lacy et al. (Reference Lacy, Ridgway, Sajina, Petric, Gates, Urrutia and Storrie-Lombardi2015), we find  $L^{\rm AGN}_{\rm BOL}=1.56\pm 0.16\times 10^{11}\,$
L
$L^{\rm AGN}_{\rm BOL}=1.56\pm 0.16\times 10^{11}\,$
L $_\odot$
.
$_\odot$
.
We also estimate the bolometric AGN luminosity from the [O iii] $\lambda$
5007 line. We measured an [O iii]
$\lambda$
5007 line. We measured an [O iii] $\lambda$
5007 flux of
$\lambda$
5007 flux of  $1.3\pm 0.3\times 10^{-15}\,$
erg s–1 cm–2 which corresponds to a luminosity of
$1.3\pm 0.3\times 10^{-15}\,$
erg s–1 cm–2 which corresponds to a luminosity of  $L_{\rm O}\,$
iii
$L_{\rm O}\,$
iii $\lambda 5007=3.4\pm 0.9 \times 10^7\,\textit{L}_\odot$
. Following Heckman et al. (Reference Heckman, Kauffmann, Brinchmann, Charlot, Tremonti and White2004), we convert to a bolometric AGN luminosity by multiplying by a factor of
$\lambda 5007=3.4\pm 0.9 \times 10^7\,\textit{L}_\odot$
. Following Heckman et al. (Reference Heckman, Kauffmann, Brinchmann, Charlot, Tremonti and White2004), we convert to a bolometric AGN luminosity by multiplying by a factor of  ${\sim} 3\,500$
(
${\sim} 3\,500$
( $\pm 0.38\,$
dex), thus obtaining
$\pm 0.38\,$
dex), thus obtaining  $L^{\rm AGN}_{\rm BOL}=1.2 \pm 0.3 \times 10^{11}\,\textit{L}_\odot$
. This value is consistent with the mid-IR derived AGN luminosity and we take the mean of these values (
$L^{\rm AGN}_{\rm BOL}=1.2 \pm 0.3 \times 10^{11}\,\textit{L}_\odot$
. This value is consistent with the mid-IR derived AGN luminosity and we take the mean of these values ( $L^{\rm AGN}_{\rm BOL}\sim 1.38\pm0.18\times 10^{11}\,\textit{L}_\odot$
) in our deliberations below (where the uncertainty is taken from the range of the two values).
$L^{\rm AGN}_{\rm BOL}\sim 1.38\pm0.18\times 10^{11}\,\textit{L}_\odot$
) in our deliberations below (where the uncertainty is taken from the range of the two values).
The efficiency of black hole accretion in AGN is not strongly constrained, but is estimated to be between 6% and 40% (see discussion in Section 6 of Drouart et al. Reference Drouart2014). Here we conservatively take a value of 10%, but note it can vary. Using this value, we obtain an accretion rate of  ${\sim} 0.1\,\text{M}_\odot$
yr–1. We can compare this value to the Eddington accretion rate which depends on black hole mass.Footnote k We estimate the mass of the black hole from the mass of the host galaxy assuming it lies on the local M–
${\sim} 0.1\,\text{M}_\odot$
yr–1. We can compare this value to the Eddington accretion rate which depends on black hole mass.Footnote k We estimate the mass of the black hole from the mass of the host galaxy assuming it lies on the local M– $\sigma$
relation (e.g. Ferrarese & Merrit Reference Ferrarese and Merrit2000; Kormendy & Ho Reference Kormendy and Ho2013). Specifically, we use the stellar mass reported above as the bulge mass, as our host appears to be a pure elliptical, and the conversion to black hole mass quoted in Häring and Rix (Reference Häring and Rix2004). We therefore estimate a black hole mass of
$\sigma$
relation (e.g. Ferrarese & Merrit Reference Ferrarese and Merrit2000; Kormendy & Ho Reference Kormendy and Ho2013). Specifically, we use the stellar mass reported above as the bulge mass, as our host appears to be a pure elliptical, and the conversion to black hole mass quoted in Häring and Rix (Reference Häring and Rix2004). We therefore estimate a black hole mass of  $M_{\rm BH}= 3.3\pm 0.8\times10^8\,{\rm M}_\odot$
(where the uncertainty comes from that in the conversion equation of Häring & Rix Reference Häring and Rix2004) which we can use to determine an Eddington luminosity of
$M_{\rm BH}= 3.3\pm 0.8\times10^8\,{\rm M}_\odot$
(where the uncertainty comes from that in the conversion equation of Häring & Rix Reference Häring and Rix2004) which we can use to determine an Eddington luminosity of  ${\sim} 1\times 10^{13}\,{\rm L}_\odot$
. Hence, our estimated Eddington accretion rate is
${\sim} 1\times 10^{13}\,{\rm L}_\odot$
. Hence, our estimated Eddington accretion rate is  $\lambda_{\rm EDD}\sim \frac{1.4\times 10^{11}}{1\times 10^{13}} \sim 0.014\pm0.004$
where the uncertainty is propagated from those of the black hole mass and bolometric AGN luminosity.
$\lambda_{\rm EDD}\sim \frac{1.4\times 10^{11}}{1\times 10^{13}} \sim 0.014\pm0.004$
where the uncertainty is propagated from those of the black hole mass and bolometric AGN luminosity.
3.4. Environment
PKS  $2250-351$
has been associated with the ‘Irregular’ cluster Abell 3936 (by Brown & Burns Reference Brown and Burns1991) with an Abell count of 95 and richness of ‘2’. We investigate this association using a galaxy group catalogue (included as part of the forthcoming G23 field data release) based on a friends-of-friends algorithm following the method of Robotham et al. (Reference Robotham2011). This group catalogue was produced with the
$2250-351$
has been associated with the ‘Irregular’ cluster Abell 3936 (by Brown & Burns Reference Brown and Burns1991) with an Abell count of 95 and richness of ‘2’. We investigate this association using a galaxy group catalogue (included as part of the forthcoming G23 field data release) based on a friends-of-friends algorithm following the method of Robotham et al. (Reference Robotham2011). This group catalogue was produced with the  ${\sim} 45$
k high-quality spectroscopic redshifts in G23 and includes information such as the number of members, the virial mass, and three separate estimates of the group centres. These centres are based on a centre of light (CoL) method, an iterative centre of light method (IterCoL), and the brightest cluster galaxy (BCG).
${\sim} 45$
k high-quality spectroscopic redshifts in G23 and includes information such as the number of members, the virial mass, and three separate estimates of the group centres. These centres are based on a centre of light (CoL) method, an iterative centre of light method (IterCoL), and the brightest cluster galaxy (BCG).
We confirm 2MASS J $22533602-3455305$
as a member of the largest group in G23 at the reported position of Abell 3936 (see Figure 7). This group has 92 spectroscopic members (including 2MASS J
$22533602-3455305$
as a member of the largest group in G23 at the reported position of Abell 3936 (see Figure 7). This group has 92 spectroscopic members (including 2MASS J $22533602-3455305$
) and an estimated virial mass of
$22533602-3455305$
) and an estimated virial mass of  $9.7\pm1.0\times10^{14}\,{\rm M}_\odot$
. This mass estimate is based on the observed velocity dispersion (
$9.7\pm1.0\times10^{14}\,{\rm M}_\odot$
. This mass estimate is based on the observed velocity dispersion ( $705\pm 50\,$
km s–1) and the estimated cluster radius. Note the uncertainty in the mass is from the velocity dispersion and does not include that on the cluster radius. However, the number of members and virial mass estimate strongly suggest that this is a massive cluster at
$705\pm 50\,$
km s–1) and the estimated cluster radius. Note the uncertainty in the mass is from the velocity dispersion and does not include that on the cluster radius. However, the number of members and virial mass estimate strongly suggest that this is a massive cluster at  $z=0.213$
(a higher redshift than estimated by Brown & Burns Reference Brown and Burns1991).
$z=0.213$
(a higher redshift than estimated by Brown & Burns Reference Brown and Burns1991).

Figure 7. Sky distribution of spectroscopically confirmed GAMA sources lying at  $\text{0.207}\le \textit{z}\le \text{0.2180}$
(i.e.
$\text{0.207}\le \textit{z}\le \text{0.2180}$
(i.e.  $\Delta(\textit{cz})\le \text{1}\,\text{500}\,$
km s–1). PKS
$\Delta(\textit{cz})\le \text{1}\,\text{500}\,$
km s–1). PKS  $\text{2250-351}$
is indicated by a larger black dot surrounded by a 1 Mpc radius circle. The large black square is the Abell cluster position and the ‘
$\text{2250-351}$
is indicated by a larger black dot surrounded by a 1 Mpc radius circle. The large black square is the Abell cluster position and the ‘ $\text{+}$
’, ‘X’, and diamond indicate three different estimates of the cluster centre from the GAMA group catalogue. The colour code of the galaxies indicate their stellar masses. The radio galaxy lies to the west of our most confident estimate of the cluster centre, the Iterative Centre of Light (IterCoL).
$\text{+}$
’, ‘X’, and diamond indicate three different estimates of the cluster centre from the GAMA group catalogue. The colour code of the galaxies indicate their stellar masses. The radio galaxy lies to the west of our most confident estimate of the cluster centre, the Iterative Centre of Light (IterCoL).
In Figure 7, we plot the spatial distribution of the spectroscopically confirmed galaxies in the range  $0.207<z<0.218$
(i.e. within
$0.207<z<0.218$
(i.e. within  $\Delta(cz)=1,500\,$
km s–1 of the cz of 2MASS J
$\Delta(cz)=1,500\,$
km s–1 of the cz of 2MASS J $22533602-3455305$
). For reference, we indicate a circle of radius 1 Mpc around PKS
$22533602-3455305$
). For reference, we indicate a circle of radius 1 Mpc around PKS  $2250-351$
. The colour bar indicates the estimated stellar masses of the galaxies (determined as described in Section 3.3.1). The three group centre estimates from the group catalogue are indicated as shown in the legend. The results of these three methods differ significantly.
$2250-351$
. The colour bar indicates the estimated stellar masses of the galaxies (determined as described in Section 3.3.1). The three group centre estimates from the group catalogue are indicated as shown in the legend. The results of these three methods differ significantly.
The IterCoL estimate lying due east of PKS  $2250-351$
is probably the best if one were to make a judgement from the distribution of galaxies in Figure 7. The CoL method is further north, drawn in that direction by the distribution of the galaxies in a filament that runs through the whole G23 field. The BCG estimate is clearly a long way off for this structure. Hence, we conclude that PKS
$2250-351$
is probably the best if one were to make a judgement from the distribution of galaxies in Figure 7. The CoL method is further north, drawn in that direction by the distribution of the galaxies in a filament that runs through the whole G23 field. The BCG estimate is clearly a long way off for this structure. Hence, we conclude that PKS  $2250-351$
is a member of Abell 3936, but
$2250-351$
is a member of Abell 3936, but  $\sim$
1 Mpc west of its centre.
$\sim$
1 Mpc west of its centre.
4. Discussion
4.1. The host galaxy
For the first time, we have identified the radio source PKS  $2250-351$
with the host galaxy 2MASS J
$2250-351$
with the host galaxy 2MASS J $22533602-3455305$
, a massive elliptical at
$22533602-3455305$
, a massive elliptical at  $z=0.2115$
. It has a negligible SFR but prominent mid-IR emission due to accretion onto the SMBH. The AGN emission is highly obscured in the UV and optical, consistent with the central engine being obscured by a torus structure viewed from approximately side-on and with the standard unification of AGN by orientation (Urry & Padovani Reference Urry and Padovani1995).
$z=0.2115$
. It has a negligible SFR but prominent mid-IR emission due to accretion onto the SMBH. The AGN emission is highly obscured in the UV and optical, consistent with the central engine being obscured by a torus structure viewed from approximately side-on and with the standard unification of AGN by orientation (Urry & Padovani Reference Urry and Padovani1995).
4.2. Jet power and ages
Our estimate of the age of radio source is relatively well defined. PKS  $2250-351$
is an FR II with well-defined bow shocks, so we know it must still be expanding supersonically (and was expanding faster in the past). For a cluster sound speed of
$2250-351$
is an FR II with well-defined bow shocks, so we know it must still be expanding supersonically (and was expanding faster in the past). For a cluster sound speed of  $1\,000\,$
km s–1 (
$1\,000\,$
km s–1 ( ${\sim} 1\,$
kpc/Myr, Sarazin Reference Sarazin1988), this places a pretty strong upper limit on the age of
${\sim} 1\,$
kpc/Myr, Sarazin Reference Sarazin1988), this places a pretty strong upper limit on the age of  ${\sim}(600/M_{\rm lobe})\,$
Myr where
${\sim}(600/M_{\rm lobe})\,$
Myr where  $M_{\rm lobe}$
is the average external Mach number of the lobe-driven bow shock (w.r.t. the ICM) over the lifetime of the source.
$M_{\rm lobe}$
is the average external Mach number of the lobe-driven bow shock (w.r.t. the ICM) over the lifetime of the source.
If the radio source is not in the plane of the sky (i.e. is larger), this would imply a larger age. The jet power would then also need to be adjusted appropriately. We can estimate the angle of the jet relative to the line of sight using (2) of Hardcastle, Lawrence, and Worrall (Reference Hardcastle, Lawrence and Worrall1998) which relates the jet-to-counterpart flux ratio to the angle between the jet and the line of sight. Using the ASKAP image and comparing the measured flux in parts of the jet away from knots with an equidistant position on the opposite (western) side, we obtain a brightness ratio of 3. Assuming a jet spectral index of  $\alpha_{\rm jet}=-0.5$
(from the canonical
$\alpha_{\rm jet}=-0.5$
(from the canonical  $s=-2$
electron energy power-law index from first-order Fermi acceleration processes) and a jet speed of
$s=-2$
electron energy power-law index from first-order Fermi acceleration processes) and a jet speed of  $\beta=0.7$
Footnote l, this flux density ratio is equivalent to
$\beta=0.7$
Footnote l, this flux density ratio is equivalent to  $74^\circ$
to the line of sight (i.e. close to side-on).
$74^\circ$
to the line of sight (i.e. close to side-on).
Our assumptions also depend on magnetic field strength. We took the typical particle to magnetic field energy density ratio from inverse-Compton observations of Hardcastle and Croston (Reference Hardcastle and Croston2010). Lower magnetic field strengths require a higher jet power to obtain the same radio luminosity—and hence younger age, to match the size constraint. Changing the magnetic field by a factor of 3 (i.e. the magnetic field energy density by a factor of 10, now consistent with lobes at equipartition) changes the best fit jet power by 0.2 dex (giving a broader range of  $1-2.5\times 10^{38}\,$
W), and increasing the age range by 30 Myr (giving a range of 230–
$1-2.5\times 10^{38}\,$
W), and increasing the age range by 30 Myr (giving a range of 230– $320\,$
Myr).
$320\,$
Myr).
4.3. Jet power vs accretion rate
Our results in Section 3.2.2 present a possibly conflicting scenario with different jet power estimates. The lobe-derived estimate of the jet power is an order of magnitude greater than the hotspot-derived value. This difference is right at the limit of the scatter seen between instantaneous jet power estimates from hotspots and the time-averaged dynamic jet powers (Shabala & Godfrey Reference Shabala and Godfrey2013). However, that scatter applies to younger and smaller radio galaxies where one might expect the instantaneous and time-averaged values to agree more closely. On the assumption that the change in jet power we observe is real, we consider other possibilities.
Firstly, the AGN accretion rate (and therefore jet power) is simply varying over the age of the radio galaxy. While simulations by Novak, Ostriker, and Ciotti (Reference Novak, Ostriker and Ciotti2011) have demonstrated rapid,  $\ll 1\,$
Myr, variability at low Eddington accretion rates, simulations by Gaspari, Ruszkowski, and Oh (Reference Gaspari, Ruszkowski and Oh2013) have shown that ‘chaotic cold accretion’ (CCA) can lead to variable accretion rates. In this picture, condensation of hot intracluster gas and subsequent inelastic collisions of cold gas clouds remove angular momentum, raining cold clouds onto the super-massive black hole at rates significantly in excess of the Bondi rate; this generates the powerful jets averaged over this stochasticity. Mechanical feedback from the jets then truncates the cooling process, and the jets are powered by the (less efficient) standard cold, TD. A testable prediction of this CCA hypothesis is the existence of old filamentary gas structures in the vicinity of the AGN host.
$\ll 1\,$
Myr, variability at low Eddington accretion rates, simulations by Gaspari, Ruszkowski, and Oh (Reference Gaspari, Ruszkowski and Oh2013) have shown that ‘chaotic cold accretion’ (CCA) can lead to variable accretion rates. In this picture, condensation of hot intracluster gas and subsequent inelastic collisions of cold gas clouds remove angular momentum, raining cold clouds onto the super-massive black hole at rates significantly in excess of the Bondi rate; this generates the powerful jets averaged over this stochasticity. Mechanical feedback from the jets then truncates the cooling process, and the jets are powered by the (less efficient) standard cold, TD. A testable prediction of this CCA hypothesis is the existence of old filamentary gas structures in the vicinity of the AGN host.
Another possibility for the drop in jet power over the life time of the radio source could be a change in accretion state. Our estimated Eddington accretion rate of  $\lambda_{\rm EDD}=0.014\pm 0.004$
is around the value at which accretion onto black holes switches from an inefficient, advection-dominated thick disc accretion flow (ADAF, Fabian & Rees Reference Fabian and Rees1995) to an efficient TD accretion flow. An ADAF is more efficient than a TD at producing jets (e.g. Meier Reference Meier2002), hence the higher average power derived from the lobes could have occurred in this ADAF mode. Then as the accretion rate gradually increases, the state of the accretion disc switches to the efficient TD mode and the power of the jet drops by an order of magnitude. This is consistent with the relationships between jet power and accretion rate presented in Meier (Reference Meier2002) which give a jet power around an order of magnitude lower for a TD compared to an ADAF (for the same mass, accretion rate, and spin).
$\lambda_{\rm EDD}=0.014\pm 0.004$
is around the value at which accretion onto black holes switches from an inefficient, advection-dominated thick disc accretion flow (ADAF, Fabian & Rees Reference Fabian and Rees1995) to an efficient TD accretion flow. An ADAF is more efficient than a TD at producing jets (e.g. Meier Reference Meier2002), hence the higher average power derived from the lobes could have occurred in this ADAF mode. Then as the accretion rate gradually increases, the state of the accretion disc switches to the efficient TD mode and the power of the jet drops by an order of magnitude. This is consistent with the relationships between jet power and accretion rate presented in Meier (Reference Meier2002) which give a jet power around an order of magnitude lower for a TD compared to an ADAF (for the same mass, accretion rate, and spin).
4.4. Environment
PKS  $2250-351$
resides in what is likely a massive cluster, Abell 3936 (with an estimated virial halo mass of
$2250-351$
resides in what is likely a massive cluster, Abell 3936 (with an estimated virial halo mass of  $9.7\pm1\times 10^{14}\,{\rm M}_\odot$
from its velocity dispersion). It is not uncommon to find GRG in such environments (Komberg & Pashchenko Reference Komberg and Pashchenko2009). However, to exist at all in such an environment this radio galaxy must have a powerful jet and be long-lived, as is supported by our modelling of the radio lobes in Section 3.2.
$9.7\pm1\times 10^{14}\,{\rm M}_\odot$
from its velocity dispersion). It is not uncommon to find GRG in such environments (Komberg & Pashchenko Reference Komberg and Pashchenko2009). However, to exist at all in such an environment this radio galaxy must have a powerful jet and be long-lived, as is supported by our modelling of the radio lobes in Section 3.2.
Abell 3936 is not detected in cluster surveys with ROSAT (e.g. Böhringer et al. Reference Böhringer, Chon, Collins, Guzzo, Nowak and Bobrovskyi2013) to a level of  $1.8\times 10^{-12}\,$
erg s–1 cm–2 from 0.1 to 2.4 keV. At the redshift of Abell 3936, this flux is equivalent to a luminosity of
$1.8\times 10^{-12}\,$
erg s–1 cm–2 from 0.1 to 2.4 keV. At the redshift of Abell 3936, this flux is equivalent to a luminosity of  $2.34\times 10^{44}\,$
erg s–1. Using equation 10 of Böhringer et al. (Reference Böhringer, Chon, Collins, Guzzo, Nowak and Bobrovskyi2013)Footnote m, the ROSAT non-detection implies a mass
$2.34\times 10^{44}\,$
erg s–1. Using equation 10 of Böhringer et al. (Reference Böhringer, Chon, Collins, Guzzo, Nowak and Bobrovskyi2013)Footnote m, the ROSAT non-detection implies a mass  $\le 5.5\times 10^{14}\,{\rm M}_\odot$
(with a 30% uncertainty). This discrepancy between the ‘virial’ mass and the X-ray mass upper limit could be explained if the cluster was not yet relaxed.
$\le 5.5\times 10^{14}\,{\rm M}_\odot$
(with a 30% uncertainty). This discrepancy between the ‘virial’ mass and the X-ray mass upper limit could be explained if the cluster was not yet relaxed.
This assertion is supported by the observation that the group catalogue does not provide a clear determination of a cluster centre with different estimates providing different positions (see Figure 7). From our analysis in Section 3.4, it seems that PKS  $2250-351$
is probably to the west of the densest grouping of galaxies eastern lobe pointing roughly towards it. While the ICM in this case maybe not be as dense as for a virialised cluster, it likely increases towards this galaxy concentration. Hence, the western radio lobe expands outwards more easily as the density of the ICM decreases, while the eastern lobe is more confined by an increasingly dense ICM. This idea is further supported by the difference in the lobe flux densities. A lobe expanding into a less dense environment will have a lower luminosity for the same jet power, which is consistent with the eastern lobe being
$2250-351$
is probably to the west of the densest grouping of galaxies eastern lobe pointing roughly towards it. While the ICM in this case maybe not be as dense as for a virialised cluster, it likely increases towards this galaxy concentration. Hence, the western radio lobe expands outwards more easily as the density of the ICM decreases, while the eastern lobe is more confined by an increasingly dense ICM. This idea is further supported by the difference in the lobe flux densities. A lobe expanding into a less dense environment will have a lower luminosity for the same jet power, which is consistent with the eastern lobe being  ${\sim} 30-100\%$
brighter than the western lobe.
${\sim} 30-100\%$
brighter than the western lobe.
The prominence of the jet in the eastern lobe is curious. It could partly be explained by the increasingly dense ICM into which it is drilling. The knots and kinks seen in the eastern jet could possibly be due to hydrodynamical instabilities. We note that it is unlikely to be due to relativistic beaming which would require a small angle,  $\ll 10^\circ$
, between the jet motion and the line of sight, inconsistent with our earlier estimate of
$\ll 10^\circ$
, between the jet motion and the line of sight, inconsistent with our earlier estimate of  $74^\circ$
. We can also rule out precession due to the asymmetry of the lobe.
$74^\circ$
. We can also rule out precession due to the asymmetry of the lobe.
The jet and lobe asymmetry could be due to a more complex morphology (e.g. a wide-angled tail radio source) viewed in projection, but this is also in contradiction with our determination that this radio galaxy is close to side-on. Future polarimetric observations with ASKAP may better constrain the orientation of PKS  $2250-351$
. If one radio lobe is expanding into a denser part of the ICM, one might expect it to have a higher rotation measure due to the denser foreground plasma.
$2250-351$
. If one radio lobe is expanding into a denser part of the ICM, one might expect it to have a higher rotation measure due to the denser foreground plasma.
Future X-ray observations (e.g. by eROSITA) will provide additional clues on these issues, potentially providing evidence of the interaction of the radio lobes with the ICM.
5. Conclusions
We have completed a detailed study of the giant radio galaxy PKS  $2250-351$
, its host galaxy and environment. This work demonstrates how we can improve our understanding of radio-loud AGN using broadband radio surveys (i.e. from MWA, uGMRT, ASKAP, and ATCA) with high-quality multi-wavelength surveys such as GAMA. In future papers, this work can be extended to much larger samples of radio sources in the G23 field. By comparing the instantaneous and past averaged jet powers with the current accretion rate, we can begin to determine when and how jets form in SMBHs.
$2250-351$
, its host galaxy and environment. This work demonstrates how we can improve our understanding of radio-loud AGN using broadband radio surveys (i.e. from MWA, uGMRT, ASKAP, and ATCA) with high-quality multi-wavelength surveys such as GAMA. In future papers, this work can be extended to much larger samples of radio sources in the G23 field. By comparing the instantaneous and past averaged jet powers with the current accretion rate, we can begin to determine when and how jets form in SMBHs.
The primary results from this work are:
• We have confirmed the association of the GRG PKS $2250-351$
at
$z=0.2115$
with the large, but irregular Abell 3936 cluster. This cluster is likely unrelaxed and has no clear centre, although PKS
$2250-351$
lies to the west of the highest concentration of galaxies.
$2250-351$
at
$z=0.2115$
with the large, but irregular Abell 3936 cluster. This cluster is likely unrelaxed and has no clear centre, although PKS
$2250-351$
lies to the west of the highest concentration of galaxies.• Its host galaxy, 2MASS J
$22533602-3455305$
, confirmed here for the first time, is a massive, ‘red and dead’ elliptical well below the SFR/stellar mass main sequence.• The O iii emission line and WISE photometry imply a current AGN bolometric luminosity of
$1.38\pm 0.18\times 10^{11}\,{\rm L}_\odot$
(
$\equiv 0.1\,{\rm M}_\odot\,$
yr-1 accretion rate). This AGN activity is highly obscured in the UV and optical. We estimate a black hole mass of
$3.3\pm 0.8\times 10^{8}\,{\rm M}_\odot$
(from the local M–
$\sigma$
relation) and hence an Eddington accretion rate of
$\lambda_{\rm EDD} = 0.014\pm 0.004$
, a value close to the transition between an accretion disc in an ADAF state and a TD state.• The lobe-derived jet power is an order of magnitude greater than the hotspot-derived jet power. Given the hotspots trace the much more recent accretion (a few Myr) and the age of the radio emission is quite old (260–
$320\,$
Myr), we suggest that the accretion disc may have changed state over this period. We propose that initially this radio galaxy was in an inefficient, ADAF mode which explains the high, average jet power estimated from the lobes. With an increase in accretion rate, the radio galaxy then switched to a TD mode, which explains the lower, current jet power estimated from the hotspots, but also the high current accretion rate seen in the host.• The asymmetry of the lobe widths may possibly be due to a density gradient in the ICM with the less luminous lobe expanding more widely into a less dense environment. However, without deeper X-ray observations, it is not possible to accurately determine the location and position of the centre of the cluster Abell 3936 relative to PKS
$2250{-}351$
.


Acknowledgements
We thank the referee for the many useful comments provided to improve this paper. We thank Martin Krause and Hans Böhringer for useful discussions. We thank Paul Hancock for a copy of the unpublished AT20G 20 GHz image of this source. We also thank Jamie Stevens, for assistance with the ATCA ‘green time’ observations. SS thanks the Australian Government for an Endeavour Fellowship, during which part of this work was completed. H.A. benefited from grant CIIC 218/2019 of Universidad de Guanajuato. Partial support for L.R. comes from U.S. National Science Foundation Grant AST 17-14205 to the University of Minnesota. The GAMA Legacy ATCA Southern Survey (GLASS) was conducted with the Australia Telescope Compact Array, which is part of the Australia Telescope National Facility which is funded by the Australian Government for operation as a National Facility managed by CSIRO. The Australian SKA Pathfinder is part of the Australia Telescope National Facility which is managed by CSIRO. Operation of ASKAP is funded by the Australian Government with support from the National Collaborative Research Infrastructure Strategy. ASKAP uses the resources of the Pawsey Supercomputing Centre. Establishment of ASKAP, the Murchison Radio-astronomy Observatory, and the Pawsey Supercomputing Centre are initiatives of the Australian Government, with support from the Government of Western Australia and the Science and Industry Endowment Fund. We acknowledge the Wajarri Yamatji people as the traditional owners of the Observatory site. This scientific work makes use of the Murchison Radio-astronomy Observatory, operated by CSIRO. We acknowledge the Wajarri Yamatji people as the traditional owners of the Observatory site. Support for the operation of the MWA is provided by the Australian Government (NCRIS), under a contract to Curtin University administered by Astronomy Australia Limited. We acknowledge the Pawsey Supercomputing Centre which is supported by the Western Australian and Australian Governments. We thank the staff of the GMRT that made these observations possible. GMRT is run by the National Centre for Radio Astrophysics of the Tata Institute of Fundamental Research. GAMA is a joint European-Australasian project based around a spectroscopic campaign using the Anglo-Australian Telescope. The GAMA input catalogue is based on data taken from the Sloan Digital Sky Survey and the UKIRT Infrared Deep Sky Survey. Complementary imaging of the GAMA regions is being obtained by a number of independent survey programmes including GALEX MIS, VST KiDS, VISTA VIKING, WISE, Herschel-ATLAS, GMRT, and ASKAP providing UV to radio coverage. GAMA is funded by the STFC (UK), the ARC (Australia), the AAO, and the participating institutions. The GAMA website is http://www.gama-survey.org/. Based on observations made with ESO Telescopes at the La Silla Paranal Observatory under programme ID 179.A-2004. Based on observations made with ESO Telescopes at the La Silla Paranal Observatory under programme ID 177.A-3016. The Herschel-ATLAS is a project with Herschel, which is an ESA space observatory with science instruments provided by European-led Principal Investigator consortia and with important participation from NASA. The H-ATLAS website is http://www.h-atlas.org/. This publication makes use of data products from the Wide-field Infrared Survey Explorer, which is a joint project of the University of California, Los Angeles, and the Jet Propulsion Laboratory/California Institute of Technology, and NEOWISE, which is a project of the Jet Propulsion Laboratory/California Institute of Technology. WISE and NEOWISE are funded by the National Aeronautics and Space Administration. The National Radio Astronomy Observatory is a facility of the National Science Foundation operated under cooperative agreement by Associated Universities, Inc. This research made use of ds9, a tool for data visualisation supported by the Chandra X-ray Science Center (CXC) and the High Energy Astrophysics Science Archive Center (HEASARC) with support from the JWST Mission office at the Space Telescope Science Institute for 3D visualisation. This paper also made use of the TOPCAT software (Taylor Reference Taylor2005). Furthermore, this research has made use of the NASA/IPAC Extragalactic Database (NED), which is operated by the Jet Propulsion Laboratory, California Institute of Technology, under contract with the National Aeronautics and Space Administration.


