


The largest ethnic Japanese population living outside Japan resides in São Paulo, Brazil, with 350 000 Japanese living in the city of São Paulo and an additional 900 000 in the state of São Paulo(Reference Wakisaka1). Japanese may be more prone to developing colorectal cancer (CRC) when exposed to a Western lifestyle, including a diet high in fat and red meat(Reference Minami, Nishino and Tsubono2), possibly due to genetic susceptibility(Reference Le Marchand3). Japanese immigrants to Brazil appear to rapidly adopt a diet that is relatively high in fat, obtaining 32 % of energy from fat compared with 25 % for Japanese living in Japan(Reference Freire, Cardoso and Shinzato4). Consumption of Brazilian churrasco, or barbecued meat, may further increase the risk of CRC due to its high concentration of chemical carcinogens such as heterocyclic amines and polycyclic aromatic hydrocarbons(Reference Sugimura5–Reference Jagerstad and Skog8). Conversely, Japanese Brazilians also consume large quantities of fruits, vegetables and legumes that may be protective against CRC(Reference Cardoso, Hamada and de Souza9).
As the fourth most common malignancy in Brazil, CRC incidence remains proportionally low compared with that in many developed countries, including Japan. However, current data show that the trend of CRC mortality in Japanese Brazilians resembles the higher rates of Japan more than those of the Brazilian population(Reference Iwasaki, Mameri and Hamada10). An assessment of the effect of diet and diet–gene interaction on adenoma, a precursor lesion for CRC, in this population may shed some light on the reasons for this risk pattern.
The FFQ is a popular and effective dietary assessment instrument for studies on diet–disease associations, but it must be developed and validated specifically for the target population(Reference Cade, Thompson and Burley11). While FFQ have been previously validated for use with Japanese-Brazilian populations(Reference Ishihara, Iwasaki and Kunieda12, Reference Cardoso, Kida and Tomita13), those instruments are not well suited for investigating the relationship between diet and adenoma or CRC risk. The validations were performed only with female populations, while CRC incidence is higher among males. To address these issues a quantitative FFQ (QFFQ) was developed(Reference Sharma, Iwasaki and Kunieda14) for the assessment of dietary intake in a case–control study of colorectal adenoma among the Japanese-Brazilian population. The purpose of the present study was to assess the validity of this QFFQ.
Experimental methods
Participants
A total of ninety-seven individuals were randomly selected among the controls of a case–control study of adenoma being conducted among patients undergoing colonoscopy in two hospitals in São Paulo, Brazil, between August 2008 and November 2009. Inclusion criteria were 40–75 years of age, at least three grandparents of pure Japanese ancestry and São Paulo residency for at least 6 months prior to recruitment. Exclusion criteria were a colonoscopy positive for inflammatory bowel disease, hyperplastic polyp, colorectal adenoma or colorectal cancer, or a history of such diseases.
Dietary assessment
Development of the QFFQ has been described elsewhere(Reference Sharma, Iwasaki and Kunieda14). Briefly, sixty Japanese Brazilians aged 40–75 years with no history of cancer were recruited from a São Paulo clinic during May and June 2005; respondents completed detailed 24 h diet recalls administered by a trained, multilingual dietitian in the clinic waiting room. All food and drink items reported by more than one respondent were included in the QFFQ, although items with very low energy and nutrient density (i.e. condiments and spices) were excluded. Items of comparable nutrient profile (i.e. different varieties of yoghurt) were grouped as a single item, resulting in a final QFFQ containing 161 foods and drinks to assess usual food and drink intake over the past 12 months. Assessment of consumption frequency used eight categories (ranging from ‘never or hardly ever’ to ‘two or more times per day’), while portion size was determined by asking respondents to evaluate their typical serving compared with culturally appropriate utensils and food models of known weight.
The validity of the QFFQ was assessed against 4 d food diaries. The diaries were recorded after inviting participants to the clinic and collecting informed consent. Respondents were instructed to keep a written log of all food and drink intake throughout four consecutive 24 h periods, including at least one weekend day. When the diaries were returned, the dietitian went through any anomalies with the participant. The dietitian also called participants each day to answer any queries they had regarding the diary. The QFFQ was administered by a dietitian in the clinic. QFFQ administration took place within a maximum of 2 weeks after return of the diaries, ensuring overlap between the covered periods. The 4 d food diaries were given before the QFFQ to help the participants become familiar with portion sizes and the recording process.
The study was approved by the University of Hawaii, Committee on Human Studies, as well as the Brazilian Ministries of Health, Science and Technology, and of Foreign Affairs, and the Brazilian National Ethics Commission.
Analysis
Collected information was double-checked for missing data and frequently forgotten items. To perform statistical analyses, the statistical software package STATA MP version 10·1 was used.
Daily intake of each food item was determined for each participant. The frequency categories were converted to number of times per day. Daily grams were computed for each food item as the daily frequency multiplied by the portion size converted to grams. For each seasonal food, the frequencies were adjusted by multiplying the proportion of months per year for which the food item was available.
Using the US Department of Agriculture's food composition table and local recipes, a food composition database was specifically prepared to accommodate the dietary characteristics among the study population to calculate daily nutrient intakes from the QFFQ. Each of the 161 food items had a record in the food composition database that provided the amount of nutrient per 100 g of food. For food items that represented food groups, such as ‘French bread, homemade bread and Italian bread’, the records are averages of the food composition of the relevant foods, weighted by the frequency of consumption based on our previously collected data(Reference Sharma, Iwasaki and Kunieda14). The data extracted from three data sets, including the food composition database, QFFQ (frequency and amount of intake) and food item portion weights, were analysed by the Food Frequency Questionnaire Analysis Program in STATA (FFQAPIS) – programmed by the first author – to compute total daily nutrient intake.
All food diary data were coded, entered and analysed using NutriBase Clinical Nutrition Manager version 5·18. NutriBase calculated the nutrient intake for each individual diary per person based on the US Department of Agriculture's food composition table. An estimate of individual j's daily intake of nutrient k (Yjk), as given by 24 h recalls in n weekdays and m weekend days, was computed using the following formula:
 $$ {{{Y}_{jk{}}}\: = \:{}\left. {\left[ {\left( {\frac{5}{n}\mathop{\sum}\limits_{d\: = \:0}^n {{{Y}_{jkd}}} } \right)\: + \:\left( {\frac{2}{m}\mathop{\sum}\limits_{d\: = \:0}^m {{{Y}_{jkd}}} } \right)} \right.} \right]\: \div \:7. \eqno\rm$$
Statistical methods
The ultimate objective of the study was to measure the validity of the QFFQ to be used in a case–control study examining dietary intake and risk of colorectal adenoma among Japanese Brazilians in São Paulo. Accordingly, all statistical analyses were carried out on total daily intakes of energy and nineteen nutrients of interest. Mean and standard deviation for nutrients were computed for both the QFFQ and 4 d food diaries. All nutrients were loge-transformed before inclusion in the analyses because they tended to be positively skewed. Pearson's product-moment correlation (r) was used to measure the strength of the relationship between nutrient intakes estimated by the QFFQ and the reference tool. Cross-classification was used to evaluate the relative agreement between the two tools. The quartiles were created using the instrument-specific distribution. The percentage in the same quartile was calculated as a measure of agreement. The weighted κ was computed to provide a chance-corrected measure of cross-classification(Reference Fleiss15). All P values were two sided and significant at <0·05.
Within-person variance (i.e. day-to-day variation in diet) measured in the diaries can attenuate correlations between the QFFQ and 4 d diary(Reference Willett16). To adjust for this, the crude Pearson correlations were de-attenuated using the following formula:  $$-->$<> {{\{ 1\: + \:[(\sigma _{\rm {W}}^{2} \:/\:\sigma _{\rm {B}}^{2} )\:/\:m]\} }^{0 \cdot 5}} $$$
, where m is the average number of days covered by the diary, and the within-person (
$$-->$<> {{\{ 1\: + \:[(\sigma _{\rm {W}}^{2} \:/\:\sigma _{\rm {B}}^{2} )\:/\:m]\} }^{0 \cdot 5}} $$$
, where m is the average number of days covered by the diary, and the within-person ( $$-->$<> \sigma _{\rm {W}}^{2} $$$
) and between-person (
$$-->$<> \sigma _{\rm {W}}^{2} $$$
) and between-person ( $$-->$<> \sigma _{\rm {B}}^{2} $$$
) variances were computed from the 4 d diary by variance component techniques(Reference Rosner and Willett17). Most nutrient intakes were positively correlated for energy intake, thus the regression model method(Reference Willett and Stampfer18) was used to calculate energy-adjusted nutrients to remove variation due to energy.
$$-->$<> \sigma _{\rm {B}}^{2} $$$
) variances were computed from the 4 d diary by variance component techniques(Reference Rosner and Willett17). Most nutrient intakes were positively correlated for energy intake, thus the regression model method(Reference Willett and Stampfer18) was used to calculate energy-adjusted nutrients to remove variation due to energy.
Bland–Altman plots were used to observe the agreement between the QFFQ and dietary recall at the individual level(Reference Bland and Altman19). Because of skewness in the dietary data, loge transformation was carried out on dietary data before analysis. The measurement error is shown by plotting the individual difference between the pair of measurements v. the average of the paired measurements. To be able to interpret findings on plots, antilogs of mean, upper and lower limits of agreement were calculated. These indices, respectively, show the ratio QFFQ:4 d diary for nutrient data on average plus or minus twice the standard deviation of the difference(Reference Bland and Altman19). A linear regression line of differences was fitted to examine the degree of concordance between the QFFQ and 4 d diary, where a complete concordance is met with a slope (β) of zero.
Results
Ninety-seven Japanese-Brazilian adults completed the 4 d diary and were interviewed for the QFFQ. Only one person had an energy intake of <4184 kJ (3987 kJ); the diary was discussed between the participant and the dietitian and the information was verified. After excluding one (1 %) participant with total daily energy report of more than 21 000 kJ, fifty-eight (60 %) women and thirty-eight (40 %) men, with mean age of 58 (sd 10) years and 61 (sd 10) years, respectively, were included in the analysis. The 4 d diaries were collected over 384 d covering both weekdays and weekends.
The mean intakes of energy, macronutrients and some micronutrients of interest are presented in Table 1 for comparison between the two instruments. Mean intakes of all of nutrients included in Table 1 were greater for the QFFQ than the average of the 4 d diary.
Table 1 Mean daily nutrient intakes estimated by the quantitative FFQ (QFFQ) and the 4 d diary, and Pearson correlation coefficients (r) between the crude and adjusted estimations from two questionnaires, among healthy Japanese-Brazilian adults aged 40–75 years (n 96), São Paulo, Brazil, August 2008–November 2009
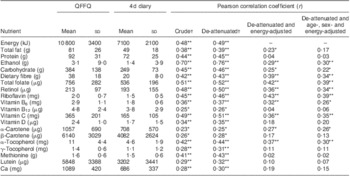
*P < 0·05, **P < 0·01.
†Correlation coefficients are based on loge-transformed values of nutrient intake.
Comparing QFFQ and 4 d diaries, the crude Pearson correlation coefficients ranged from 0·23 for α-carotene to 0·70 for ethanol with a total average of 0·40. After correction for within-person variance, the correlation coefficient for macronutrients ranged from 0·39 (P < 0·01) for total fat to 0·76 (P < 0·01) for ethanol. Among micronutrients under assessment, the weakest and strongest de-attenuated correlations between the two dietary tools were observed for α-carotene (r = 0·25, P < 0·05) and total folate (r = 0·52, P < 0·01), respectively. In the present study, adjustment for energy decreased correlation coefficients between the QFFQ and the 4 d diary for all nutrients of interest, except α-carotene.
Further adjustment for variation in intake based on age and sex among participants led to more attenuation in overall correlation (r = 0·24 for energy-adjusted intake values to r = 0·22 for age-, sex- and energy-adjusted intake values).
Cross-classification analysis by quartiles revealed complete agreement between the QFFQ and 4 d diary for an average of 41 % of observations for energy, dietary fibre and macronutrients and 36 % of observations for micronutrients (Table 2). Seventy-eight per cent of observations for energy, dietary fibre and macronutrients and 78 % of observations for micronutrients were placed in the same or adjacent quartiles with an average weighted κ of 0·30 and 0·26, respectively. Extreme misclassification ranged between 2 % (retinol) and 10 % (γ-tocopherol). The sum of proportions of same, adjacent and opposite quartiles in each row of Table 2 is not equal to 100 % because the proportions of moderate misclassifications are not included in the table. On average, a slightly higher proportion of observations related to macronutrient consumption was placed in the same or adjacent quartiles before adjustment (76 %) compared with after adjustment for energy (74 %). This attenuation in agreement was more obvious for micronutrients where the proportion decreased from 78 % before adjustment to 74 % after adjustment for energy. In addition, the average weighted κ for nutrient variables decreased from 0·27 to 0·23 after adjustment.
Table 2 Cross-classification of nutrient distribution quartiles from the quantitative FFQ (QFFQ) and the 4 d diary among healthy Japanese-Brazilian adults aged 40–75 years (n 96), São Paulo, Brazil, August 2008–November 2009

Weighted κ was calculated for each nutrient from the observed and expected proportions on a 4 × 4 table of frequency.
*P < 0·05, **P < 0·01.
Considering linear trend P values in the Bland–Altman plots on loge-transformed data there were no significant linear trends between the differences and means for energy, fat, protein, total folate and vitamin C (Fig. 1). Similarly, the slope of fitted regression lines indicates equal variability between the QFFQ and 4 d diary for measurement of those dietary data. However, the QFFQ and 4 d diary were not equally variable for measurement of carbohydrate, Ca and vitamin D intakes. Antilog of mean difference values showed that, on average, compared with the 4 d diary, the QFFQ estimated 45 % higher energy, 65 % higher fat, 23 % higher protein, 42 % higher total folate and 123 % higher vitamin C.

Fig. 1 Bland–Altman plots assessing agreement between the quantitative FFQ (QFFQ) and the 4 d diary for dietary intake of (a) energy, (b) carbohydrate (CHO), (c) total fat, (d) protein, (e) total folate, (f) vitamin C, (g) vitamin D and (h) calcium among healthy Japanese-Brazilian adults aged 40–75 years (n 96), São Paulo, Brazil, August 2008–November 2009. Plots were created on loge-transformed values of energy and nutrients (LOA, limit of agreement)
A subgroup analysis for gender showed smaller correlation coefficients between the two methods among men compared with women for all nutrients, except vitamin B12, methionine and Ca (Table 3). The average correlation coefficient adjusted for age and daily energy intake was 0·23 for men and 0·25 for women, but were not statistically different (P = 0·42).
Table 3 Pearson correlation coefficient (r) between nutrient intakes estimated by the quantitative FFQ (QFFQ) and the 4 d diary, according to sex, among healthy Japanese-Brazilian adults aged 40–75 years (n 96), São Paulo, Brazil, August 2008–November 2009

NC, no correlation.
*P < 0·05, **P < 0·01.
†Correlation coefficients are based on loge-transformed values of nutrient intake.
Discussion
The validity of an FFQ is the degree to which the instrument measures the diet of the subjects it was designed to study. Typically, nutrient intake estimation by an FFQ is compared with a standard reference method. The comparison can be made by looking at the relative ranking of subjects by the two methods and examining the absolute levels of both methods(Reference Willett and Lenart20). There are no gold standard dietary assessment tools for measuring dietary intake. However, when choosing a reference tool for a validation study, it is important that the sources of error for the reference tool and FFQ are as independent as possible. The major sources of error in the FFQ are poor recall, interpretation of questions and inference of portion sizes provided in the questionnaire. These errors are unlikely to apply to the food diary and this dietary assessment tool is feasible for implementation(Reference Nelson21). Utilizing biomarker measurements as the most accurate reference for FFQ validation was not considered for the present study because of the high cost involved and the limited number of nutrients that could be evaluated.
Comparison of means indicated a tendency for higher estimation of intake by the QFFQ than the 4 d diary. However, moderate (r = 0·30–0·50) to good (r > 0·50) correlation was observed between the two dietary assessment tools for 85 % of the nutrients under study. In addition, more than 70 % of the participants were classified into the same or adjacent quartiles for nutrient intakes indicating an overall moderate to good agreement between the QFFQ and reference tool.
In an FFQ validation study against four 24 h recalls among eighty-eight Brazilians(Reference Sichiei and Everhart22), the mean of correlation coefficients for macronutrients and energy, and five nutrients under study (fat, protein, carbohydrate, vitamin C and Ca) were 0·39 and 0·40, respectively, and were slightly smaller than the corresponding correlation coefficients in the present study (0·43 and 0·43, respectively). Compared with an FFQ validation study among 104 Brazilian workers(Reference Fornés, Stringhini and Elias23), the present study demonstrated a slightly higher mean de-attenuated correlation coefficient for energy and the five nutrients in common between the two studies (0·42 v. 0·44).
A positive correlation between total energy intake and consumption of most nutrients(Reference Jequier and Schutz24) causes confounding in epidemiological studies, particularly in diet–disease relationship assessments. Energy adjustment via regression analysis, instead of nutrient density, eliminates this confounding effect(Reference Willett and Stampfer18). In the current study, adjustment for energy led to decreased agreement between the two instruments for all nutrients, except α-carotene. This indicated variability was more related to systematic error of under- and overestimation than to energy intake(Reference Willett and Stampfer18).
In a literature review of twenty-one studies on FFQ development and validation among Japanese populations, Wakai(Reference Wakai25) reported that the median of correlation coefficients between dietary records and FFQ ranged from 0·31 to 0·56 for target nutrients. In addition, the median of de-attenuated energy-adjusted correlation coefficients reported in five studies ranged from 0·43 to 0·52(Reference Wakai25), which are substantially greater than the median of the corresponding index in our study (0·25). The lower accuracy of the QFFQ in the present study in comparison with the Japanese FFQ is plausibly due to the complicated dishes used among Japanese Brazilians, which include traditional Japanese and local Brazilian foods. Also, the number of food items in our study (161) was greater than in the twenty Japanese studies included in that literature review (ranging from nine to 150)(Reference Wakai25), which might increase the burden on participants and influence their ability to recall intake frequencies and portion sizes.
The correlation coefficient for ethanol before adjustment for energy was substantially larger than for other nutrients in the present study. An explanation for this finding is high between-person variation of alcohol intake among participants such that some individuals do not consume alcohol, while others consume heavily. The higher de-attenuated correlation coefficient for ethanol among women compared with men can be justified in this way. Dietary fibre, total folate, retinol, riboflavin, vitamin C and α-tocopherol are other nutrients that performed well in terms of their rank correlation coefficients. This finding is very similar to what Roddam et al.(Reference Roddam, Spencer and Banks26) reported for a validation study of a semi-quantitative food group questionnaire against a 7 d food diary.
The validity of the QFFQ was poor for protein, vitamins B12 and D, γ-tocopherol and methionine in all Pearson correlation, cross-classification and weighted κ assessments. A limited number of food sources for some nutrients (e.g. vitamin D) or low consumption of the food sources makes it difficult to capture information reliably which may partly explain the low validity of the QFFQ for these nutrients.
Unlike correlation analysis, the cross-classification procedure is able to capture differential under- and over-reporting(Reference Friis, Kruger Kjaer and Stripp27). In the present study, despite some differences in estimation of nutrients by the QFFQ and food diary, classification agreement between the two methods was good. More than 70 % of participants were classified by both methods into the same or adjacent quartiles for level of intake estimation of all nutrients. Protein, carbohydrate, γ-tocopherol and methionine were found with highest rates of gross misclassification.
The Bland–Altman analysis assesses the agreement between two dietary assessment methods across the range of intakes(Reference Bland and Altman19). This analysis is able to determine any bias between the two methods; that is, whether there is any systematic difference between the two methods and the extent to which the two methods agree. The ratio QFFQ:4 d diary computed based on antilogs of mean differences indicated overestimation of energy and nutrients by the QFFQ, which ranged from 21 % for vitamin D to 123 % for vitamin C (data not shown). Similarly, in another QFFQ validation study against 4 d diary for African-origin people in Barbados(Reference Pakseresht, Sharma and Cao28), the largest ratio was reported for vitamin C (62 %). This pattern could be due to a large diversity of food sources of vitamin C that was obtained from the QFFQ (e.g. beverages with added vitamin C, different types of fruits and vegetables) compared with what participants actually got from the limited number of foods over 4 d.
It is highly recommended to develop gender-specific analysis for validation studies which include both men and women(Reference Nelson21). Women tended to achieve higher correlations for validity of questionnaire responses than men (r = 0·28 v. r = 0·26 in full adjusted model). This may be due to women spending more time than men in the purchasing and cooking of meals, and they may, therefore, be more aware of food portion sizes and frequency of consumption. Sex differences in the validity of reported intake based on the QFFQ may obscure true sex differences in the relationships between diet and disease(Reference O'Donnell, Nelson and Wise29).
The mean of energy-adjusted correlation coefficients among women in the present study was 0·28, which is smaller than the corresponding value of 0·32 found in an FFQ validation study of fifty-five women of both Brazilian and Japanese ancestry(Reference Ishihara, Iwasaki and Kunieda12). However, our FFQ showed better validity for macronutrients than the other study (r = 0·22 v. r = 0·17).
Several studies have shown the under-reporting of consumption among individuals with excess weight, especially among women(Reference Black, Goldberg and Jebb30, Reference Heitmann and Lissner31). Lack of information on participants’ weight and height did not allow an extra adjustment of correlations to be performed for BMI. The aim of the study was to measure validity of the FFQ in dietary assessment among participants over the past 12 months. The reference tool measured the current dietary intake status. It was assumed that people who were classified as cases in the main case–control study were highly likely to have different dietary habits at the time of study – as a consequence of the disease or following a medical recommendation – compared with the past 12 months. However, this was not a matter of concern among the control group. Thus, excluding cases from the study decreased the possibility of underestimation of the correlation between the FFQ and the reference tool. The sample size of the study is slightly less than the suggested value (at least 100) for an optimal correlation coefficient analysis(Reference Cade, Thompson and Burley11); however, it is enough for the Bland–Altman plotting and interpretation and is acceptable considering the small age range, and the study covers an adequate number of replicates per individual (4 d).
It has been suggested that increasingly long and detailed questionnaires are less likely to obtain additional accurate data(Reference Willett16). On the other hand, Wakai(Reference Wakai25) indicated slightly higher validity for FFQ with ninety-seven or more food items than for those that included fewer than seventy items. A literature review by Cade et al.(Reference Cade, Thompson and Burley11) reported a median number of seventy-nine food items (ranging from five to 350) for FFQ. Therefore, the 161-item QFFQ used in the present study is an adequate length. Moreover, it has been designed to be culturally appropriate by containing local and traditional food items and utilizing appropriate portion sizes.
The QFFQ overestimated all nutrients under study when mean of intake from the QFFQ was compared with the 4 d diary. However, when the aim of a validation study is to rank individuals rather than estimate ‘true’ intake, finding a good correlation between the tool under assessment and the reference measure, developing regression and calculation of predicted intake – as would be used in the case–control study of colorectal adenoma – may in part overcome the problems associated with overestimation of intake(Reference O'Donnell, Nelson and Wise29).
In summary, the QFFQ was found reasonably valid for the assessment of daily consumption of a number of dietary nutrients. Consequently, this may permit future analyses to examine the relationship between diet and risk of colorectal adenoma by allowing individuals to be categorized by either their reported eating habits or their estimated nutrient intakes.
Acknowledgements
Source of funding: This research was supported in part by grants from the American Institute for Cancer Research (# 06A102) and the US National Cancer Institute (R03 CA119682; Principal Investigator: L.L.M.) and a Grant-in-Aid for Scientific Research on Priority Areas (17015049; Principal Investigator: S.T.) from the Ministry of Education, Culture, Sports, Science, and Technology of Japan, the Uehara Memorial Foundation and the Foundation for Promotion of Cancer Research in Japan. Conflicts of interest: The authors have no conflicts of interest. Authors’ contributions: M.I., L.L.M. and S.T. developed the conception and design of the study. S.S. developed the QFFQ and contributed to the study design, implementation and oversaw data analyses. N.T.M. was responsible for overseeing all data collection in the field sites as well as ensuring all protocols were adhered to. M.P., S.S. and A.S. assisted in the writing of the manuscript. M.P. also contributed to the data analyses and interpretations of results. All authors critically reviewed the manuscript. Acknowledgements: The authors would like to thank Ms Silvia Lika Ishii and Ms Ritsuko for their help with data collection. The authors wish to thank Mrs Claudia Kunieda, Cristiani Nakashima, Rosa A. Michelani, and all the volunteers who helped in the collection of recipes.


