


Adolescence is a critical period that is characterized by cognitive, emotional and social development and exposure to a significant turnover in lifestyle, including food intake and diet habits. Irregular meals, snacking and meal skipping, which characterize teenagers, often do not allow an accurate dietary assessment( Reference Lietz, Barton and Longbottom 1 ) and therefore the need to develop valid and reproducible instruments for this purpose is increasing. Different dietary assessment methods among adolescents have been extensively described and validated, such as food records (FR), FFQ, diet histories (DH) and 24 h recalls (24-HR). The FR is not used in large population studies for several reasons( Reference Rockett, Berkeya and Colditz 2 ): it can be quite expensive; it requires the participant to be literate and motivated; it involves trained staff; and it needs a computerized program specific to recording diet records. Thus, the FR is preferably used at the individual level and is generally considered a good reference instrument against which to validate other dietary methods to be used at the large population level, together with biomarker measurements( Reference Lampe and Rock 3 ). The most used dietary assessment methods for large-scale surveys are therefore FFQ, 24-HR and DH, which present advantages such as cost-effectiveness, although they are affected by weaknesses( Reference Thompson and Subar 4 , Reference Ngo, Engelen and Molag 5 ) that can produce misreporting. A recent review showed that the major factors influencing under- and over-reporting in recall methods are due to the reliance on respondents’ memory and ability to estimate portion sizes( Reference Poslusna, Ruprich and de Vries 6 ). Subjects’ compliance with recording their food intake is often a problem, and this is especially problematic when they are required to keep records for longer periods of time( Reference Gibson 7 ). Another issue is the time and monetary cost for the collection and processing of dietary intake information, which can be overtaken by the use of new technologies, such as questionnaires using web-based methods. Some studies state that the web-based computerized assessment represents an element of innovation for data collection, with the advantages of cost-efficiency, reductions in data entry and data coding time, automatic flagging of missing data, accessibility by the entire population, possibility of long-term data collection and simplification of the self-monitoring process, which increases compliance and the validity of self-reported food intake( Reference Kroeze, Werkman and Brug 8 ). According to a recent review conducted by the Innovation of Dietary Assessment Methods for Epidemiological Studies and Public Health (IDAMES)( 9 ), this method compares reasonably well with more traditional approaches; moreover it is suitable for adolescents, since the age at which a child becomes an accurate self-reporter of his/her own dietary intake has been estimated to be approximately 12 years, although this varies by dietary assessment method( Reference Livingstone, Robson and Wallace 10 ).
Since dietary methods validated and used for adolescents are different worldwide, a comparison of data is often difficult or unfeasible; standardized surveillance systems are needed, in order to collect valid and accurate estimates of food and nutrient intakes. A standardized and sustainable collection of data on adolescents’ food consumption and lifestyles is useful to understand the diet-related public health problems and implement appropriate actions for the prevention of the related diseases. The ASSO (Adolescents and Surveillance System for the Obesity prevention) Project, funded by the Italian Ministry of Health and supported by different national and international partners, falls within this context, with the purpose of developing a system for a standardized collection of dietary intake and lifestyle data in adolescents. It has the potential to provide the National Health System with a structure that allows a continuous and permanent nutritional surveillance on the school population, and aspires to propose an example of good practice by delivering a tool for an effective nutritional surveillance. In order to establish the best specifically designed tool for the assessment of food and nutrient intakes by comparison with the gold standard measure in large populations of adolescents aged 13–17 years, a systematic literature review on the dietary assessment instruments found to be valid and reproducible was performed within Project ASSO and is described in the present paper.
Methods
Literature search and systematic review
The literature search was conducted on the electronic databases MEDLINE, EMBASE, ISI Web of Science and Cochrane. In the MEDLINE and Cochrane databases, besides free text terms, Medical Subject Headings (MeSH) and MeSH Major Topics were included in the syntax. A sensitivity check was executed by deleting terms in the syntax systematically to see if important articles were missed with the current syntax. The search was focused on studies published in the 10 years between 2001 and 2011. No restriction criteria were applied for the country, while limits were imposed on the language by restricting the publications to the English, Italian, Spanish and French idioms. Studies that met all of the following inclusion criteria were included in the review: describing dietary assessment methods developed for epidemiological purposes; targeting adolescent populations in the age range 13–17 years; and reporting the validity and/or reproducibility of the method v. one reference method.
Key search terms, used alone and in combination, included the following: terms referred to the type of dietary method (questionnaire, 24-HR, 24 h recall, 24-h recall, FFQ, history, record, diary); terms including diet, nutrition, food, intake; and terms related to the validation and reliability of the methods (validity, validation, reliability, reproducibility, calibration). Additional searches were carried out on websites of national and international organizations (e.g. universities and relevant professional societies or organizations) and the grey literature was also considered.
The retrieved records were sent to Endnote® (version X4·02), where the duplicates were removed.
After this, an initial screening of titles and abstracts was performed in order to check exclusion criteria. When a title or abstract could not be rejected with certainty, the paper was included in the eligibility papers and the full text was further evaluated.
Articles were excluded in the following cases: population age not in the range 13–17 years; non-healthy subjects; hospitalized or not free-living subjects; pregnant adolescent women; refugees; vulnerable populations such as low income or rural; specific ethnicity; overweight/obese subjects; athletes; vegetarians; dietary instrument specific only to certain nutrients (folate, vitamins, calcium, fat, protein, etc.), specific only to certain foods (alcohol, beverages, fruit and vegetables, sugary snacks, seafood, etc.) or specific only to energy and fast-foods consumption; feeding study or intervention study; subjects with eating disorders; study relative to eating or health behaviour; psychometric tests e.g. for craving; subjects with food allergies; study relative to intake of particular substances (acrylamide, etc.); questionnaire only for physical activity assessment; questionnaire only for nutrition knowledge assessment; study aimed at perceptions; study where only parental reporting on the child's diet was considered; study with only food insecurity measurement; and study with only portion-size estimation.
The full texts of the articles assessed for eligibility were examined through a second screening, in order to evaluate the relevance of the papers. Some articles and the relative full version of the questionnaires were obtained through direct contact with the author. Articles were excluded if a relative comparison of validity and/or reproducibility was not made for the dietary instrument.
The reference lists of articles retrieved for inclusion in the review were hand-searched to identify other relevant articles.
If for the same study there was a series of similar articles, they were all screened and considered for analysis, in order to avoid possible data loss. The literature search and the systematic review were conducted by two independent investigators, after a standardization of the procedure. In the case of any incongruity, the two investigators came to an agreement after further analysis and discussion.
Once papers were identified as relevant, data were extracted into an Excel® database.
Study quality assessment
A study quality assessment of the retrieved articles was carried out by two of the investigators independently, according to two different scoring systems. The reduced summary score described by Dennis et al.( Reference Dennis, Snetselaar and Nothwehr 11 ) judges the quality of nutrition information from FFQ in epidemiological studies by applying a priori defined criteria and is based on the following aspects: the number of food items, the administration mode (e.g. interviewer v. self-administered mode) and whether it is a quantitative instrument. The reduced summary score was ranked as ‘high’ or ‘low’ quality, with a tally of 5 or more ranked as ‘high’, for a total possible score of 8 points.
Since the present analysis is focused on the assessment of the quality of validation and calibration studies of FFQ, with the aim of including, excluding or weighting the studies that utilize an FFQ in the current review, we used an additional scoring system proposed more recently by Serra-Majem et al.( Reference Serra-Majem, Frost Andersen and Henríque Sánchez 12 ). This system considers the following variables: type of sample and sample size of the study; statistics to assess validity (e.g. comparisons between methods’ means, medians or difference; crude, energy-adjusted, de-attenuated or intra-class correlation) and statistics to assess agreement or misclassification; administration mode; seasonality considered in the validation design; and supplements included and validated. According to Serra-Majem et al.( Reference Serra-Majem, Frost Andersen and Henríque Sánchez 12 ), scores could range from 0 (poorest quality) to a maximum of 7 (highest quality). This allows for the classification of validation studies according to their methodological quality. The summary score was ranked as ‘very good/excellent’ with a tally of 5 or more; ‘good’ with a score between 3·5 and 5; ‘acceptable/reasonable’ with a score between 2·5 and 3·5; or poor with a score of less than 2·5.
For the studies that used semi-quantitative methods other than FFQ, only the scoring system proposed by Serra-Majem et al.( Reference Serra-Majem, Frost Andersen and Henríque Sánchez 12 ) was applied.
Results
As shown in Fig. 1, a total of 480 articles were retrieved after duplicates were removed and sixty-eight were included in the review when specific exclusion criteria were applied. A further screening procedure based on the full-text evaluations identified thirty-two eligible papers that were included in the qualitative synthesis and analysed separately as ‘original articles’ (n 20) and ‘reviews’ (n 12; Fig. 1).
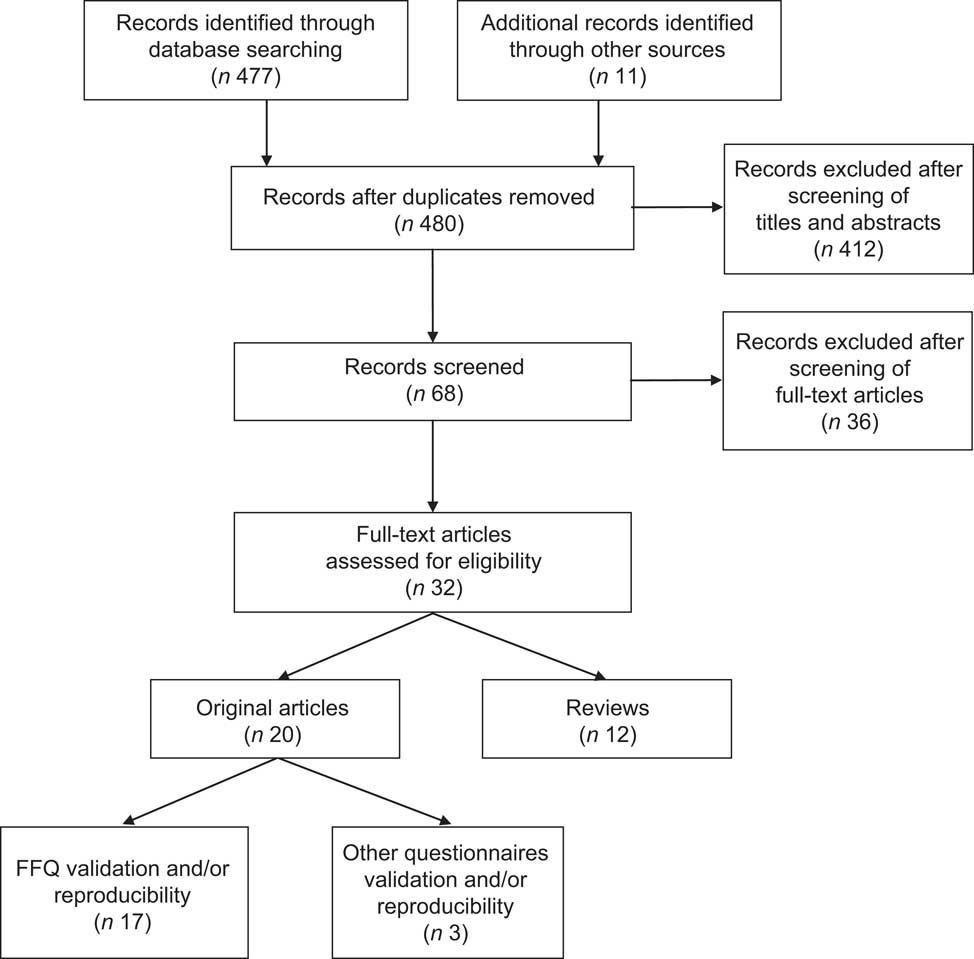
Fig. 1 Selection process flow of the original articles and reviews on the validation and/or reproducibility of dietary assessment methods in adolescents
Original articles
General overview
An overview of the retrieved twenty original articles( Reference Lietz, Barton and Longbottom 1 , Reference Ambrosini, de Klerk and O'Sullivan 13 – Reference Watson, Collins and Sibbritt 31 ) is shown in Table 1.
Table 1 Overview of the twenty eligible original articles
NR, not reported; FLVS II, Fleurbaix Laventie Ville Santé Study II; SBNM, School-Based Nutrition Monitoring; EPIC, European Prospective Investigation into Cancer and Nutrition; GUTS, Growing Up Today Study; HBSC, Health Behaviour in School-Aged Children; HELENA, Healthy Lifestyle by Nutrition in Adolescence; ACAES, Australian Child and Adolescent Eating Survey; BKQ, Block Kids Questionnaire; 24-HR, 24 h recall; SNAP™, Synchronized Nutrition and Activity Program™; GAFFQ, Greek Youth Adolescent's FFQ; DH, diet history; AFFQ, FFQ for Adolescents; YANA-C, Young Adolescents’ Nutrition Assessment on Computer; FR, food record; WFR, weighed food record; YAQ, Youth/Adolescent Questionnaire; FBC, food behaviour checklist.
The majority (n 17)( Reference Lietz, Barton and Longbottom 1 , Reference Ambrosini, de Klerk and O'Sullivan 13 – Reference Matthys, Pynaert and De Keyzer 20 , Reference Papadopoulou, Barboukis and Dalkiranis 22 – Reference Shatenstein, Amre and Jabbour 24 , Reference Slater, Philippi and Fisberg 26 , Reference Vereecken and Maes 27 , Reference Vereecken, De Bourdeaudhuij and Maes 29 – Reference Watson, Collins and Sibbritt 31 ) of them were identified as studies assessing the validation and reproducibility of FFQ against reference dietary instruments (Table 2), while the remaining three studies considered questionnaires other than FFQ analysed for their validity and reproducibility against different reference methods( Reference Moore, Ells and McLure 21 , Reference Sjoberg and Hulthe 25 , Reference Vereecken, Covents and Matthys 28 ) (Table 3).
Table 2 Characteristics of the seventeen FFQ validation studies
NR, not reported; PB, paper based; WB, web based; IW, interviewer administered; SA, self-administered; FR, food record; FDA, Food and Drug Administration; FLVS I, Fleurbaix Laventie Ville Santé Study I; MAFF, Ministry of Agriculture, Fisheries, and Foods; NNS, National Nutrition Survey; ABS, Australian Bureau of Statistics; NHANES, National Heatlh and Nutrition Examination Survey; USDA, US Department of Agriculture; WFR, weighted food record; 24-HR, 24 h recall; YAQ, Youth/Adolescent Questionnaire; FBC, food behaviour checklist; YANA-C, Young Adolescents’ Nutrition Assessment on Computer; CC, correlation coefficient; LOA, limits of agreement; κ w, weighted kappa coefficient; NS, not stated; ICC, intra-class correlation coefficient.
Table 3 Characteristics of the three validation studies of other questionnaires than the FFQ
24-HR, 24 h recall; DH, diet history; NR, not reported; WB, web based; PB, paper based; SA, self-administered; IW, interviewer administered; USDA, US Department of Agriculture; FR, food record; LOA, limits of agreement; CC, correlation coefficient; κ w, weighted kappa coefficient; NS, not stated.
The outcome in some cases included the values of validity and reproducibility of the instrument to assess both food and nutrient intakes( Reference Cullen, Watson and Zakeri 16 , Reference Deschamps, De Lauzon-Guillain and Lafay 17 , Reference Sjoberg and Hulthe 25 , Reference Vereecken, Covents and Matthys 28 – Reference Watanabe, Yamaoka and Yokotsuka 30 ), while some studies considered only the food intake( Reference Hoelscher, Day and Kelder 18 , Reference Matthys, Pynaert and De Keyzer 20 – Reference Moore, Ells and McLure 21 , Reference Vereecken and Maes 27 ) and some others only the nutrient intake( Reference Lietz, Barton and Longbottom 1 , Reference Ambrosini, de Klerk and O'Sullivan 13 – Reference Bertoli, Petroni and Pagliato 15 , Reference Hong, Dibley and Sibbritt 19 , Reference Papadopoulou, Barboukis and Dalkiranis 22 – Reference Shatenstein, Amre and Jabbour 24 , Reference Slater, Philippi and Fisberg 26 , Reference Watson, Collins and Sibbritt 31 ).
Since healthy adolescents represent the target of the present review, the most common setting where the questionnaires were administered was the school (Table 1). In some studies the setting was a hospital and in these cases only the healthy subjects selected by the author were considered, while in a few other cases the household environment (direct or telephone interview) was chosen (Table 1).
FFQ analysed by their intrinsic characteristics
The seventeen studies where FFQ were found to be reasonably valid and reproducible were analysed on the basis of their intrinsic characteristics: number of food groups and food items; consumption interval; paper-based or web-based format; interview or self-administered mode; portion size estimation; food composition databases used for the nutrient conversion; administration duration; and number of FFQ administered and interval for the retest (Table 2).
The described FFQ were mostly semi-quantitative, whereby the instrument addressed both the frequency and the amount consumed for each food item( Reference Willett 32 ). A quite high variability was highlighted between the studies. Foods were gathered into groups that ranged in number between ten( Reference Lietz, Barton and Longbottom 1 ) and twenty-four( Reference Deschamps, De Lauzon-Guillain and Lafay 17 ) food groups; the number of food items included in the different FFQ ranged between twenty-six( Reference Rockett, Berkey and Colditz 23 ) and 212( Reference Ambrosini, de Klerk and O'Sullivan 13 ), with an average of 104. As an FFQ may not be suitable for recalling diet in the distant past( Reference Fraser, Lindsted and Knutsen 33 ), the consumption interval reported in the retrieved FFQ was generally the previous week or month, or the previous 6 months or year. Only two of the retrieved articles had validated a web-based FFQ in adolescents( Reference Matthys, Pynaert and De Keyzer 20 , Reference Vereecken, De Bourdeaudhuij and Maes 29 ) in relation to food and nutrient data, respectively; all the others were paper-based questionnaires. Four of the FFQ were self-administered( Reference Rockett, Berkey and Colditz 23 , Reference Shatenstein, Amre and Jabbour 24 , Reference Watanabe, Yamaoka and Yokotsuka 30 , Reference Watson, Collins and Sibbritt 31 ), while the rest were partially or fully interviewer-administered. Portion sizes were estimated mostly based on photographs/illustrations, while a lower amount of studies used household measures (e.g. cups, tablespoons), natural units or a combination of them.
The fourteen studies that translated food intakes into nutrient intakes( Reference Lietz, Barton and Longbottom 1 , Reference Ambrosini, de Klerk and O'Sullivan 13 – Reference Deschamps, De Lauzon-Guillain and Lafay 17 , Reference Hong, Dibley and Sibbritt 19 , Reference Papadopoulou, Barboukis and Dalkiranis 22 – Reference Shatenstein, Amre and Jabbour 24 , Reference Slater, Philippi and Fisberg 26 , Reference Vereecken, De Bourdeaudhuij and Maes 29 – Reference Watson, Collins and Sibbritt 31 ) used national or other types of food composition databases, thus resulting in a wide heterogeneity of databases.
In those papers reporting the time needed to complete the FFQ, an average time of 30 min was calculated.
In some studies, the FFQ was administered twice after a time interval ranging from 1 week to 6 months after the first administration, in order to evaluate the reproducibility of the method( Reference Cullen, Watson and Zakeri 16 , Reference Deschamps, De Lauzon-Guillain and Lafay 17 , Reference Hong, Dibley and Sibbritt 19 , Reference Rockett, Berkey and Colditz 23 , Reference Vereecken, De Bourdeaudhuij and Maes 29 – Reference Watson, Collins and Sibbritt 31 ).
FFQ analysed by the validation study characteristics
The characteristics of the validation study were also considered: sample size; reference method (FR or 24-HR); and statistics used to assess the agreement between the two methods and the reproducibility.
Except for one study where the number of participants was very high( Reference Vereecken and Maes 27 ) (n 7072), the sample size ranged from seventeen( Reference Deschamps, De Lauzon-Guillain and Lafay 17 ) to 785( Reference Ambrosini, de Klerk and O'Sullivan 13 ) participants (Table 1). Moreover, in some studies the sample was not homogeneous for variables such as sex. Almost all of the studies reported the difference between males and females: in some cases( Reference Shatenstein, Amre and Jabbour 24 ) it was stated that there was a stronger association for girls; in other studies the questionnaire performed better for males in adequately classifying individuals for all nutrients( Reference Ambrosini, de Klerk and O'Sullivan 13 ) or according to their total fat and protein intake( Reference Slater, Philippi and Fisberg 26 ), or fibre( Reference Deschamps, De Lauzon-Guillain and Lafay 17 ) and PUFA intake( Reference Deschamps, De Lauzon-Guillain and Lafay 17 ).
With regard to the statistics used in the studies, comparison between methods to assess measurement differences in the validation studies used the mean comparison as a first approach (this is not shown in Table 2). Sometimes Student's t test for paired samples (for normally distributed variables)( Reference Bertoli, Petroni and Pagliato 15 , Reference Slater, Philippi and Fisberg 26 ) or the Wilcoxon signed-rank test (for skewed distributions)( Reference Matthys, Pynaert and De Keyzer 20 , Reference Shatenstein, Amre and Jabbour 24 , Reference Vereecken, De Bourdeaudhuij and Maes 29 ) was used.
Although Ambrosini et al.( Reference Ambrosini, de Klerk and O'Sullivan 13 ) and others( Reference Chinn 34 , Reference Hebert and Miller 35 ) previously showed that the correlation coefficient can be a misleading indicator of agreement, all retrieved studies calculated Pearson's or Spearman's correlation coefficient (Table 2), respectively when the sample distribution was normal or transformed into a normal one, or when it was skewed. In some studies the correlation was considered crude; in some others the presentation of results included the adjustment of nutrients for total energy intake using regression techniques (energy-adjusted values) and/or values de-attenuated from the weakening effect of measurement error.
Other approaches used in the retrieved studies to determine agreement were weighted kappa values, the mean agreement and the limits of agreement (LOA) as a percentage( Reference Bland and Altman 36 ) (Table 2). Weighted kappa values were used in five studies( Reference Arajuo, Massae Yokoo and Alves Pereira 14 , Reference Bertoli, Petroni and Pagliato 15 , Reference Hoelscher, Day and Kelder 18 , Reference Hong, Dibley and Sibbritt 19 , Reference Watson, Collins and Sibbritt 31 ). In most cases, the number of categories used for calculating kappa statistics to compare classification of nutrient data varied from two to five( Reference Brenner and Kliebsch 37 , Reference Sim and Wright 38 ). In the validation studies of dietary intake considered, quintiles were used in the calculation of kappa statistics( Reference Hong, Dibley and Sibbritt 19 , Reference Watson, Collins and Sibbritt 31 ). The mean agreement % and the LOA %, sometimes regressed with the Bland–Altman plot( Reference Altman 39 , Reference Bland and Altman 40 ), were used in twelve studies( Reference Lietz, Barton and Longbottom 1 , Reference Ambrosini, de Klerk and O'Sullivan 13 – Reference Cullen, Watson and Zakeri 16 , Reference Hoelscher, Day and Kelder 18 – Reference Matthys, Pynaert and De Keyzer 20 , Reference Shatenstein, Amre and Jabbour 24 , Reference Vereecken and Maes 27 , Reference Vereecken, De Bourdeaudhuij and Maes 29 , Reference Watson, Collins and Sibbritt 31 ). Since correct ranking ability is a desired outcome from an FFQ, nine studies ranked the subjects by using the same or adjacent tertile( Reference Lietz, Barton and Longbottom 1 , Reference Ambrosini, de Klerk and O'Sullivan 13 , Reference Bertoli, Petroni and Pagliato 15 ), quartile( Reference Arajuo, Massae Yokoo and Alves Pereira 14 , Reference Shatenstein, Amre and Jabbour 24 , Reference Slater, Philippi and Fisberg 26 ) or quintile( Reference Deschamps, De Lauzon-Guillain and Lafay 17 , Reference Hong, Dibley and Sibbritt 19 , Reference Watson, Collins and Sibbritt 31 ) per cent method.
The studies were then further analysed on the basis of the reference method used: the FR and the 24-HR were the main gold standards.
FFQ v. FR. The majority of FFQ used as reference method the FR, estimated or weighted, covering 3 d or 7 d( Reference Lietz, Barton and Longbottom 1 , Reference Ambrosini, de Klerk and O'Sullivan 13 – Reference Bertoli, Petroni and Pagliato 15 , Reference Matthys, Pynaert and De Keyzer 20 , Reference Papadopoulou, Barboukis and Dalkiranis 22 , Reference Shatenstein, Amre and Jabbour 24 , Reference Watanabe, Yamaoka and Yokotsuka 30 , Reference Watson, Collins and Sibbritt 31 ). The FFQ in general tended to overestimate nutrient intakes in comparison with the FR, even though they reported a modest or good agreement. A good correlation between two methods is generally considered for a coefficient value >0·4( Reference Cade, Burley and Warm 41 ). On the basis of this cut-off, the selected studies showed a good correlation coefficient between the dietary intake method and the reference method for most food groups and nutrients, thus indicating that the FFQ can be used as a reliable instrument to estimate food and nutrient intakes of adolescents, rank them on a range of nutrient intakes and classify them into low, medium and high consumers. For some studies this was not valid for some food groups and nutrients, which will be evaluated in a further study of meta-analysis.
FFQ v. 24-HR. Eight studies validated an FFQ against a 24-HR( Reference Cullen, Watson and Zakeri 16 – Reference Hong, Dibley and Sibbritt 19 , Reference Rockett, Berkey and Colditz 23 , Reference Slater, Philippi and Fisberg 26 , Reference Vereecken and Maes 27 , Reference Vereecken, De Bourdeaudhuij and Maes 29 ). The majority of 24-HR were repeated three or four times, in a period of 7 d, 2–4 months or 1 year, and included weekdays and weekend days. Almost all the selected FFQ could be used to classify subjects according to their food and nutrient intakes. Nutrient correlations between FFQ and 24-HR data that were de-attenuated and adjusted for energy intake tended to yield higher correlation coefficient values than the crude analysis.
Some authors found a low adjusted and de-attenuated correlation coefficient (<0·30) for certain food groups and nutrients. For example, the Block Kids Questionnaire had validity for some nutrients, but not for most food groups assessed( Reference Cullen, Watson and Zakeri 16 ).
For assessment of the reproducibility of the method, in the study from Cullen et al.( Reference Cullen, Watson and Zakeri 16 ) and Dechamps et al.( Reference Deschamps, De Lauzon-Guillain and Lafay 17 ) the intra-class correlation coefficient (ICC) was used for the reproducibility evaluation (Table 2). A high value of this coefficient indicates a low within-person variation. In the first study all ICC were >0·40, except for percentage of energy from protein and for servings of vegetables and fruit. In the second study, the values were higher for food items consumed daily such as milk or sugars and confectionery, and lower for rarely eaten food such as inner organs.
In the other studies, the Pearson's or Spearman's correlation coefficient was mostly used for assessment of the reproducibility of the foods and nutrients.
Other statistics used for misclassification in the reproducibility study were quintiles and weighted kappa( Reference Hong, Dibley and Sibbritt 19 ) and the Bland–Altman method plot( Reference Watson, Collins and Sibbritt 31 ).
Other forms of dietary questionnaires
Three studies( Reference Moore, Ells and McLure 21 , Reference Sjoberg and Hulthe 25 , Reference Vereecken, Covents and Matthys 28 ) validated questionnaires other than FFQ (Table 3). One of the three studies, which considered the validation of a 24-HR( Reference Moore, Ells and McLure 21 ), described the use of a web-based software by the US Department of Agriculture among schoolchildren aged 7–15 years: the Synchronized Nutrition and Activity Program™ (SNAP™), which provides a quick, accurate, low-burden and cost-effective estimation of dietary intake. All foods and drinks were analysed by count (i.e. the number of times a particular food was selected), and a combination of the mean between-method differences and Bland–Altman LOA were used for the statistics. The mean difference between methods was substantially less than 1 count for all but three categories – confectionery and cakes, total energy-dense foods and total carbohydrate-rich foods. Measurement agreement between SNAP and the 24 h multiple-pass dietary recall was good for all food groups.
A recent study stated that the Young Adolescents’ Nutrition Assessment on Computer (YANA-C) tool can be a promising method to collect detailed dietary information from young adolescents with relatively low staff resources, useful in many nutrition research applications( Reference Vereecken, Covents and Matthys 28 ). The authors reported that the results obtained using the YANA-C agreed well with both FR and 24-HR interviews used as standard methods.
Only one study( Reference Sjoberg and Hulthe 25 ) validated another method, a DH, against an estimated 7 d FR, stating that it can be a useful method to assess dietary intake in adolescence.
Results of the study quality assessment
The results from the study quality assessment of the seventeen retrieved articles on the validation and reproducibility of FFQ in adolescents are shown in Table 2. Out of the seventeen selected studies, all except three( Reference Matthys, Pynaert and De Keyzer 20 , Reference Rockett, Berkey and Colditz 23 , Reference Vereecken and Maes 27 ) resulted in a high quality ranking according to the system proposed by Dennis et al.( Reference Dennis, Snetselaar and Nothwehr 11 ). The issues that decreased the quality of the study, according to this quality score, were related mainly to the number of food items; a number of food items less than seventy is likely to reduce the quality of the nutrition information.
According to the score proposed by Serra-Majem et al.( Reference Serra-Majem, Frost Andersen and Henríque Sánchez 12 ), the seventeen articles were ranked as follows: the study from Slater et al.( Reference Slater, Philippi and Fisberg 26 ) was very good/excellent; twelve studies( Reference Lietz, Barton and Longbottom 1 , Reference Ambrosini, de Klerk and O'Sullivan 13 – Reference Hong, Dibley and Sibbritt 19 , Reference Rockett, Berkey and Colditz 23 , Reference Vereecken and Maes 27 , Reference Vereecken, De Bourdeaudhuij and Maes 29 , Reference Watson, Collins and Sibbritt 31 ) were good; two studies( Reference Papadopoulou, Barboukis and Dalkiranis 22 , Reference Shatenstein, Amre and Jabbour 24 ) were acceptable/reasonable; and two studies( Reference Matthys, Pynaert and De Keyzer 20 , Reference Watanabe, Yamaoka and Yokotsuka 30 ) were poor. The quality assessment of the three studies that used methods other than the FFQ( Reference Moore, Ells and McLure 21 , Reference Sjoberg and Hulthe 25 , Reference Vereecken, Covents and Matthys 28 ) resulted in one study being poor( Reference Matthys, Pynaert and De Keyzer 20 ) and in two studies being acceptable/reasonable( Reference Sjoberg and Hulthe 25 , Reference Vereecken, Covents and Matthys 28 ). The items that affected the quality of the study, according to the score system from Serra-Majem et al., were mainly the statistics used to assess validity: using the mean comparison or the correlation coefficients alone is not enough to describe one study; the studies from authors that used correlation coefficients adjusted for energy or de-attenuated, or other statistics (such as the Bland–Altman method), in addition to the correlation coefficients, were ranked into a higher quality level. Data gathered by self-administration were subject to be less valid and reliable( Reference Matthys, Pynaert and De Keyzer 20 , Reference Shatenstein, Amre and Jabbour 24 , Reference Watanabe, Yamaoka and Yokotsuka 30 ), as the scoring system assigned a higher score to the interviewer administration. The heterogeneity for variables such as sex also retained importance, but did not influence consistently the final score. Seasonality and supplements were never reported in the retrieved studies.
Reviews
A total of twelve reviews were considered for the analysis( Reference Rockett, Berkeya and Colditz 2 , Reference Thompson and Subar 4 , 9 , Reference Altman 39 , Reference Biro, Hulshof and Ovesen 42 – Reference Probst and Tapsell 49 ). In the USA a new version of ASA24 for use with school-aged children( Reference Bliss 43 ) was developed, consisting of a specialized software program adapted from the Automated Multiple Pass Method to enable the development of a computer-based self-administered 24-HR. Children 14–16 years of age are also likely to require a children's version but testing has not yet been conducted with this age group; however, the adult version may be appropriate for those 14–15 years of age or above, but this has not been thoroughly evaluated.
The review from Cade et al.( Reference Cade, Thompson and Burley 46 ) was prepared to guide the individual about to embark on the development and/or use of an FFQ as a dietary assessment tool, and this provided some guidelines for conducting a validation study on a new FFQ. In the review from Ortiz-Andrellucchi et al.( Reference Ortiz-Andrellucchi, Henriquez-Sanchez and Sanchez-Villegas 48 ), 80 % of the reviewed studies used FFQ to assess micronutrient intakes for which wide variations in the number of food items were observed (ten to 190 items). In the studies reviewed, the FFQ comprised the dietary method that was most utilized to assess the micronutrient intakes in these groups, in which it is of utmost importance to recognize methodological aspects such as food composition databases used for analysis, portion-size assessment and the time periods between the two dietary assessment methods.
Where interventions are longer and a large number of participants is involved, such as those surveys directed at schoolchildren, 24-HR and 3 d or 7 d FR are possible and can provide more accurate and detailed data( Reference Contento, Randell and Basch 47 ).
Some reviews suggested the use of the 24-HR as the best method to estimate food consumption in adolescents. Specifically, the use of two non-consecutive 24-HR and a food list to assess the non-users for infrequently consumed foods was suggested by Biro et al.( Reference Biro, Hulshof and Ovesen 42 ) within the EFCOSUM (European Food Consumption Survey Method) Project.
Weighted FR provided the best estimates of energy intake for younger children aged 0·5 to 4 years, while the DH method provided better estimates for adolescents aged 16 years or more( Reference Burrows, Martin and Collins 45 ).
Computer tailoring is important in nutrition research and is currently one of the most promising and innovative approaches( Reference Brug, Oenema and Campbell 44 ). However, little is known to date and more research is needed about when, why, where and for whom computer-tailored nutrition education is effective. In the review from Probst and Tapsell( Reference Probst and Tapsell 49 ) a wide range of programs and features for computerized diet assessment were identified, but they did not specify what age they referred to.
There are many measurement issues that may impact on reporting accuracy when assessing the dietary intakes of children and adolescents( 9 ). One of these is the portion-size estimation: for the quantification of portion sizes some papers suggested a picture book, including country-specific dishes, with additional household measures and other relevant measurements( Reference Biro, Hulshof and Ovesen 42 ).
Discussion
The present systematic literature review provides useful information on the most valid and reliable dietary assessment methods used worldwide in large-scale surveys on adolescents and suggests the most appropriate tool to use for the collection of dietary intake data.
In this review, fourteen developed and validated FFQ were identified. Semi-quantitative FFQ were demonstrated to be valid and reproducible instruments for estimating dietary intake in adolescent age at a large-scale level. FFQ have the advantages of ease of administration, ability to assess dietary intake over an extended period of time and low cost( Reference Subar 50 ). However, probably because of misclassification, FFQ are not always able to detect weak associations( Reference Schatzkin, Kipnis and Carroll 51 ), are less specific and have greater measurement error( Reference Subar 50 , Reference Kipnis, Subar and Midthune 52 ). The FFQ analysed in the current review differed in the way they were developed and showed large variations in design characteristics, such as the number of items or inclusion of portion-size questions, which could affect reported intakes according to Molag et al.( Reference Molag, de Vries and Ocke 53 ). This leads to the need to further characterize or create new FFQ targeted to adolescents for a standardized data collection.
With regard to the use of a 24-HR for children over 10 years of age, the EFCOSUM Project recommends the use of two non-consecutive 24-HR. It recommends the EPIC-SOFT program as the first choice to collect 24-HR in all European countries( Reference Slimani and Valsta 54 ). However, additional developments and improvements are needed, and at the moment the EFCOVAL (European Food Consumption Validation) Project is trying to adapt and validate it according to the specific needs of future possible pan-European monitoring surveys. The 24-HR YANA-C is a useful instrument for collecting data on food and nutrient intakes in adolescents, but it requires too much time to be compiled and is complex to be used in such a large target population. Also in the USA the primary instrument used to collect dietary food intake data in national surveys is a 24-HR: the ASA24 that was developed and is going to be validated also in school-age children.
Specific design and validation issues were highlighted in the present review. These issues should be taken into account when preparing tools for dietary data collection. The retrieved reviews gave indications about how to choose appropriate foods; what number of items to choose; how to manage the portion-size collection; the method of administration; the use of appropriate nutrient databases; the pre-testing process; the validation and reproducibility process; the statistical issues; and other issues such as the seasonality or the use of supplements. There are many factors that may affect the validity of a dietary questionnaire such as respondent characteristics, questionnaire design and quantification, adequacy of the reference data, quality control and data management( Reference Serra-Majem, Frost Andersen and Henríque Sánchez 12 ).
One of the largest concerns about dietary surveys based on recall is their reliance on memory, which is subject to several errors; recall errors increase as a function of time and up to 30 % of food memory may be lost from the previous day( Reference Fries, Green and Bowen 55 ).
The motivation, cognitive ability and literacy level of the participants are basic determinants for which instrument to select. Moreover, adolescents experience difficulty in reporting portion size. Food should be described in frequencies and quantities of units or portions within a certain time frame; this raises the issue of the portion-size assessment. Some food items may be forgotten, other food items may be remembered although not having been consumed within the given time frame. Some food items are not recognized because they are part of a dish (e.g. in pasta with legumes the olive oil is often ignored, as well as the condiment in the pizza). This may lead to overestimation or underestimation of intake. Substantial week-to-week, day-to-day and meal-to-meal variability in food and portion sizes consumed may require arithmetic computations to average usual consumption to fit into the FFQ response categories, and hence may be simplified when a long list of estimations needs to be done. The current findings suggest for example to apply a correction factor to decrease the reported intake of fibre, vitamin C, calcium and iron and to increase the percentage of energy from fat. In particular, under-reporting of energy can be a problem in dietary assessment studies; energy adjustment appears to minimize the bias generated by under-reporting with respect to particular nutrients and their association with various disease outcomes( Reference Gnardellis, Boulou and Trichopoulou 56 ). Thus, it is important to include this value in each validation study that is associated with the study analysis.
The statistical analyses of validation data (e.g. energy adjustment, de-attenuation) are important issues to be considered. Since several factors may affect the measures, it is difficult to accurately summarize the correlation coefficient and the agreement for validity and reproducibility abstracted from published articles. The current review, therefore, should be considered a rough description of the validity and reproducibility of the identified FFQ, which have to be analysed in their entirety and by food group, nutrient, FFQ length and other characteristics in a further meta-analysis study. Correlation coefficients were used in all the selected studies, but this method alone is flawed because it does not measure the agreement between two methods, only the degree to which the methods are related( Reference Altman 39 ). Correlation coefficients can be useful in conjunction with the Bland–Altman method, which assesses in graphical form the agreement between the methods across the range of intakes by plotting the mean of the two methods against the difference. The mean agreement indicates how well the FFQ and FR agree on average. The LOA method is used to determine agreement between absolute values from each method and provides an informative analysis of reliability, including information about the magnitude of errors between methods, the direction of bias between methods and whether or not bias is constant across levels of intake.
One important objective is to reduce the costs of collection and processing of dietary intake information due to the amounts and complexity of the data usually involved( Reference Thompson, Subar and Loria 57 ). Beyond new technologies, a recent approach used in large studies is the Internet-based FFQ. The questionnaires that used web-based methods were the FFQ from Matthys et al.( Reference Matthys, Pynaert and De Keyzer 20 ), the 24-HR SNAP( Reference Moore, Ells and McLure 21 ), the 24-HR YANA-C( Reference Vereecken, Covents and Matthys 28 , Reference Vereecken, Covents and Sichert-Hellert 58 ), the Health Behaviour in School-aged Children (HBSC) FFQ( Reference Vereecken and Maes 59 ) and the Healthy Lifestyle in Europe by Nutrition in Adolescence (HELENA) FFQ( Reference Vereecken, De Bourdeaudhuij and Maes 29 ). Vereecken et al.( Reference Vereecken and Maes 59 ) have investigated whether the computer format of the HBSC FFQ would affect the responses of the adolescents in comparison with the paper-and-pencil format; some differences were found between the female and male reporters. In another study( Reference Vereecken, Covents and Sichert-Hellert 58 ) an adaptation of YANA-C for different country realities in Europe was described: the feasibility of self-administration by comparison with administration by an interviewer was investigated and it was concluded that after an adaptation, translation and standardization of YANA-C, it is possible to assess the dietary intake of adolescents by self-administration in a broad international context. The use of interviewers may be an advantage in some situations and allows for immediate checking by the interviewer of improbable or unlikely responses; against this is the need to standardize the training processes, the cost of employing interviewers and the influence of the interviewer's presence on increasing the likelihood of social desirability bias in the participant's responses. In the light of these considerations, when the quality of the studies is assessed, the assignment of a higher score to the studies that use interviewer-administered questionnaires could be revised. Studies such as those from Matthys( Reference Matthys, Pynaert and De Keyzer 20 ), Shatenstein( Reference Shatenstein, Amre and Jabbour 24 ) and Watanabe( Reference Watanabe, Yamaoka and Yokotsuka 30 ), for example, would gain in quality. Self-administered computerized assessment could be considered a valid way of collecting data; it makes it possible for participants to register and assess their dietary intake at their own pace and convenience; the respondent immediately stores data and interviewers do not have to be present during the entire interview, which saves considerable time and decreases costs. Furthermore, computerized assessment tools can directly calculate nutrient intakes and energy expenditure, which makes it possible to give immediate feedback( Reference Evers and Carol 60 ). In addition, adolescents might be more motivated to report their dietary intake with computer use( Reference Vereecken, Covents and Matthys 28 ).
The first limit of our review is that studies validating dietary intake instruments in comparison with biomarkers were not considered, as they often reflect status rather than intake, short-term rather than long-term intakes, and are invasive and expensive( Reference Lampe and Rock 3 ). Moreover, some foods and nutrients need particular attention when included in an FFQ, since relatively poor validity and reproducibility were observed in FFQ estimates for them; the detailed information on these foods and nutrients is not given in the present review, as it is a purpose of further meta-analysis study. Another limitation is the choice of the language of the articles, which could have excluded validated and reliable dietary methods used in other countries.
Conclusions
There is an ongoing need for the refinement of existing approaches, especially ones that can be used in large epidemiological studies. The analysed validation studies in adolescents justify advocating the FFQ method over the 24-HR and suggest the development of a new semi-quantitative FFQ that could fit the purposes of the ASSO Project. The design of the FFQ will be established in detail after a meta-analysis study on the validity and reproducibility of the identified FFQ, ranking by specific characteristics such as food group, nutrient or FFQ length. The ASSO-FFQ will be a new tool addressing the need for a valid, reproducible, user-friendly, fast, cost-effective, standardized method of accurately assessing nutrient intakes in adolescents.
Acknowledgements
Sources of funding: The work was performed within the Adolescents and Surveillance System for the Obesity prevention (ASSO) Project (code GR-2008-1140742, CUP I85J10000500001), a young researchers’ project funded by the Italian Ministry of Health. The Italian Ministry of Health had no role in the design, analysis or writing of this article. Conflicts of interest: The authors state there are no conflicts of interest. Ethics: Ethical approval was given by the ethical committee of the Azienda Ospedaliera Universitaria Policlinico Paolo Giaccone (approval code n.9/2011). Authors’ contributions: All authors contributed to the development of the review. G.T., C.M. and A.B. performed the search, screening and elaboration of concepts. E.A., M.d.P. and M.J. provided a valuable contribution to the whole manuscript.


