


In recent years, considerable changes in food consumption and dietary patterns have occurred globally( Reference Schmidhuber and Shetty 1 ). Fat-rich, energy-dense diets or diets with a high content of refined carbohydrates are considered one of the main drivers of the increasing prevalence of chronic diseases such as CVD, diabetes, cancer and obesity( 2 – Reference Kopelman 4 ). Hence, major efforts are needed to develop and implement policies to secure a healthy diet( Reference Lock, Smith and Dangour 5 ) and to develop standardized tools to monitor progress towards attainment of such policies( Reference Yach, Hawkes and Epping-Jordan 3 ). For instance, assessing food consumption trends enables agencies to set up and monitor health and nutrition policies and evaluate the extent to which public health messages are perceived and actualized by the population( Reference Perrin, Simon and Hedelin 6 ).
In a previous study, the trends in dietary intake of the Geneva population were reported for the period 1993 to 2000( Reference Galobardes, Costanza and Bernstein 7 ). We now report the trends in dietary intake for the period 1999 to 2009 using the same methodology and including more dietary components than before.
Methods
Sampling
The sampling methodology of the Bus Santé Geneva study has been reported previously( Reference Morabia, Bernstein and Heritier 8 ). Briefly, Bus Santé Geneva aims to monitor risk factors at the community level. Since 1993, the Bus Santé Geneva study has been conducting annual health examination surveys in independent random samples of the total resident population of the Geneva canton, Switzerland. Participants were identified( Reference Wolff, Gaspoz and Guessous 9 ) by means of a standardized procedure using an annual residential list established by local government. This list includes all potential eligible participants aged 34–74 years except persons living illegally in the country. Stratified random sampling was performed on the basis of the list, by gender, within 10-year age strata, proportional to the corresponding population distributions. Two clinics as well as a mobile unit were used to perform the examinations. The survey was conducted throughout the year, from January to December. Participation rates during the period 1999–2009 are indicated in Table 1. The Bus Santé Geneva study complied with the Declaration of Helsinki and was approved by the Institutional Ethics Committee of the University of Geneva. All participants gave written informed consent.
Table 1 Characteristics of the participants in the different surveys of the Bus Santé Geneva study, 1999 to 2009

Results are expressed as percentages or mean and standard deviation. Statistical analysis by the χ 2 test or ANOVA.
An invitation letter was mailed to all potential participants, asking them to indicate the day and time more convenient to come to the mobile unit. In the case of no response, up to seven attempts were made to reach the person by telephone at different times of the day and various days of the week, including Saturday and Sunday. Two more letters were sent when a selected individual could not be reached by telephone. A person who had not been reached after three mailings and seven telephone calls was replaced using the same selection protocol( Reference Morabia, Bernstein and Heritier 8 ). For the period 2005–2008 a smaller number of participants were recruited, as another study was conducted in the Unit of Population Epidemiology with the same amount of resources.
Dietary intake
Dietary intake was assessed using a self-administered, semi-quantitative FFQ which also included portion size( Reference Morabia, Bernstein and Kumanyika 10 , Reference Bernstein, Huot and Morabia 11 ). This FFQ has been validated in the Geneva population( Reference Morabia, Bernstein and Kumanyika 10 – Reference Beer-Borst, Costanza and Pechere-Bertschi 12 ) and several results have been published previously( Reference Morabia, Bernstein and Heritier 8 , Reference Galobardes, Morabia and Bernstein 13 ). Briefly, the FFQ assesses the dietary intake of the previous 4 weeks and consists of ninety-seven different food items which account for more than 90 % of the intake of energy, protein, fat, carbohydrate, alcohol, cholesterol, vitamin D and retinol, and 85 % of the intake of fibre, carotene and Fe. For each item, consumption frequencies ranging from ‘less than once during the last 4 weeks’ to ‘2 or more times per day’ were provided, and the participants also indicated the average serving size (smaller, equal or bigger) compared with a reference size. Each participant brought along her/his filled-in FFQ, which was checked for completion by trained interviewers on the day of the visit. Hence, the response rate for the FFQ was 100 %.
The FFQ data were then converted into nutrients, which were used in the present analysis. The conversion used a single food composition table, which remained identical throughout the study. Total intake of vitamin A was computed in retinol equivalents (RE) according to the formula: RE = retinol intake + (β-carotene intake/12)( Reference Sorenson, Delhumeau and Bernstein 14 ). Under-reporting was considered if the total energy intake was <3556 kJ/d (<850 kcal/d).
Data collected
Participants were asked to fast for at least 8 h. Interviews and examinations were performed from Monday to Friday, between 07.30 and 10.30 hours. On the day of the visit, participants brought back the completed FFQ and a self-administered standardized questionnaire covering lifestyle factors, reproductive history and cardiovascular risk factors. Smoking status was grouped into never, former and current. Age was categorized into age groups of 34–44, 45–54, 55–64 and 65–74 years. Self-reported data on educational level (low/high) were collected; low educational level was defined as primary school and high educational level as secondary/tertiary. Physical activity was assessed using a validated questionnaire( Reference Bernstein, Sloutskis and Kumanyika 15 ). Participants were considered as sedentary if they spent less than 10 % of their daily energy on activities with intensity four times their (sex-, age-, height- and weight-adjusted) BMR, calculated using WHO formulas( 16 ). More details on the examination procedure are available elsewhere( Reference Morabia, Bernstein and Heritier 8 ).
Statistical analysis
Statistical analyses were performed with the Stata statistical software package version 12. Participants without data for education (n 37) were excluded from the analyses. Statistical analysis was conducted in two steps: (i) using the whole sample and (ii) excluding participants with extreme values for energy intake (<3556 and >18 828 kJ/d (<850 and >4500 kcal/d)) as recommended( Reference Iqbal, Ajayan and Bharathi 17 ). For each nutrient (absolute value or expressed as a percentage of total energy intake), descriptive results were expressed as mean and standard deviation. Similar to previous studies, trends in dietary intake were assessed separately for each gender by linear regression using survey year as the independent variable. As the distribution of participants throughout the year was not identical between years, it was decided to adjust on year quarter as previously( Reference Galobardes, Costanza and Bernstein 7 ). Multivariate analysis was conducted adjusting for age, smoking status, educational level, sedentariness (yes/no) and quarter. For nutrients, a further adjustment on total energy intake was also performed. As the FFQ collected data on the 4 weeks preceding the examination, a second analysis was conducted after subtracting 28 d from the date of examination, so that the year corresponded to the period of dietary consumption. Hence, a participant examined on 15 January 2005 would be considered as providing dietary data for 2004. Statistical significance was considered as P < 0·05.
Results
Descriptive data
Data from 9283 participants (50 % men), mean age 51·5 (sd 10·8) years (range 34–74 years), were analysed. Their main characteristics according to year of survey are summarized in Table 1. No significant differences were found regarding age, BMI and BMI categories, while the prevalence of current smokers decreased and the prevalence of former smokers increased from 1999 to 2009.
Trends in nutrient intake
The trends in dietary intake for the period 1999–2009 according to gender are summarized in Table 2. Between 1999 and 2009, total energy intake decreased by 2·9 % in men and by 6·3 % in women. Vegetable protein intake as well as total carbohydrate intake, expressed as a percentage of total energy intake, increased in women. MUFA intake increased while SFA, PUFA and alcohol intakes decreased in both genders. A further increase in monosaccharide intake was observed in men only. Daily intakes of cholesterol, Ca and Fe decreased, while the intake of carotene increased in both genders. A decrease in retinol intake was also found, but only among men. Conversely, no changes in fibre, vitamin A and vitamin D intakes were found. Similar findings were obtained after multivariate adjustment (Table 2), except that the increase in MUFA became borderline significant in women (P = 0·06), the decrease in Fe became borderline significant in men (P = 0·051) and the decrease in cholesterol intake was no longer significant in both genders (Table 2).
Table 2 Dietary intake of the Geneva population, 1999–2009, according to gender, all participants (n 9283)
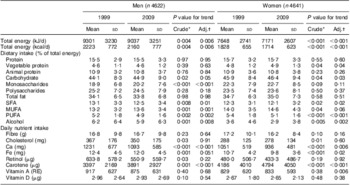
RE, retinol equivalents.
Trends were assessed by linear regression: *unadjusted; †adjusted for age, smoking status, educational level, sedentariness and quarter. For nutrients, a further adjustment on total energy intake was also performed.
Similar findings were obtained when participants with extreme dietary intakes (<3556 and >18 828 kJ/d (<850 and >4500 kcal/d)) were excluded (n 271), except that the decrease in SFA, as well as the increase in vegetable protein and carbohydrate, were no longer significant in women. Multivariate adjustment resulted in similar findings, except that the increase in total carbohydrate was no longer significant in men and the decrease in cholesterol was no longer significant in both genders (Table 3). Finally, the analysis taking into account the period of dietary collection (i.e. subtracting 28 d from the examination date) led to similar conclusions (see Supplementary Materials, supplementary tables 1 and 2).
Table 3 Dietary intake of the Geneva population, 1999–2009, according to gender, excluding participants with extreme dietary intakes (n 9012)

RE, retinol equivalents.
Trends were assessed by linear regression: *unadjusted; †adjusted for age, smoking status, educational level, sedentariness and quarter. For nutrients, a further adjustment on total energy intake was also performed.
Discussion
There is little information regarding dietary trends in Switzerland, a country characterized by relatively low obesity levels( Reference Finucane, Stevens and Cowan 18 ) and a low mortality from CVD( Reference Muller-Nordhorn, Binting and Roll 19 , Reference Redon, Olsen and Cooper 20 ). A previous study( Reference Guerra, Paccaud and Marques-Vidal 21 ) provided data for a longer period (1961–2007), but that study relied on data from the FAO food balance sheets (http://www.fao.org) and not on individually assessed data. The present study provides insight into the dietary intake of the Geneva population for the period 1999 to 2009 using a standardized methodology. Our results indicate a slight and significant decrease in total energy intake, decreases in the percentage of total energy intake derived from SFA, PUFA and alcohol, and increases in the percentage of total energy intake derived from carbohydrate and MUFA. Regarding nutrients, significant decreases in the intakes of Ca and Fe were found.
The reasons for such changes are difficult to identify and can only be speculated. For instance, most changes persisted after multivariate adjustment for age, education, physical activity and smoking, thus suggesting that societal changes do not impact dietary changes significantly. A more likely explanation would be changes in the overall provision or personal choice of foods, as has been demonstrated in other countries( Reference Zatonski, McMichael and Powles 22 ). For instance, previous studies conducted in Geneva showed that food-borne events such as ‘mad cow disease’ impacted food intake, but that the magnitude of the effect varied according to gender( Reference Sorenson, Delhumeau and Bernstein 14 , Reference Morabia, Bernstein and Heritier 23 ). Overall, more studies are needed to better assess the societal, economic and other factors responsible for the changes in dietary intake in Geneva.
Total energy intake decreased in both genders. These findings confirm the results of the previous study period( Reference Morabia, Bernstein and Heritier 8 ) where a significant decline in total energy intake was found among men but not among women. These findings are also partly in agreement with a prior study( Reference Guerra, Paccaud and Marques-Vidal 21 ) which showed no significant increase in total energy availability for the Swiss population. The most likely reason for this decline in total energy intake is a decrease in total energy expenditure, induced by a decrease in physically demanding activities and an increase in sedentary office work. Indeed, and in agreement with a previous study( Reference Galobardes, Costanza and Bernstein 7 ), mean BMI did not change throughout the study period, suggesting that this decrease in total energy intake is paralleled by an equivalent decrease in physical activity. Still, other reasons cannot be ruled out, such as an increased underestimation of dietary intake( Reference Heitmann, Lissner and Osler 24 ), and it would be of interest to confirm these findings in other population-based surveys.
Major nutrients
A favourable change in fat intake occurred: the percentage of energy from SFA decreased while that from MUFA increased. Similar trends have also been reported in the US population by the National Health Interview Survey, conducted between 1987 and 1992( Reference Breslow, Subar and Patterson 25 ). The decrease in SFA intake might be related to an augmenting awareness about reducing fat and cholesterol intakes and improving diet( Reference Perrin, Simon and Hedelin 6 ). Conversely, the increase in MUFA intake might be attributable to the increase in sunflower oil and olive oil availability( Reference Guerra, Paccaud and Marques-Vidal 21 ). Still, in 2009, mean total fat intake represented over 33 % of total energy intake, a value higher than recommended( 26 ). Hence, although the changes in fat quality are of interest, future efforts should be directed at decreasing the percentage of total energy intake derived from fat.
An increase in carbohydrate intake was found, this increase being more pronounced and restricted to monosaccharides in men. This increase is in agreement with the observed augmentation in sugar and sweeteners availability in Switzerland( Reference Guerra, Paccaud and Marques-Vidal 21 ). The increase in monosaccharide intake among men only might be related to an increased consumption of sugar or sugar-containing drinks among boys( Reference Cheng, Libuda and Karaolis-Danckert 27 , Reference Skatrud-Mickelson, Adachi-Mejia and Sutherland 28 ), which would be maintained in adulthood( Reference Laurent-Jaccard, de Matteis and Hofstetter 29 , Reference Malik and Hu 30 ).
No changes were found regarding total protein intake, a finding also reported elsewhere( Reference Arnett, Xiong and McGovern 31 ). These findings are not supported by the official data( 32 ), which showed an increase in beef consumption of 10 % and in poultry consumption of 19 % in 2009 relative to 2000/2002, and also by a previous study( Reference Sorenson, Delhumeau and Bernstein 14 ) which showed a slow increase in meat and beef consumption in women between 1993 and 2000. However, a decrease in beef consumption was found in men. Although a possible geographical bias might be present, with the Geneva population consuming less meat than the rest of the country, there are currently no data available regarding geographical patterns of food consumption for Switzerland and future studies are needed to better assess this point.
Other nutrients
A decrease in alcohol intake was observed, a finding in agreement with a previous study( Reference Etter and Gmel 33 ) and also confirmed by the Swiss federal office of alcohols, which reported a decrease in total per capita alcohol consumption from 9·2 l/year in 1999 to 8·7 l/year in 2009( 34 ). This decrease can partly be explained by the increasing cost of alcoholic beverages( 35 ) and also by a special tax on alcopops introduced in 2004( 34 ). Still, an increase in alcohol consumption has been reported in younger age groups( Reference Michaud, Berchtold and Jeannin 36 ), so it would be of interest to monitor if this increase in younger persons is maintained as they get older.
Ca intake decreased considerably in both genders between 1999 and 2009, a finding in contradiction with dairy production. For instance, between 2000 and 2010, cheese production increased by 7·8 % in Switzerland( 32 ) and total milk production increased from 3·05 million tonnes in 1990 to 3·44 million tonnes in 2010( 37 ). As suggested previously, a possible explanation might be the predominantly urban setting of the Geneva population, as it has been shown that urban subjects consume less Ca than their rural counterparts( Reference Filip and Zagorski 38 , Reference Minaker, McCargar and Lambraki 39 ). Still, our data stress the need for promoting the consumption of Ca-rich foods, as it has been suggested that over half of the Swiss population does not get the daily amount of Ca recommended for the prevention of osteoporosis( Reference Sloutskis, Bernstein and Burnand 40 ).
As for Ca, a significant decrease in Fe intake was found for both genders. The reasons for such a decrease might be related to changes in meat sources, namely the increase of poultry relative to beef( Reference Guerra, Paccaud and Marques-Vidal 21 ). This unfavourable trend might lead to an increase in the prevalence of Fe-deficiency anaemia in Switzerland, estimated at 9·7 % of pregnant( Reference Hess, Zimmermann and Brogli 41 ) and 12·0 % of non-pregnant women of reproductive age( 42 ).
Study limitations
The present study has several limitations worth noting. First, data were collected using an FFQ, which might provide an incomplete account of all foods consumed. Still, FFQ are commonly used in epidemiological studies because of their low cost and ease of use( Reference Marques-Vidal, Ross and Wynn 43 ) and it has been shown that FFQ are appropriate tools for ranking individuals according to their food and nutrient intakes (e.g. as shown by a study on salt intake that compared 24 h urine collection with salt intake estimated by FFQ, in which similar estimations were obtained by both methods( Reference Beer-Borst, Costanza and Pechere-Bertschi 12 )). Also, it is possible that some participants might have (un)voluntarily under-reported their true habitual food intake, resulting in energy intakes lower than required for long-term energy balance( Reference Cook, Pryer and Shetty 44 ). Still, the percentage of under-reporters was low and excluding participants with extreme values led to similar conclusions.
Dietary changes over time in populations are usually gradual in response to food availability, economic pressure or public health campaigns( Reference Sorenson, Delhumeau and Bernstein 14 ) and it is possible that some changes in dietary intake might have been missed by this FFQ, such as the introduction of novel foods. Still, a change in the FFQ to account for these possible changes would be impractical, as it would require validation and the results might not be fully comparable with the previous instrument. Hence, and despite the existence of other validated FFQ for the French-speaking part of Switzerland( Reference Marques-Vidal, Ross and Wynn 43 ), it was decided to use the same instrument throughout the study period. Two nationwide healthy diet campaigns have occurred in Switzerland: one in 2006 (‘Marchez et mangez malin’ – ‘Walk and eat smart’) and another in 2007 (‘Poids corporel sain’ – ‘Healthy body weight’). Although their nationwide impact on dietary intake has never been assessed, comparison between 2004–05 and 2008–09 showed no significant differences in dietary intake, with the exception of a statistically significant but nutritionally minor decrease of 40 mg/d in Ca intake (data not shown). Hence, it is unlikely that the changes observed in the present study can be attributed to public health campaigns; another possibility is that the changes induced by these campaigns are too small to be observed with our sample size. In the years 2005–2008 the annual average number of participants was lower than in other years because another cohort study was conducted relying on the same resources. Still, the study protocol and procedures remained identical and comparison of the main characteristics of the participants in the 2005–2008 surveys with those from the adjacent years (2004 and 2009) showed no major difference (data not shown). A single food composition database was used throughout the study. Although this methodology precludes the insertion of changes in food composition, still it facilitates the analysis as the changes observed cannot be attributable to a change in the food composition table. Further, changes in food composition might occur progressively (i.e. the replacement of one type of margarine by another with both types being present simultaneously in supermarkets) and no standard methodology has been proposed to account for this phenomenon. Although our semi-quantitative FFQ included three portion sizes, it is possible that some bias might arise due to participants over- or under-estimating their portions, but the magnitude of the bias cannot be established. Finally, it is currently unknown if the results observed in this mainly urban population also extend to the Swiss population. Still, and to our knowledge, the Bus Santé Geneva study is the only Swiss survey that regularly collects dietary data using population-based surveys, and other studies are urgently needed to confirm these findings. The main strengths of the study are the fact that a similar methodology was used to assess dietary intake, the long study period (11 years) and the use of representative samples of the Geneva population.
Conclusion
Between 1999 and 2009, a small decrease in total energy intake was noted in the Geneva population. Although the decrease in alcohol, SFA and cholesterol intakes is of interest, the decrease in Ca and Fe intakes may have adverse health effects in the future.
Acknowledgements
Sources of funding: The Bus Santé study is funded by the University Hospitals of Geneva and the General Directorate of Health, Canton of Geneva, Switzerland. Conflict of interest: The authors report no conflict of interest. Authors' contributions: D.A. conducted most of the statistical analyses and wrote most of the article; P.M.-V. conducted part of the statistical analysis and wrote part of the article; I.C. managed the data and conducted the initial statistical analyses; J.-M.G. revised the article for important intellectual content; I.G. collected the data and revised the article for important intellectual content. P.M.-V. had full access to the data and is the guarantor of the study. All authors have reviewed and approved the final version. Acknowledgment: The authors would like to acknowledge the work of the Bus Santé study collaborators, and particularly of Jean-Marc Theler for his precious help.


