


Excess Na consumption is a leading dietary risk factor for death and disability globally(1). High intakes of Na increase blood pressure(2), which is a major risk factor for CVD(Reference Mozaffarian, Fahimi and Singh3–Reference Strazzullo, D’Elia and Kandala5). In Hong Kong, CVD is a leading cause of death and in 2014/2015 the prevalence of high blood pressure among the adult population was 28 % (26 % for females and 30 % for males)(6). The WHO has established a global target for a 30 % relative reduction in mean population Na intake by 2025, towards the goal of 2000 mg/d per person(2). Despite this, most populations globally continue to exceed this recommendation(2,Reference Mozaffarian, Fahimi and Singh3,Reference Liu, Ho and Tang7,Reference Woo8) . In Hong Kong, the estimated average Na intake across the adult population is 3520 mg/d(9), and more than 60 % of adults exceed the WHO recommended Na limit(10).
Many countries around the world have developed and initiated strategies to achieve the WHO goal target for Na(Reference Trieu, Neal and Hawkes11). In Hong Kong, a number of Na-reduction strategies have been implemented, including a nutrition labelling scheme for pre-packaged foods(12) and the release of voluntary Na reduction targets for bread(9). Moreover, national-level dietary guidelines worldwide commonly recommend reducing discretionary salt use and limiting high Na ingredients during food preparation and at the table(Reference Trieu, Neal and Hawkes11), as well as encouraging consumers to utilise nutrition labels to select lower Na alternatives(Reference Elfassy, Yi and Eisenhower13). While individual efforts to reduce Na intake are important, it is likely to be more effective for highly motivated people(Reference Campbell, Johnson and Campbell14). Moreover, individual efforts are likely undermined by the saturation of high Na-containing pre-packaged foods in the food supply, which are the leading source of dietary Na in many countries(Reference Ha15,Reference Brown, Tzoulaki and Candeias16) . Therefore, through product reformulation, it is expected that the food industry should be able to play a key role in achieving improvements to population Na intake.
In the UK, the Food Standards Agency (FSA) has worked with the food industry since 2006 to establish voluntary Na reduction targets for processed foods. By 2011, this resulted in a 7 % reduction in the overall mean Na levels of processed foods(Reference Eyles, Webster and Jebb17) and has partly contributed to the 15 % decrease in the average salt intake from 9·5 to 8·1 g/d in the UK population between 2001 and 2011(Reference He, Brinsden and MacGregor18,Reference Hyseni, Elliot-Green and Lloyd-Williams19) . While average consumption of Na still remains higher than the WHO guideline, it highlights the importance and efficacy of product reformation through setting Na targets for pre-packaged foods.
Data from other countries suggest that Na levels vary considerably within food categories(Reference Arcand, Au and Schermel20,Reference Webster, Dunford and Neal21) . Such wide variabilities imply potential feasibility to reformulate those pre-packaged products to reduce their Na content. Hong Kong is a cosmopolitan city whose food supply contains both locally produced and overseas-imported pre-packaged foods. However, there has been no study carried out to date on the Na content of pre-packaged food in the Hong Kong food supply. This has made it difficult for the government and food industry to establish reformulation targets for Na, as it is unclear what levels would be appropriate, as well as which categories and specific pre-packaged foods should be prioritised.
The primary aim of this paper is to assess the Na concentration of pre-packaged foods in Hong Kong and to identify the food categories that contain the highest Na concentration. The secondary aim is to determine the proportion of products classified as low Na or as high Na as stipulated by the current Food and Drugs (Composition and Labelling) Regulations in Hong Kong(22).
Method
Data source and collection
The 2017 Hong Kong FoodSwitch database was used to obtain food product information used for the present study. To our knowledge, this is the only pre-packaged food database with nutrient information available in Hong Kong. This database contains information about all pre-packaged foods and beverages that were available for sale during a cross-sectional store survey in June 2017. Using a non-probabilistic approach, three megastores were selected from each of the three major supermarket chains in Hong Kong, namely AEON (selling a wide range of popular Japanese imported products), ParknShop and Wellcome (selling a wide range of local and imported groceries including those from typical local household brands). The largest megastore (based on information provided by the supermarket) of each chain was selected due to the wide range of products available for collection at these stores. The stores were located in different geographic areas including New Territories East (ParknShop), Hong Kong Island West (Wellcome) and Hong Kong Island East (AEON) – all of which are affluent areas. These chains each have several stores open for business in Hong Kong, including more than 300 stores for ParknShop, more than 240 stores for Wellcome and twelve stores for AEON. Together, these supermarket chains account for about 60 % of the market share for pre-packaged foods in Hong Kong(23). The remaining 40 % are small retailers, internet stores and others. Data were collected from trained research assistants who obtained several photographs of each product including the barcode, the front of package and the nutrition information panel using a bespoke smartphone application.
Data entry and processing
For each food and beverage, the brand name, product name and barcode were recorded into FoodSwitch according to the information displayed on the pack. Nutrition information was obtained directly from the nutritional information panel and included information regarding the nutrient content per 100 g or per 100 ml and per serving for all macro-and micro-nutrients listed including Na. Automatic conversion to Na concentration per 100 g or per 100 ml was performed if the Na content was displayed per serving or per package. In addition, manual conversion of Na concentration in milligrams was carried out if the Na concentration was displayed in grams. Where salt in gram was reported on the pack, the amount of salt in grams was multiplied by 40 %, followed by multiplication of 1000 to convert into milligrams of Na.
Product categorisation and exclusion criteria
Products were categorised based on the food categorisation system developed by the George Institute for Global Health(Reference Dunford and Neal24). This food categorisation system classifies products into twenty food groups. Several food groups, namely non-food (n = 1), special food (n = 310) and unable to be categorised (n = 40) were excluded, leaving fourteen food groups for the final analysis. Due to the presence of multiple nutritional information panels, variety packs with multiple flavours were excluded. Products were also excluded if they displayed incomplete nutrition information, nutritional information panels only in a foreign language and/or a suspected incorrect Na value (Fig. 1). Where the same product was available in more than one store or where the same product was available in different pack sizes, only one product was retained.
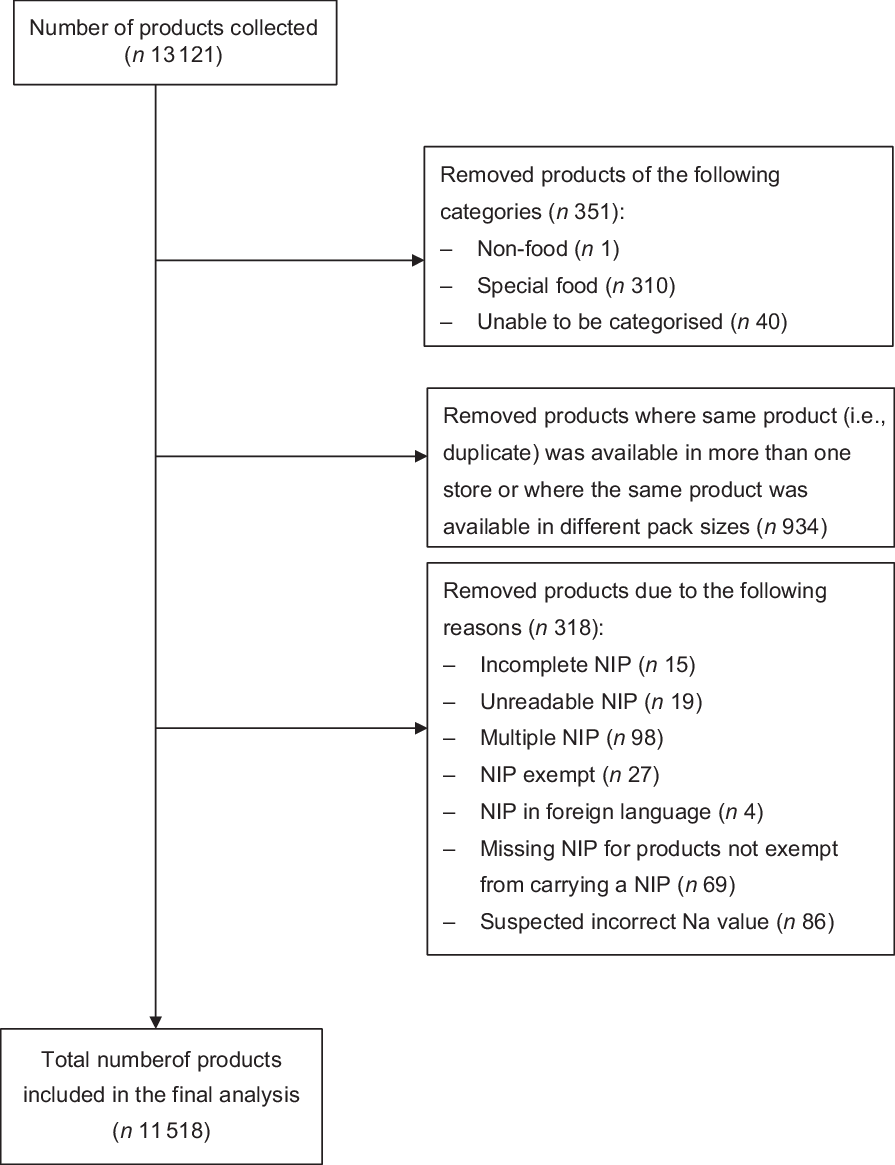
Fig. 1 Flow chart of the exclusion criteria and selection of packaged foods included in the analysis. NIP, Nutrition Information Panel
Serving size information
To enhance the public health relevance, we analysed the Na concentration in a ‘typical serving’ of a food or beverage. As there is no standard portion size for each of the food groups analysed, we calculated the median Na concentration in a typical serving, that is, Na (mg/100 g or mg/100 ml)/100 × typical serving (g or ml)(Reference Coyle, Ndanuko and Singh25). The typical serving size was calculated by taking the most common serving size listed on the nutrition information panel for each of the fourteen food groups.
Definition of low and high sodium
Using the Food and Drugs (Composition and Labelling) Regulations in Hong Kong, the proportion of products in each food group meeting the definition of low Na (i.e., <120 mg/100 g or mg/100 ml) and high Na (i.e., >600 mg/100 g or mg/100 ml) was calculated and reported.(22)
Data analysis
Data were analysed using SPSS (version 25; IBM Corporation) in 2018–2019. Median, interquartile range and overall range of Na (mg) concentration were calculated and reported per 100 g or per 100 ml and per typical serving size.
Results
Of the 13 121 products collected and recorded in the FoodSwitch database, 351 products from three food groups (non-food, special food and unable to be categorised) were excluded, 934 products were excluded for having the same nutritional information but in different package sizes and 318 products were excluded for various reasons, with the top three reasons being the presence of multiple nutritional information panels (n = 98), suspected incorrect Na values (n = 86) and missing nutritional information panels for products not exempt from carrying this information (n = 69) (Fig. 1). As a result, 11 518 products from fourteen food groups were included in the analysis. Of these 14 food groups, products were further classified into fifty-eight food categories, 124 major subcategories and 26 minor subcategories.
Median sodium concentration
Overall, the three food groups with the highest median Na concentration (mg/100 g or mg/100 ml of food/beverage) were sauces, dressings, spreads and dips (median 1180, IQR 446–3520), meat and meat products (median 800, IQR 632–1068) and snack foods (median 650, IQR 453–926) (Table 1). In contrast, edible oils and oil emulsions (median 0, IQR 0–4), sugars, honey and related products (median 6, IQR 0–14) and non-alcoholic beverages (median 10, IQR 1–34) were the food groups with the lowest median Na concentration (Table 1). Overall, there was a wide variation in the Na concentration within most food categories. For example, the Na concentration (mg/100 g) of processed meat ranged from 60 to 5300, canned fish ranged from 84 to 6400 and flavoured noodles ranged from 256 to 7930 (see online supplementary material, Supplemental Table S1).
Table 1 Sodium concentration (mg/100 g or mg/100 ml) of pre-packaged foods in the Hong Kong food supply in 2017
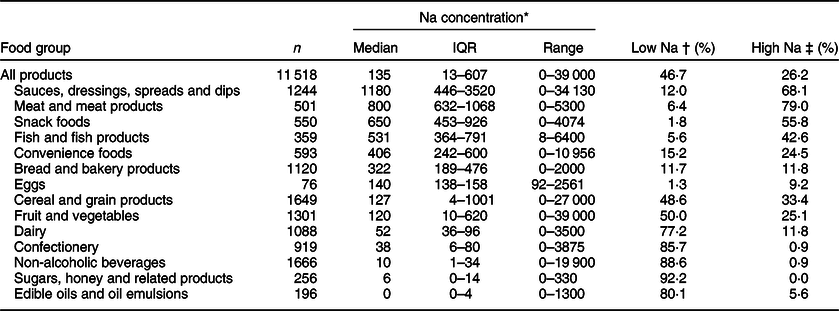
IQR, interquartile range.
Table rows sorted in descending order by median Na concentration, by food category.
* Units for Na concentration include both mg/100 g for foods and mg/100 ml for beverages.
† Threshold value for low Na: Na concentration <120 mg/100 g or mg/100 ml of food/beverage.
‡ Threshold value for high Na: Na concentration >600 mg/100 g or mg/100 ml of food/beverage.
Median sodium concentration per typical serving size
Across all foods and beverages, the most common serving size reported on the nutrition information panel was 100 g or 100 ml (Table 2). This ranged from 15 g for sauces, dressings, spreads and dips and edible oils and oil emulsions, up to 100 g for fish and fish products, convenience foods, fruit and vegetables, dairy and non-alcoholic beverages. Overall, the three food groups with the highest median Na concentration per typical serving size (mg per serving) were fish and fish products (median 531, IQR 364–791), meat and meat products (median 444, IQR 351–593) and convenience foods (median 406, IQR 242–600) (Table 2). In contrast, edible oils and oil emulsions (median 0, IQR 0–1), sugars, honey and related products (median 1, IQR 0–3) and non-alcoholic beverages (median 10, IQR 1–34) were the food groups with the lowest median Na concentration per typical serving size (Table 2).
Table 2 Sodium concentration (mg/per serving) across food categories in the Hong Kong food supply in 2017
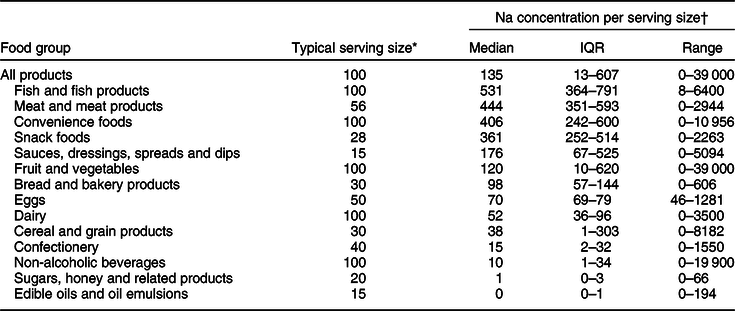
IQR, interquartile range.
Table rows sorted in descending order by median Na concentration per serving, by food category.
* The typical serving size (g) is the most frequent serving size reported on packs within each food category.
† Units for Na concentration include both mg per serving (g or ml).
Comparison against low and high sodium definitions
In comparison with the Hong Kong Food and Drugs Composition and Labelling Regulations, just under half (46·7 %) of pre-packaged food products analysed met the low Na definition and slightly more than a quarter (26·3 %) met the high Na definition. The food groups with the highest proportion of products classified as high Na were meat and meat products (79 %); sauces, dressings, spreads and dips (68·1 %); snack foods (55·8 %); fish and fish products (42·6 %) and cereal and grain products (33·4 %) (Table 1).
Discussion
The current study comprehensively examined the Na concentration of pre-packaged foods available for sale in Hong Kong. Our findings can serve as a baseline to assess the impact of Na-related initiatives in Hong Kong on changes to the pre-packaged food supply. In other countries, including Australia and the UK, regular monitoring of the Na in the food supply has been undertaken for many years by government and other research groups(Reference Sacks, Mialon and Vandevijvere26–Reference Tedstone, Nicholas and Clark29). Such evaluations are frequently used to assess the effectiveness of both government and non-government Na reduction initiatives and are often evaluated at both the food group and food company level(Reference Sacks, Mialon and Vandevijvere26–Reference Tedstone, Nicholas and Clark29).
Among the fourteen food groups analysed, sauces, dressings, spreads and dips had the highest Na concentration per 100 g or per 100 ml. This is consistent with prior research conducted in the UK using the same food group categorisation system as used in the current study(Reference Webster, Dunford and Neal21). The high Na concentration was largely driven by Asian sauces, which is disconcerting given these sauces are commonly consumed in Hong Kong(10). However, across all sauces, dressings, spreads and dips, the typical serving size was only 15 ml (much less than other categories), and therefore, the total contribution of these products to total Na intakes is much less of a concern. In fact, fish and meat products had the highest Na concentration across all food groups when serving size was accounted for. Although these foods are often nutrient rich, the Na content in a typical serving accounted for over 20 % of the WHO maximum Na limit(2). As such, our findings highlight the possibility that those who frequently consume high Na fish and meat products including anchovies, bacon and dried meat could be at increased risk of exceeding their recommended daily intake of Na.
Similar to prior research in other countries(Reference Arcand, Au and Schermel20,Reference Webster, Dunford and Neal21,Reference Ni Mhurchu, Capelin and Dunford30) , the Na concentration of products within the same food category varied considerably, highlighting the potential impact for reformulation. Targeting reformulation towards foods and beverages with a wide range in Na content should be the priority, as this suggests it is technologically feasible to reduce Na levels. In the current study, the food categories with the highest variability in Na included bread, canned fish, flavoured noodles and processed meat. Moreover, only a small portion of products in these four categories were low in Na. Furthermore, flavoured noodles and processed meat had 95 and 83 % of all products meeting the high Na definition, respectively, highlighting the need to lower the Na content in these foods.
Reformulation has been carried out worldwide as reflected by the growing emergence of low Na and reduced Na products(Reference Zandstra, Lion and Newson31). Since 2017, food manufacturers in Hong Kong have been allowed to place a ‘low salt’ or ‘no salt’ logo on their products if the Na level does not exceed 120 or 40 mg/100 g or mg/100 ml, respectively(32). The results in the present study show that about 50 and 25 % of pre-packaged foods were low and high in Na, respectively. However, many of the products included in the current analysis are naturally low in Na, including plain rice, confectionery, milk, sugars, honey, jam and cooking oils. As such, our results are biased towards an overestimation in the proportion of low Na products on the market. Nonetheless, it is disconcerting that there is still a considerable proportion of foods on the market that is high in Na.
Reducing the Na content in packaged foods is not without constraints. Na serves a functional purpose as a preservative(Reference Jaenke, Barzi and McMahon33) and contributes to the sensory and quality properties of food(Reference Buttriss34). For this reason, some food categories may face more technological challenges when reducing the Na content(Reference Buttriss34). For example, the shelf life of meat and meat products may be shortened as a result of potential Na reduction due to its preservation properties(Reference Buttriss34). Moreover, reduced consumer acceptability towards products containing less Na and subsequently lower sales volume may be a concern for food manufacturers and may contribute to a reluctance to reformulate. However, research to date suggests that reducing the Na content of bread and processed meat does not result in lowered consumer acceptability(Reference Jaenke, Barzi and McMahon33,Reference Belz, Ryan and Arendt35) . Regardless, it is recommended that manufacturers gradually reduce Na levels in their products to increase acceptability amongst consumers(Reference Jaenke, Barzi and McMahon33,Reference Buttriss34) . Ideally, reasonable targets for manufacturers with a grace period for implementation should be considered in the development of any government targets.
To our knowledge, this is the first study to comprehensively analyse the Na content of a large sample of pre-packaged foods sold in Hong Kong. To date, studies on the Na concentration of foods in Hong Kong have been limited by small samples sizes and analyses across specific food categories(36,Reference Coyle37) . Our study substantially adds to the prior literature through the use of a large nutrition dataset that utilises a standardised method for obtaining nutrition information from products available from major supermarket chains in Hong Kong. This provided us with a reliable dataset across a comprehensive range of products and a large sample size to assess the Na concentration of products within and across food groups. Our analysis of Na concentration per 100 g or per 100 ml and per serving allowed us to consider the findings within the broader context of reformulation as well as public health by considering what would be consumed in a typical serving.
However, there are some limitations in the current study. Firstly, the Na content was solely obtained from nutrition information labels affixed on pre-packaged foods instead of determined by chemical analysis. However, this is the most reliable and economic means to obtain nutritional information secondary to conducting laboratory tests, especially for a comprehensive coverage of the pre-packaged food supply. Products were categorised according to universal pre-defined categories which may have not been developed to be adequately country- and culturally sensitive. However, efforts were made to match products to the most appropriate food group. We also made small adjustments to account for cultural preferences, for example, the food group ‘eggs’ was not included in previous analyses in western countries(Reference Webster, Dunford and Neal21) because eggs are naturally low in Na and are not a major source of Na intake. However, some eggs sold in Hong Kong are preserved, such as century eggs, which contain considerable amounts of Na and are a popular food, and therefore, ‘eggs’ were included in our analysis. Lastly, pre-packaged foods were collected from a convenience sample of three supermarket megastores, and therefore, it is unlikely we have complete coverage of all pre-packaged products sold in Hong Kong. For example, other food stores, such as convenience stores, cater to different markets and may sell a different variety of products as compared with supermarkets, such as a more diverse range of ready-to-eat convenience foods, beverages and snacks. Nevertheless, data were collected from the largest branches of the supermarket chains, and it is likely the dataset is broadly representative of products available for sale in Hong Kong.
To date, there has been limited research examining which food categories contribute most to Na intakes in Hong Kong. Previous government estimates have relied on the Total Diet Study approach, which involves analysing small samples of commonly consumed foods in Hong Kong to obtain nutrient information(10,38) . The results are then combined with population-based food intake data based a food consumption survey. However, as only a limited number of products were sampled for Na information, it is likely this method under-estimates Na intake(10). Future research is required to more accurately estimate the contribution of food categories to population Na intakes in Hong Kong in order to provide further insight into which food categories should be targeted as part of Na reduction initiatives(Reference Bhat, Marklund and Henry39).
Conclusion
Reducing the Na concentration of pre-packaged food is a challenging issue globally. The large variations in Na content found in the current study demonstrate considerable potential and feasibility for the food industry to reformulate to reduce Na levels. Currently, food categories such as flavoured noodles, processed meat, canned fish and bread should be the priority for reformulation to improve the food supply in Hong Kong to help reduce population Na intake.
Acknowledgements
Acknowledgements: None. Financial support: None. Conflict of interest: None. Authorship: J.C.Y.L. supervised. A.S.C.W. conceived and designed the study. A.S.C.W. and D.H.C. conducted the study and analysed the data. All authors were involved in data interpretation and critically reviewed and provided written comments on the final manuscript. Ethics of human subject participation: No human participants were involved.
Supplementary material
For supplementary material accompanying this paper visit https://doi.org/10.1017/S1368980020002360.


