


Undernutrition is a serious public health problem with important consequences for survival, cognitive development and optimum physical growth( Reference Black, Victora and Walker 1 – Reference Victora, Adair and Fall 3 ). It is also considered one of the causes of non-communicable diseases, morbidity, and decreased economic productivity and earning potential( Reference Black, Victora and Walker 1 , Reference Pelletier, Frongillo and Habicht 4 , Reference Pelletier and Frongillo 5 ). These problems tend to be severe among children younger than 5 years and women of reproductive age, particularly in developing countries struggling to emerge from the scourge of extreme poverty( 6 ). Undernutrition causes 3·1 million child deaths annually, accounting for 45 % of total child deaths in 2011( Reference Black, Victora and Walker 1 , Reference Bhutta, Das and Rizvi 7 ). Although the global prevalence of undernutrition is continuing to reduce in both children and women, most progress has been made in South-East Asia including Bangladesh, in comparison with slow progress in sub-Saharan Africa( Reference Bredenkamp, Buisman and Van de Poel 8 – Reference Tzioumis, Kay and Bentley 10 ). Similarly, overnutrition (overweight or obesity) is also a public health concern because overweight children are at greater risk of developing many health problems, like overweight adults, such as heart disease, respiratory illness and type 2 diabetes( Reference Ebbeling, Pawlak and Ludwig 11 ). Moreover, overnutrition has a negative effect on children’s social and emotional well-being and self-esteem, resulting in impaired social development.
Bangladesh has been commended worldwide for its recent gains in health and nutrition. The prevalence of childhood stunting (low height-for-age) and underweight (low weight-for-age) has decreased from 63 and 62 % in 1990 to 42 and 32 % in 2013, respectively( 12 ). The prevalence appears to be lower than in Pakistan (which had stunting and underweight prevalence of 45 and 32·6 %, respectively, in 2012), but still higher than in India (39 and 29 %, respectively, in 2014)( 12 ). Despite more than a decade of intervention and great socio-economic development, however, Bangladesh still has a large number of children with stunting (6 million) and wasting (2·4 million)( Reference Victora, Requejo and Barros 13 ). In the review of the Millennium Development Goals, the country was criticized for not focusing on nutrition issues appropriately and it failed to achieve the Millennium Development Goal 1 target of child underweight prevalence of 31 % by 2015( 14 , Reference Sack 15 ). Similarly, the prevalence of women with underweight (BMI<18·5 kg/m2) has decreased from 53 % in 1996 to 19 % in 2014. However, the rate is not lower than those of neighbouring countries, such as India, Nepal and Pakistan( 12 ). In developing countries like Bangladesh, overweight or obesity is also a growing concern. In Bangladesh, the proportion of women with overweight (≥25·0 kg/m2) has increased from 3 % in 1996 to 24 % in 2014( 14 ). The rate of increase is faster than in India (10·6 % in 1999 to 20·2 % in 2016) and Nepal (9·0 % in 2006 to 22·0 % in 2016)( 16 – Reference Meshram, Balakrishna and Sreeramakrishna 19 ). The most recent public health concern is childhood overweight or obesity because the prevalence has increased at an alarming rate, particularly in urban areas( Reference Bleich, Vercammen and Zatz 20 ). Thus, identifying the reasons behind the slow progress of undernutrition and the drastic increase of overnutrition prevalence has become a challenge for public health researchers. Studies conducted in the last decade have identified maternal education, socio-economic status, short birth spacing, food insecurity and low birth weight as potential factors associated with undernutrition( Reference Islam, Rahman and Mahalanabis 21 – Reference Rahman, Howlader and Masud 25 ).
Over the last decade, Bangladesh has demonstrated significant improvement on each of these fronts; nevertheless, progress might not be the same for all regions of the country( Reference Mohsena, Goto and Nicholas Mascie-Taylor 26 ). For instance, urban people are in better condition concerning many sociodemographic aspects compared with their rural counterparts, where about 75 % of the population resides( 27 ). Therefore, it is essential to scrutinize the regional variation and identify the regions (districts) with high prevalence where imperative actions are required for quick improvement. Similarly, studies have indicated that the most common factors associated with overnutrition (overweight or obesity) are the imbalance between food intake and energy expenditure and low physical activity( Reference Wyatt, Winters and Dubbert 28 , Reference Deurenberg, Yap and Van Staveren 29 ). However, food habits and types of physical activity vary across the regions of the country, particularly between urban and rural areas. Therefore, it is also necessary to identify the regions with high prevalence of overweight or obesity for designing interventions to prevent overweight or obesity.
Bangladesh is the seventh most populous country in the world with a population of 164 million and is projected to be the eighth most populous (202 million) by 2050( 30 ). Administratively, the country is divided into division (n 8), district (n 64), upazila (n 489)/thana (n 631) and union (n 4553)( 27 ). Notwithstanding the recent robust annual growth in gross domestic product, averaging 6 % per annum between 2011 and 2013( 31 ), the country remains one of the poorest in the world with 32 % (rural 52 %, urban 22 %) of the population living below the poverty line of $US 1·25 per day( 27 ). The country has characteristics similar to a typical developing nation with high unemployment rate (29 %) and highly skewed income inequality( 27 , 32 ). Twenty per cent of the richest among the population owns about 42 % of the wealth, while the poorest 20 % of the population owns 9 % of the wealth( 33 ). Besides, the distribution of rich and poor is not the same for all regions of the country as a majority of rich people live in urban areas in comparison with their rural counterparts( 33 ).
Bangladesh is unique among low- and middle-income countries in having valid and nationally representative household survey-based statistical evidence for only national and divisional levels; there are very limited statistics or data available for sub-division or district level. Additionally, research conducted to assess the regional inequalities in health and nutrition has been very limited. The issue of geographical differences in undernutrition as well as overnutrition has emerged as a matter of concern considering growing evidence of the strong persistence of existing inequalities( Reference Bredenkamp, Buisman and Van de Poel 8 , Reference Spray, Eddy and Hipp 34 ). However, national analyses, although useful, have little programmatic value for advocacy because they fail to highlight the extent of geographical inequalities that is essential for designing appropriate interventions and policies on nutrition and health. Thus, the focus of the present study was to investigate the nutritional status of women and children at the district level to identify the vulnerable districts and to understand the full extent of geographical and social inequalities in relation to sociodemographic variables. We also analysed data about maternal demographic factors to understand the social determinants of both under- and overnutrition. The findings from the study will help policy makers design appropriate policies and programmes to reduce the burden of under- and overnutrition and to achieve Sustainable Development Goal 2.2.
Materials and methods
Study design and participants
The data for the present study were extracted from the 2014 Bangladesh Demographic and Health Survey (BDHS) conducted between July and November 2014. The BDHS is based on a two-stage stratified cluster sampling scheme to provide a representative sample of Bangladesh as a whole. In the first stage, 600 enumeration areas (EA), the primary sampling units or clusters, were selected from the list of EA provided by the Bangladesh Bureau of Statistics with probability proportional to EA size, which ensured 207 EA in urban areas and 393 EA in rural areas. In the second stage of sampling, a systematic sample of approximately thirty households was selected per cluster or primary sampling unit. Details of the sampling design are available in the main BDHS report( 14 ). A total of 18 245 ever-married women of childbearing age were selected for the survey and finally 17 863 were interviewed. Among them, 10 930 did not have any children younger than 5 years and hence were excluded from the analysis. We also excluded 320 women who had given birth in the two months preceding the survey. A total of 6933 children aged 0–59 months and their mothers aged 15–49 years were included in the analysis.
Definition of variables
Dependent variables
Stunting (low height-for-age), wasting (low weight-for-height) and overweight (high weight-for-height) were considered the outcome variables for children. The first two were used to define undernutrition; the last one to define overnutrition. Underweight (low weight-for-age) is also often considered an undernutrition indicator among children; however, weight-for-age is a composite index of height-for-age and weight-for-height and thus is well captured by stunting and wasting. Therefore we did not use underweight for children. Z-scores for each of the anthropometric indices were calculated using the median of the reference population in the 2006 WHO child growth standards( 35 ). Children with Z-score for height-for-age below –2 were classified as stunted. Similarly, children with Z-score for weight-for-height below −2 or above +2 were considered wasted or overweight, respectively. For women, the outcome variables were underweight and overweight. Women with BMI<18·5 kg/m2 and BMI≥25·0 kg/m2 were considered underweight and overweight, respectively( 36 ).
Independent variables
The socio-economic and demographic information of the children and women were considered as independent variables. These included age, sex, residence (rural, urban), mother’s education (years of schooling: none, 1–5 years, 6–9 years, ≥10 years), mother’s BMI (underweight if BMI<18·5 kg/m2), membership of any non-governmental organization (yes, no) and wealth index (poor, poorest, middle, rich and richest). The wealth index was calculated, as described in the BDHS 2014 report( 14 ), using principal component analysis of assets owned by households( Reference Filmer and Pritchett 37 , Reference Rutstein and Johnson 38 ). The score was then divided into five equal quintiles, with the first representing the poorest 20 % and the fifth representing the richest 20 %( Reference Vyas and Kumaranayake 39 , Reference Howe, Hargreaves and Huttly 40 ). More details are available elsewhere( 14 ).
Statistical analyses
As a bivariate analysis, the prevalence of under- and overnutrition in both children and women (assessed by the four indicators mentioned above), with 95 % CI, was estimated according to each of the individual-level predictors. A simple logistic regression model was performed to assess the association of under- and overnutrition with each of the background characteristics, separately; only the P value from the likelihood ratio test of the model is reported to determine the significance of the association. All these analyses were performed controlling for the effect of the complex survey design using Stata’s ‘SVY’ command. Further, three different multivariable logit models for each nutrition indicator with all predictors (background factors) found to be significant in the simple logistic regression analyses were fitted, to assess the net association of each predictor with the outcome controlling for the effects of other predictors and to estimate the district-level prevalence of under- and overnutrition. Model 1 is a standard logit model with individual-level predictors. Model 2 is a multilevel logit model with individual-level predictors in the first level and district-level independently and identically distributed random effects in the second level. Model 3 is also a multilevel logit model with individual-level predictors in the first level, district-level both spatial (structured) and random effects on the second level. The reason for introducing a random effect in Model 2 was to capture the unobserved heterogeneity between the districts. The neighbouring structure at the district-level Bangladesh lattice motivated us to extend Model 2 to Model 3 by adding another random effect to capture the unobserved variations due to the district-level spatial structure. To introduce the spatial effects in Model 3, we used the intrinsically conditional autoregressive modelling approach( Reference Besag 41 ) with hierarchical specification at the second stage( Reference Banerjee, Carlin and Gelfand 42 ). We estimated the models’ parameters within the Bayesian framework with non-informative prior using the integrated nested Laplace approximation approach for summarizing the posterior distributions. Finally, the fitted model was used to predict the posterior probability of under- and overnutrition for an individual in a district. The district-level prevalence of under- and overnutrition was then estimated as the weighted average of the individual-level predicted probabilities, weighted by the individual sampling weights calculated based on the BDHS 2014 survey design, with 95 % CI( 14 ). The statistical software package Stata for Windows version 14.2 and the statistical software R version 4.3.1 were used for all analyses.
Results
Nutritional status of the children
Table 1 shows the prevalence of child under- and overnutrition with 95 % CI. Overall, the prevalence of stunting, wasting and overweight among the children aged <5 years was 36·2, 14·3 and 1·3 %, respectively. Children from the lowest socio-economic condition were more likely to be malnourished (stunting: 49·4 v. 19·5 %; wasting: 17·0 v. 11·8 %) compared with children from the highest socio-economic condition. By age gradient, stunting prevalence increased with child age and the opposite was observed for wasting, which is consistent with many other surveys in different countries( Reference Kandala, Madungu and Emina 43 – Reference Mengistu, Alemu and Destaw 45 ). Undernutrition in children was significantly negatively associated with maternal education. A similar negative association was found for maternal height, place of residence of the household and mother’s age at first birth. In contrast, overweight was positively associated with the level of maternal education and socio-economic condition, and its prevalence was higher in urban areas compared with rural areas.
Table 1 Prevalence (%) of undernutrition (stunting and wasting) and overnutrition (overweight) by sociodemographic variables among children aged 0–59 months (n 6933), Bangladesh, 2014
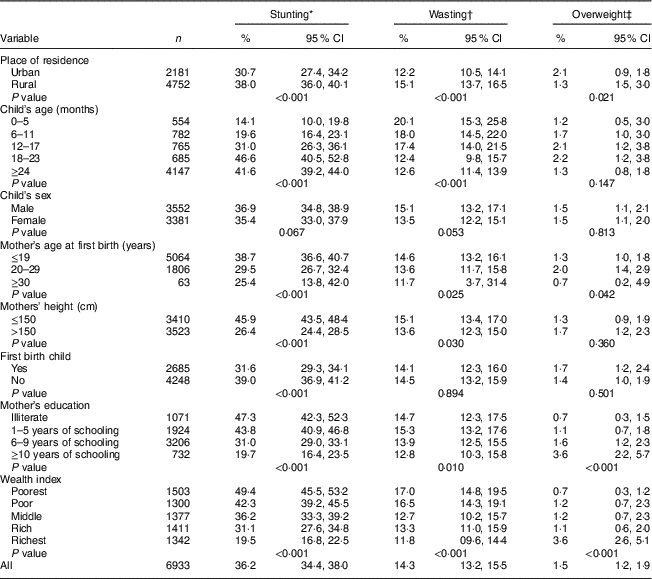
* Stunting defined as low height-for-age.
† Wasting defined as low weight-for-age.
‡ Overweight defined as high weight-for-age.
Nutritional status of the mothers
Table 2 shows that more than one-fifth (22·0 %) of the study respondents (women of reproductive age) were underweight and 18·2 % were overweight. Underweight prevalence was comparatively high among the adolescents (age 15–20 years) and overweight prevalence among the women aged 30–39 years. Rural women were more likely to be underweight (24·2 %) than urban women (15·6 %), whereas urban women were twice as likely to be overweight or obese compared with rural women (30·0 v. 14·3 %, respectively). Maternal underweight was negatively associated with level of educational attainment, household socio-economic condition and age at first birth. In contrast, maternal overweight was positively associated with level of education and socio-economic condition, and its prevalence was comparatively low among women having membership of a non-governmental organization compared with non-members.
Table 2 Prevalence (%) of underweight and overweight according to sociodemographic variables among mothers aged 15–49 years (n 6933), Bangladesh, 2014
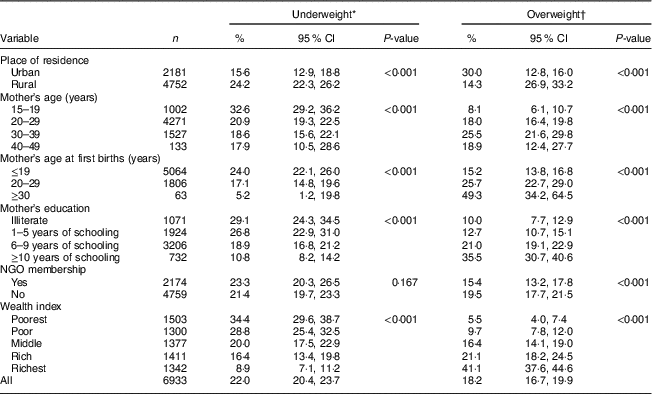
NGO, non-governmental organization.
* Underweight defined as BMI<18·5 kg/m2.
† Overweight defined as BMI≥25·0 kg/m2.
Multivariable spatial model
As discussed earlier, three different models were fitted to each of the outcome measures with the aim of comparing between the models to identify the best one for estimating the district-level prevalence of under- and overnutrition with 95 % credible interval. Model 1 is the standard model with only individual-level predictors; Model 2 consists of the district-level clustering effect in addition to individual-level predictors; and Model 3 is the extension of Model 2 with additional spatial (neighbouring) effects. We compared the models based on their deviance information criterion to identify the best one with the smallest value. The results (not shown) revealed that Model 3 appeared the best. In addition, the significance of spatial effects (measured using estimated structured variance which is significantly higher than zero) suggested that Model 3 is an appropriate choice for estimating district-level prevalence after adjusting for the individual-level predictors. Therefore, we have summarized the results from Model 3.
Children’s under- and overnutrition status
The results from Model 3 (Table 3) revealed that mother’s education, height and age at first birth and household socio-economic condition were significantly associated with each of the nutritional indicators (stunting, wasting and overweight). For example, the negative value of the coefficients (log odds ratio) for mother’s education relating to stunting or wasting suggests that increasing level of education decreased the odds of being stunted or wasted, and the positive value relating to overweight suggests that decreasing level of education increased the odds of being overweight. Similarly, mother’s height and socio-economic condition were negatively associated with stunting and wasting, and positively associated with childhood overweight. Furthermore, child’s age was positively associated with stunting and negatively associated with wasting and overweight. Child’s sex showed no significant association with over- and undernutrition.
Table 3 Adjusted associations between undernutrition (stunting and wasting) and overnutrition (overweight) and sociodemographic variables among children aged 0–59 months, Bangladesh, 2014Footnote *
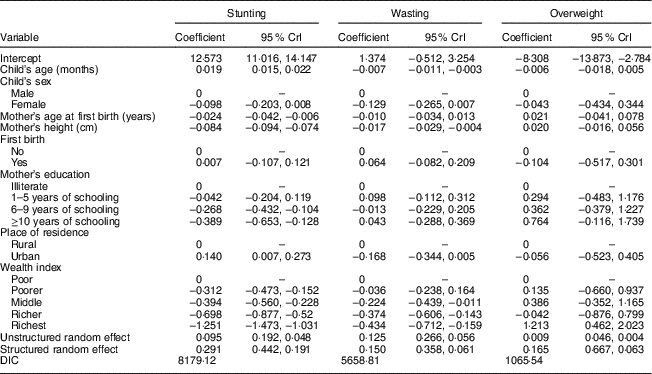
CrI, credible interval; DIC, deviance information criterion.
* Spatial model adjusting for both the district-level clustering and spatial (neighbouring) effects in addition to individual-level risk factors.
Women’s under- and overnutrition status
Table 4 shows the associations between women’s nutritional status (underweight and overweight) and their individual- and household-level covariates. After adjusting for other covariates, household socio-economic condition and mother’s education, age and age at first birth were negatively associated with underweight and positively associated with overweight. Women from wealthy households were more likely to be overweight and less likely to be underweight than those from poorer households. Similarly, the likelihood of being underweight was higher among young women than older ones; and the opposite scenario was observed for overweight. Although membership of a non-governmental organization was found to be significantly associated with over- and undernutrition, it was insignificant when adjusting for the other factors in the multivariable model.
Table 4 Adjusted associations between undernutrition (BMI<18·5 kg/m2) and overweight (BMI≥25·0 kg/m2) and sociodemographic variables among mothers aged 15–49 years, Bangladesh, 2014Footnote *
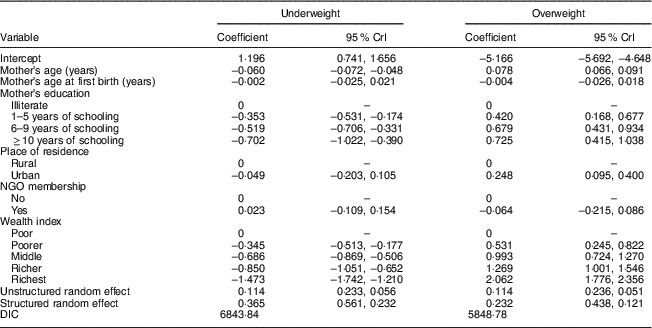
CrI, credible interval; NGO, non-governmental organization; DIC, deviance information criterion.
* Spatial model adjusting for both the district-level clustering and spatial (neighbouring) effects in addition to individual-level risk factors.
Mapping the prevalence of children’s under- and overnutrition
Figure 1 presents the district-level estimated posterior prevalence (obtained from individual-level predicted posterior probability from the model) of stunting, wasting and overweight among children aged<5 years. Stunting prevalence in Bangladesh’s districts ranged from 20·3 % in Jessore to 56·2 % in Sunamganj and wasting prevalence ranged from 10·6 % in Dhaka to 19·2 % in Bhola. For child overweight, Shariatpur district (0·8 %) had the least proportion and Dhaka district (2·6 %) had the highest proportion. The map shows that stunting and wasting were more prevalent in the districts of the north-east border of Bangladesh under Sylhet division, and in the Cox’s Bazar district (coastal zone) and hilly districts of Chittagong division. There was very low variability observed in the prevalence of children with overweight between the districts; however, industrially more advanced districts had somewhat more overweight children.
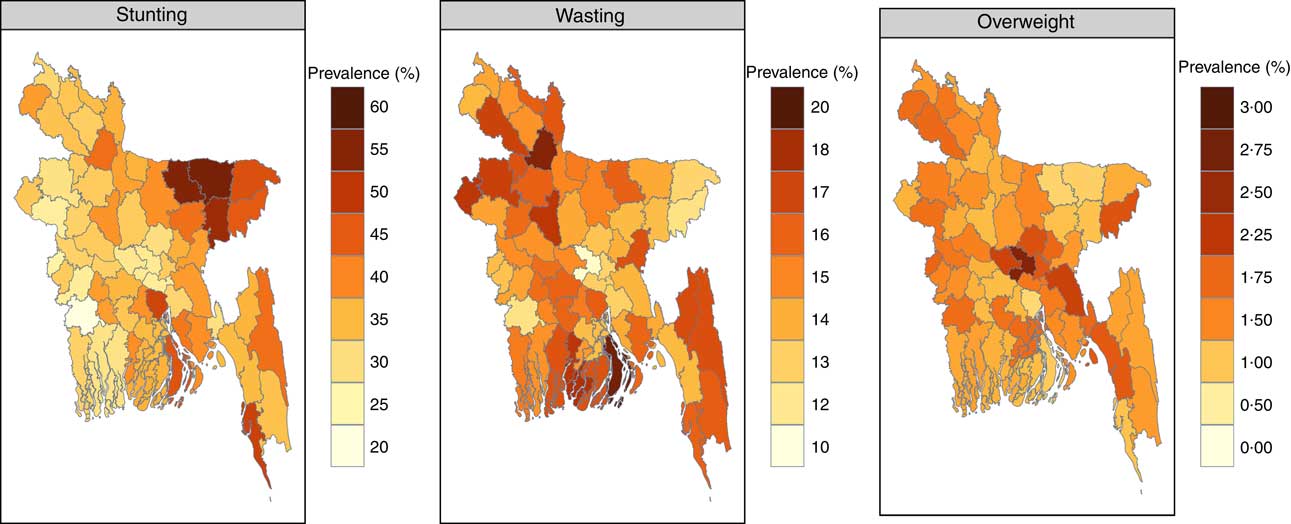
Fig. 1 (colour online) Posterior prevalence of stunting, wasting and overweight among children aged 0–59 months from a Bayesian spatial model, Bangladesh, 2014
Mapping the prevalence of women’s under- and overnutrition
Figure 2 shows the posterior prevalence of women with underweight and overweight obtained from a Bayesian spatial model. The underweight prevalence ranged from 10·1 % in Dhaka to 36·2 % in Shariatpur. The districts of Sylhet division were observed to have the highest underweight prevalence while Dhaka and Rajshahi districts were found to have the lowest prevalence. Maternal overweight was least prevalent in Netrokona district (6·2 %), whereas the prevalence was highest in Dhaka district (38·6 %). Women in some districts of Dhaka and Chittagong divisions were more likely to overweight, whereas women in most of the districts from Rangpur division were less likely to be overweight.
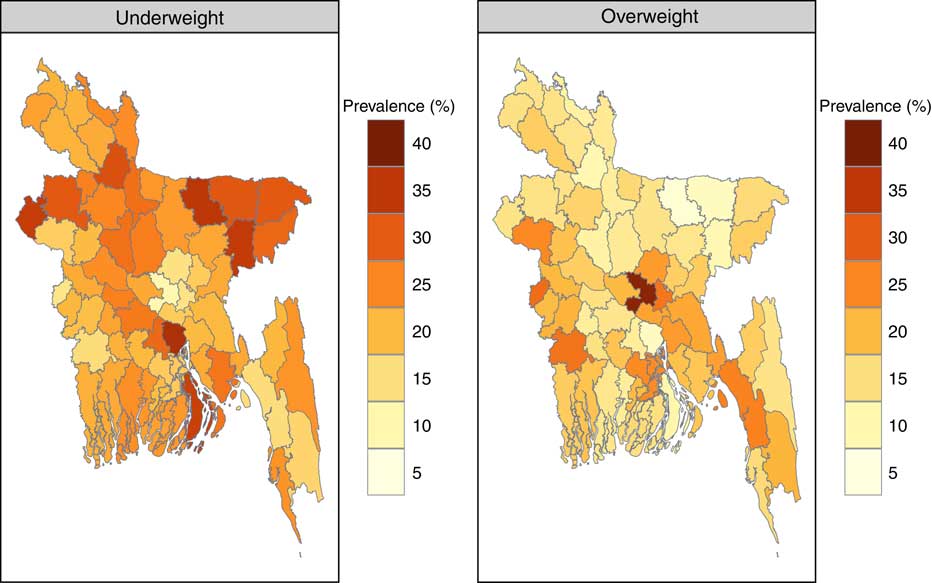
Fig. 2 (colour online) Posterior prevalence of underweight and overweight among mothers aged 15–49 years from a Bayesian spatial model, Bangladesh, 2014
Discussion
The current study investigated the association of individual-level factors with both maternal and child over- and undernutrition in Bangladesh, and further examined regional variation with the aim to identify districts (regions) with high prevalence so that evidence-based policy can be made for quick improvement. Results showed that maternal and childhood under- and overnutrition are significantly associated with sociodemographic factors and geographical location. These findings are similar to those of other studies conducted in recent years in Bangladesh and other low–middle-income countries( Reference Rahman, Howlader and Masud 25 , Reference Wang and Pies 46 – Reference Bhutta, Gazdar and Haddad 51 ). The striking finding of the current study is the large variation in undernutrition prevalence across the districts of the country. This result could help to recognize the regions where improvement is urgently required.
Findings extracted from the present study could have important implications. As explained in several studies, maternal education plays a significant role in child health outcomes( Reference Wang and Pies 46 , Reference Desai and Alva 52 ). This is because educated mothers have greater knowledge on health and nutrition of their children and the ability to recognize illness and seek treatment. Conversely, women with low education are mainly from more impoverished families in general, consume low-quality foods, suffer unhygienic living conditions and have limited access to health services, which in turn affects the health and nutritional status of both these mothers and their children. Moreover, women from poorer families are more likely to get married and give birth at a younger age (often less than 20 years), which in turn affects their nutritional status and that of their children too. In addition, even if they are educated, they often cannot afford the cost of providing nutritious foods and receiving quality health care. In contrast, the likelihood of being overweight is higher among children from the wealthiest households and whose mothers are highly educated. The probable reason is that mothers with high education and better socio-economic conditions are more aware of feeding their children extra nutritious foods without minimum physical activities to compensate. In addition to that, these families are living in the metropolitan area where there is very limited playing space available for children, which in turn affects children’s health by increasing their body weight.
Bangladesh has made remarkable progress in improving women’s education and socio-economic conditions in general in the last two decades, yet the progress towards reducing both maternal and child undernutrition has been disappointingly plodding( Reference Das, Chisti and Malek 53 ). In Bangladesh, stunting prevalence has been decreased by 17 percentage points between 2004 and 2014, while there has been minimal variation in wasting( 14 ). This is probably due to the regional differences in undernutrition prevalence, whereby the regions (districts) with very high prevalence may halt the national-level progress. As reported in the current study, there are about seven districts having high prevalence of children with stunting and wasting even compared with the countries reported as having the highest national-level rate among developing countries( Reference Stevens, Finucane and Paciorek 54 ). In addition, there are twelve districts with high stunting prevalence and thirty-two districts with high wasting prevalence, and the prevalence of both indicators is even higher than the respective WHO critical threshold level( 35 ). Similarly, fifty-three districts in total are found to have maternal underweight prevalence higher than the national level. On the other hand, regional variation also exists in the prevalence of women with overnutrition. The estimated prevalence of overweight women in twenty-four districts is found to be greater than the national estimate, while the other districts have lower prevalence than the national prevalence. Similar regional variations have been reported in other studies conducted in India, where there is an increasing concentration of child malnourishment in certain geographical areas( Reference Nair 55 ). Interestingly, malnutrition-prone regions still do exist in countries like the USA and Malaysia( Reference Slifkin, Goldsmith and Ricketts 56 ).
The districts with high prevalence of undernutrition identified by mapping can be linked to their poverty levels. The maps show that districts from the four poverty ‘hot spots’ identified by the Bangladesh Bureau of Statistics experience a high level of maternal and child undernutrition. For example, districts of the haor basin (Netrokona, Sunamgon, Habigonj, Moulvibazar and Sylhet) and coastal belt (Cox’s Bazar, Patuakhali and Bhola), a poverty ‘hot spot’, were found to have very high maternal and childhood undernutrition. Similarly, monga-prone north-western districts (Faridpir, Gaibandha, Kurigram, Shariatpur, Lalmonirhat and Nilphamari), where there is severe food insecurity during the pre-harvest time, and hilly districts of south-east Bangladesh are also recognized as poverty ‘hot spots’ of the country having high undernutrition prevalence. The findings have several implications. Women of the haor areas are particularly disadvantaged and vulnerable. Mothers and children living in these regions remain isolated with poor communications and transportation, leading to limited access to health facilities and other services such as education and employment( Reference Kandala, Fahrmeir and Klasen 57 ). Research shows that coverage of the Expanded Program on Immunization (which provides immunization, vitamin A and zinc supplements) and exclusive breast-feeding practices are low in these regions, which subsequently affects the nutritional status of women and children( Reference Uddin, Larson and Oliveras 58 , Reference Rahman and Obaida-Nasrin 59 ). Moreover, iodine deficiency is higher among people from the coastal belt due to their consumption of locally produced non-iodized salt that could have a negative impact on nutrition( Reference Rasheed, Siddique and Sharmin 60 ). These districts where undernourishment is most prevalent are also considered one of the food-insecure and vulnerable regions in the context of climate change and natural disasters. Further, low female literacy and primary-school enrolment rates in these areas are likewise associated with the high level of undernutrition. In contrast, overweight is less prevalent in these vulnerable districts; instead, it is concentrated in the districts with better socio-economic conditions, especially in the industrialized districts. Overweight among women of reproductive age has shown an eightfold increase in the past two decades, and this increase has mostly happened in urban areas where industrialization is proceeding rapidly (9 % in 1996 to 27·2 % in 2014)( 14 ). The increase may be a result of food habits and lifestyles with increased access to energy-dense foods( Reference Stevens, Finucane and Paciorek 54 ).
The present study’s findings raise the need for effective interventions and programmes that could contribute to the greater improvement in undernutrition in lagging districts. Even more potent would be significant policy reform to revitalize the entire health system for local-level tackling of undernutrition. Although the programme is based on a robust design tailored to local needs, it covers only about 30 % of the total population and its efficacy has been questioned( 61 – Reference Hossain, Duffield and Taylor 63 ). Besides, management of nutrition in the aftermath of natural disasters and stabilized prices for foods should also be prioritized. The findings of the study suggest the need for implementing district-level planning for nutrition, which is yet to happen, with a special emphasis on high-prevalence districts. Many development partners are implementing nutritional intervention programmes; however, interventions are yet to be implemented at various scales for reaching the entire population. The multisectoral responsibilities should also be accountable for managing district-level inequalities, targeting vulnerable women and people in the ecologically unfavourable parts of the country to improve the coverage of basic and effective nutrition interventions, including exclusive breast-feeding, appropriate complementary feeding and supplementation of micronutrients to children and pregnant/lactating women. Local programmes need promotion of social and economic empowerment and education of women – elements that could have been key to the success of similar and even poorer countries in the region( Reference Chowdhury, Bhuiya and Chowdhury 64 , Reference El Arifeen, Christou and Reichenbach 65 ). Social safety net programmes, such as the Vulnerable Group Feeding programme, should also include cash or food support to address both overt and hidden hunger.
Limitations of the study
To the best of our knowledge, the current study is the first district-level analysis of nutrition and its key determinants in a low-income country based on a nationally representative survey. Despite this, some limitations must be recognized. We did not have data about gestational age, birth weight of the child and household food security in the study, which would have allowed a more systematic analysis of mother–child linkages( Reference Black, Victora and Walker 1 , Reference Katz, Lee and Kozuki 66 ). Household food security is considered an important predictor of undernutrition in both mothers and children. Although the BDHS collected such data previously, it is expected that this survey may not insufficient to ensure whether the household is in a secure position regarding the availability of food or not. Therefore, we recommend a further study should be designed to assess the food security of households, aligned with the set of questions developed by the US Department of Agriculture( Reference Bickel, Nord and Price 67 ). The present study could not address trends over time at the district level because the previous BDHS did not include rich geographical information. Another potential limitation is use of an indirect measure of household wealth, because in developing countries like Bangladesh it is hard to obtain reliable income and expenditure data and identify household food and non-food expenses. Moreover, the study could not consider the existence or coverage of relevant nutrition programmes at the district level as an independent variable due to the lack or unavailability of reliable data. Despite these limitations, examining the key risk factors of stunted children and overweight mothers is a critical step in developing nutrition intervention programmes that target both extremes of the over- and undernutrition paradox.
Conclusion
Childhood and maternal undernutrition concentrated in the central, northern and eastern regions in Bangladesh, the geographically unfavourable areas. Under- and overnutrition showed opposite directions, and the districts with high prevalence of overnutrition had low prevalence of undernutrition and vice versa. Therefore, effective intervention programmes need to be designed urgently, focusing on children and women at the grass-roots level of such regions, for controlling the extremes of the over- and undernutrition paradox. Simultaneously, integrated programmes for improving education and socio-economic conditions of the general population in the highly concentrated undernutrition regions are also highly required. Failure to do so will ultimately harm the commitment set for all forms of malnutrition by 2030, as part of Sustainable Development Goal 2, to ‘end hunger, achieve food security and improved nutrition and promote sustainable agriculture’.
Acknowledgements
Acknowledgements: The authors acknowledge the National Institute of Population Research and Training (NIPORT), Mitra and Associates and IFC International for proving the open-access data sets used in the present study. icddr,b is grateful to the Government of the People’s Republic of Bangladesh; the Department of Foreign Affairs, Trade and Development (DFATD), Canada; the Swedish International Development Cooperation Agency (Sida); and the Department for International Development (UK Aid), UK for providing core/unrestricted support. Financial support: This research received no specific grant from any funding agency in the public, commercial or not-for-profit sectors. The authors conducted this study based on their own interest and used data from a secondary source. Conflict of interest: The authors declare that they have no competing interests. Authorship: M.N.M. and M.S.R. conceived of and designed the study. M.N.M., M.S.R. and P.K.R. performed the experiments. M.N.M., M.S.R. and P.K.R. analysed the data. M.N.M. and M.S.R. wrote the paper. M.N.M., M.S.R. and P.K.R. provided critical review, input and revision of the manuscript. All authors read and approved the final manuscript. Ethics of human subject participation: Not applicable.


