


It is important to periodically review dietary guidelines to ensure that the dietary prevention of diseases most pertinent for a given population underpin healthy eating advice(1, Reference Johnson and Kennedy2). Rising obesity rates now affect all age groups in Ireland(Reference McCarthy, Harrington and Kiely3–Reference O'Neil, Boylan and Burke6) and diet-related chronic diseases such as CVD, cancer and osteoporosis(7–9) still remain important public health concerns. Over the past 3 years Ireland has experienced a major economic downturn where unemployment has risen from an average of 4·6 % in 2007 to 13·7 %, according to the latest figures for 2010(10). Low income is associated with poor nutrition at all life stages, which in turn has major consequences for health(Reference Nelson11), such as a higher risk of diet-related chronic diseases(Reference James, Nelson and Ralph12). There is also well-established evidence that the prevalence of obesity is higher among those from socio-economically disadvantaged groups(Reference Drewnowski and Specter13, Reference Drewnowski and Darmon14).
To provide optimal nutrition in the context of obesity prevention, Ireland's national food guide (1993–2010) was recently evaluated in order to identify and prioritize the areas most in need of revision(Reference Flynn, O'Brien and Faulkner15). This evaluation found that food patterns based on the current food guide provided excessive energy, total and saturated fat but inadequate fibre and vitamin D intakes(Reference Flynn, O'Brien and Faulkner15). In addition, some impracticalities were also identified in the food choice advice, most notably in the wide range of energy provided by foods in the Bread, Cereal and Potato group and the need to convey meaningful portion sizes to consumers.
There are several methods that may be used in the development of food-based dietary guidelines. However, information on population-based approaches which include guidance on energy intakes is very limited and available only for the USA(Reference Britten, Marcoe and Yamini16). In the USA, the extensive technical process used to develop the most recent guidelines focused mainly on the development of food intake patterns that met established nutrient goals without providing excessive energy(17). This involved the iterative development of daily food patterns for all age and gender subgroups of the population(Reference Britten, Marcoe and Yamini16). General healthy eating guidelines, e.g. ‘use low-fat dairy products’, were then derived from the amounts and types of foods used in the food patterns.
The effectiveness of food-based dietary guidelines depends on many factors, including development of appropriate advice on foods commonly consumed and communication which includes wording and a graphic model such as a pyramid, a rainbow or a plate. Another major issue relating to the uptake of dietary advice is affordability. Assessment of the cost of healthy eating is critical to ensure that healthy eating is accessible for all. The latest figures available show that in 2009, the number of people living in Ireland in consistent poverty (having an income below 60 % of the median income in Ireland and experiencing enforced deprivation) was 5·5 % and the number of people at risk of poverty (having an income below 60 % of the median income in Ireland) was 14·1 %(18). Unemployment in Ireland has more than doubled since 2008(10), and disposable household income (per household) has also fallen by 6·3 % between 2008 and 2009(18). This is a significant consideration as energy-dense foods which are higher in fat and sugar tend to be cheaper than foods recommended for healthy eating such as fruit and vegetables(Reference Drewnowski and Specter13, Reference Drewnowski and Darmon14). Surveys in Ireland have indicated that access to affordable, good-quality, nutritious foods is a major challenge to low-income families and that social disadvantage is associated with higher fat intakes(Reference Kelleher, Lotya and O'Hara19, Reference Friel, Kelleher and Nolan20).
Following the evaluation of Ireland's food guide (1993–2010)(Reference Flynn, O'Brien and Faulkner15), the present paper describes the approaches used for revision of dietary guidelines in Ireland and the recommendations for healthy eating advice that were formulated as a result. In addition, the paper includes an examination of the affordability of these new recommendations.
Methods
Goals for energy, macronutrients(21), fibre(22, Reference Williams, Bollela and Wynder23), Fe(24), Ca and vitamin D(25) were set for males and females over 5 years of age as described in Phase I of this revision(Reference Flynn, O'Brien and Faulkner15). In addition, the UK goal of ≤10 % of energy from non-milk extrinsic sugars(26) was also used. Four-day food intake patterns were developed for twenty-two hypothetical males and females that were drawn from the four chosen age categories that represented the Irish population from age 5 years to 51+ years. The daily energy goals from these food intake patterns ranged from 5·9 to 11·7 MJ (1400–2800 kcal) providing different patterns that represented every 837 kJ (200 kcal) increase. The food patterns were developed to reflect the typical eating habits of various age and gender groups in Ireland. First, nutritionists experienced in assessing dietary intakes in Ireland constructed the initial food intake patterns using foods commonly eaten, as identified in recent national nutrition surveys undertaken on adults(27), teenagers(28) and children(29). Second, the additional input of dietitians currently working in public health, paediatrics and geriatrics was obtained to ensure the food patterns generated for the different age and gender groups reflected typical eating habits. These patterns were then repeatedly adjusted involving the use of different types and quantities of foods (e.g. low-fat dairy, lean meats, unsaturated spreads and oils, and occasional use of sugar, preserves on wholemeal foods or ‘other foods’), which were analysed and re-analysed for energy and nutrient output using the software Netwisp version 3·0 (Tinuviel Software, Anglesey, UK). Repeated adjustments were made until the food patterns approached the energy and nutrient goals. The percentage of energy contributed by non-milk extrinsic sugars for each of the food patterns was estimated, based on the method used in the UK National Food Surveys(Reference Kelly, Summerbell and Rugg-Gunn30). These sugars included the sum of: total sugars derived from table sugar and unsweetened fruit juices; half of the fruit sugar plus added sugar in preserves, stewed fruit and canned fruit; total sugars in breakfast cereals; non-milk sugars in yoghurts, milk puddings and ice cream; and total sugars found in composite dishes such as apple pie.
When nutrient outputs approached the goals, the amounts and types of foods used in the patterns were used as a basis for the recommended numbers of servings from each of the food groups to cover the energy and nutrient requirements according to age and gender. Further detailed advice on food choice was developed as appropriate to cover other aspects of healthy eating, e.g. use of unsaturated fats and oils to achieve low saturated fat intakes.
According to stakeholder preferences (see Phase I of this revision(Reference Flynn, O'Brien and Faulkner15)), the portion sizes of the foods in the Bread, Cereal and Potato group were enlarged and some were described using a 200 ml disposable cup where appropriate. These portions were sub-divided according to energy content into four categories ranging from 418 kJ to 920 kJ (100–220 kcal) in 126 kJ (30 kcal) increments.
To assess the affordability of foods needed for healthy eating, the four most common household types in Ireland were identified as described by Ross et al.(Reference Ross, O'Brien and Burke31). Three major retail outlets were surveyed throughout November 2008. These included a nationwide multiple grocery store chain, a low-cost nationwide grocery store and a local store. The amounts of foods used in each food pattern were costed according to the weight used. Where more than one brand of food product was available, the cheapest price was recorded. In addition, the specific cost of fruit and vegetables, fat spreads and oils and ‘other foods’ such as snacks, sugar and preserves per 418 kJ (100 kcal) provided was calculated. Affordability was initially assessed according to social welfare allowances available in 2008. For the present study, affordability was updated taking account of the 2010 National Budget and the 6·4 % fall in food prices since 2010(32, 33).
Results
Table 1 shows the daily amounts of energy, macronutrients, fibre, Ca, Fe and vitamin D provided by the twenty-two food intake patterns. The food patterns provide daily energy ranging from 5·9 to 11·7 MJ (1400–2800 kcal), with several representations of each 837 kJ (200 kcal) increment. For those aged ≥14 years, energy requirements for sedentary levels of activity are also included. Nineteen of the food patterns were within 41·8 kJ (10 kcal) and three were within 70 kJ (16 kcal) of the energy goals. All of the food patterns met the goals for total fat, carbohydrate and protein. The saturated fat intakes ranged from 8 % to 11·2 % of energy and non-milk extrinsic sugar intakes ranged from 6 % to 11·5 % of energy. Adjustment of food patterns attempting to reach the higher energy goals for males aged 14–50 years led to marginally excessive saturated fat intakes (11·2 % of energy for males aged 14–18 years and 10·7 % of energy for males aged 19–50 years both requiring 11·7 MJ (2800 kcal)).
Table 1 Daily energy and nutrients provided by twenty-two 4 d food intake patterns finalized for the development of food-based dietary guidelines on healthy eating, for moderately active males and females representative of Ireland's population aged 5 years and older

NMES, non-milk extrinsic sugars; %E, percentage of energy intake.
*Estimated energy requirements for sedentary and moderate levels of physical activity, based on the Institute of Medicine (IOM) recommendations for reference sized individuals(21). ‘Reference size’ is based on median height and weight for ages up to age 18 years; and, for adults, median height and weight for that height to give a BMI of 21·5 kg/m2 for females and 22·5 kg/m2 for males. ‘Moderately active’ is described as a lifestyle that includes physical activity equivalent to walking about 1·5 to 3 miles/d at 3–4 miles/h, in addition to the light physical activity associated with typical day-to-day life. ‘Sedentary’ means a lifestyle that includes only the light physical activity associated with typical day-to-day life.
†The females requiring 8·4 MJ (2000 kcal) and 9·2 MJ (2200 kcal), as well as the male aged 51+ years requiring 9·2–10·0 MJ (2200–2400 kcal), achieved 88–98 % of the goal for fibre intake (25 g)(22).
‡The food intake pattern for the adult female aged 51+ years requiring 7·5 MJ (1800 kcal) achieved 68 % of the goal for fibre intake(22).
§The IOM recommends an Adequate Intake (AI) of 1300 mg Ca from 9 to 18 years(25). Ca intakes did not reach the goals for 9–10-year-olds due to their lower energy requirements, with the exception of the food intake pattern for the 10-year-old boy.
∥Requiring 9·2 MJ (2200 kcal), who achieved 97 % of his AI for Ca.
¶The food intake pattern for girls aged 14–18 years, both at 7·5 MJ (1800 kcal) and 8·4 MJ (2000 kcal), included one portion (150 g) of oily fish, and the diet patterns for the women aged 19–50 years requiring 7·5, 8·4 and 9·2 MJ (1800, 2000 and 2200 kcal) included servings of oily fish at both one main meal (150 g) and one light meal (50 g).
All food intake patterns for those up to 18 years reached the goal of ‘age+5 g fibre’ per day. The 25 g/d goal for fibre was reached in adult food intake patterns providing 10 MJ (2400 kcal) or more. The food intake patterns for females aged 51+ years had more added sugar (10·9 % and 11·5 %) compared with the goal of ≤10 % of energy from non-milk extrinsic sugars, yet due to relatively low energy requirements, fibre intake reached only 16–17 g/d (64–68 % of the fibre goal).
The goals (Estimated Average Requirements) for Fe intake were reached. Ca intakes for 9–10-year-old children with daily energy requirements <9·2 MJ (2200 kcal) reached approximately 78 % of the goal of 1300 mg/d. The food intake patterns for males and females aged 51+ years achieved between 94 % and 111 % of the goal of 1200 mg Ca/d . Despite best attempts to incorporate foods containing vitamin D into the food patterns, intakes remained inadequate for almost all of the food patterns.
The recommended numbers of daily servings from the main food groups are outlined in Table 2. Servings from the Bread, Cereal and Potato group vary according to energy requirements. For males aged 19–50 years, servings from the dairy (Milk, Yoghurt and Cheese) group vary, and for males aged 14–50 years servings from the Meat, Fish and Alternatives group vary in order to meet higher energy requirements. Fat Spreads and Oils are separated from all Other Foods such as biscuits, cakes, chocolate and confectionery, enabling clearer advice on types and amounts of these foods to be provided. Separate advice is also provided on the use of sugars and preserves to increase palatability of low-fat, high-fibre cereals, breads and fruit as distinct from other uses.
Table 2 Recommended number of daily servings from each of the main food groups for healthy eating for males and females representative of Ireland's population aged 5 years and older
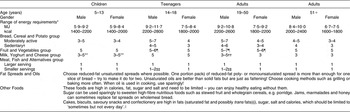
*Estimated energy requirements for moderate levels of physical activity, based on the Institute of Medicine recommendations for reference sized individuals(21). ‘Reference size’ is based on median height and weight for ages up to age 18 years of age; and, for adults, median height and weight for that height to give a BMI of 21·5 kg/m2 for females and 22·5 kg/m2 for males. ‘Moderately active’ is described as a lifestyle that includes physical activity equivalent to walking about 1·5–3 miles/d at 3–4 miles/h, in addition to the light physical activity associated with typical day-to day life. ‘Sedentary’ means a lifestyle that includes only the light physical activity associated with typical day-to-day life.
†Food intake patterns providing energy requirements for sedentary levels of physical activity were devised for those aged 14 to 51+ years only.
‡‘Larger serving’ refers to the serving to be eaten at a main meal; ‘Smaller serving’ refers to the serving to be eaten at a light meal.
§One portion pack of fat spread contains 7–10 g. 60 % monounsaturated and polyunsaturated spreads and unsaturated oils were used in the food patterns.
∥Foods such as ice cream, popcorn and apple pie were used occasionally in the diet patterns of those with energy requirements of 9·2 MJ (2200 kcal) or more, and ice cream was included in the patterns for children. No alcohol was included.
¶More than 5 servings were used in higher energy food patterns.
**Children from 9 years of age require up to 5 servings/d to reach the Adequate Intake (AI) of 1300 mg/d(25).
††Moderately active males aged 14–50 years may choose up to 5 servings to meet energy requirements.
‡‡Moderately active males aged 14–50 years with the highest energy requirements may have an extra ‘smaller serving’ from this food group.
§§Reformulation of food in recent years has led to a substantial reduction in the level of industrialized trans fat in the Irish food supply(61, 62). However, in the absence of specific regulations that label, or restrict, levels of industrialized trans fat in foods, consumers are advised that particular foods in the ‘Other Foods’ group, previously identified to be significant sources of such fats(Reference Cantwell, Flynn and Cronin63), may contain trans fats.
The final portion sizes of foods in the Bread, Cereal and Potato group (see Table 3) were derived to reflect nutritionists/dietitians’ and consumers’ preferences for larger portions deemed to be more meaningful(Reference Flynn, O'Brien and Faulkner15). The use of a 200 ml cup to indicate portion size was also incorporated(Reference Flynn, O'Brien and Faulkner15).
Table 3 Description of final serving sizes (average food weight) of foods from the Bread, Cereal and Potato Group sub-categorized according to energy content

*Cup used to describe serving size was a 200 ml plastic disposable cup.
†Serving of porridge oats described given as uncooked. Energy value given for corresponding cooked porridge made with water.
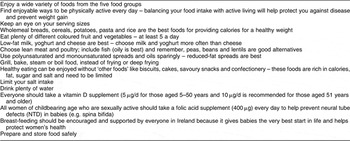
Table 4 describes the main recommendations for healthy eating derived from both the evaluation of Ireland's food guide(Reference Flynn, O'Brien and Faulkner15) and the development of the twenty-two food intake patterns for different age and gender groups. Other recommendations, outside the development of food-based dietary guidelines, include supplementation with folic acid, breast-feeding and food safety.
Table 4 Key recommendations for healthy eating in Ireland based on the development of food-based dietary guidelines
The cost (€) and percentage (%) of weekly social welfare allowance and child benefit required to purchase the foods contained in the food intake patterns for the four most typical households using three different grocery store outlets are shown in Table 5. The results show that families with children, particularly older children, incur the greatest cost (€132·40) representing approximately 30 % of social welfare allowance, while the lowest costs are incurred by females aged 65+ years who live alone (costing €32·40, representing approximately 15 % of their social welfare allowance). The cost of shopping in ‘local shops’ compared with a multiple supermarket is on average twice as expensive. Calculating the specific cost of healthy eating for children using their social welfare allowances (i.e. the child dependency allowance plus the child benefit), it was found that covering the cost for the older child took up his entire social welfare income. The cost of fruit and vegetables per 418 kJ (100 kcal) was found to be €0·45; the cost of ‘other foods’ such as snacks, sugar, preserves, etc. per 418 kJ (100 kcal) was €0·17 and that of fat spreads and oils was only €0·04/418 kJ (100 kcal).
Table 5 Food costs (€) and proportion (%) of weekly Social Welfare AllowanceFootnote * required to purchase the foods included in the healthy eating food intake patterns for the four most common household types in Ireland using three different grocery store outlets

* Social Welfare Allowance includes Child Dependency Allowance and Child Benefit but excludes the National Fuel Scheme, Back-to-School Clothing and Footwear Allowance and Household Benefits Package.
Discussion
The present paper describes the revision of Ireland's dietary guidelines, developed for the population of Ireland over 5 years of age, based on food patterns that achieved well-established nutrient goals within energy requirements at sedentary and moderately active physical activity levels. Guidance on the type and amount of food required for healthy eating was developed from these patterns in terms of numbers of servings from each of the food groups. The portions of foods in the Bread, Cereals and Potato group were sub-categorized according to energy content to give improved guidance on energy. In relation to vitamin D, it was concluded that the best strategy to ensure adequacy for all age and gender groups was to recommend supplementation. To achieve goals for total fat and saturated fat, guidance indicated preferential use of low-fat dairy foods, lean meats as well as unsaturated fats and oils. Furthermore, separation of fats and oils in to a new food group facilitated clearer direction on the type and amounts of these foods required. Finally, advice that sugar and preserves can be used sparingly to sweeten high-fibre foods such as porridge and wholemeal bread aims to address the challenge of achieving fibre goals without increasing fat intakes. This was found to be particularly relevant for subgroups with lower energy requirements, where fibre goals are difficult to achieve.
Given the increasing rates of obesity in Ireland(Reference McCarthy, Harrington and Kiely3–Reference O'Neil, Boylan and Burke6), guidance on energy was incorporated into healthy eating advice, which follows the approach used in recent revisions of food guides in other countries(17, 34). The energy requirements set were for people of normal body weight(21), which means that overweight people following the guidance on food servings will tend to lose weight. For health promotion and disease prevention, being moderately active is strongly recommended(Reference Pate, Pratt and Blair35, Reference Haskell, Lee and Pate36). However, the only available data for levels of activity among people living in Ireland suggest that almost one in five adults is sedentary (i.e. report ‘taking no exercise’(Reference Morgan, McGee and Watson37)). As self-reported estimates of physical activity may be subject to reporting error(Reference Neilson, Robson and Friedenreich38, Reference Westerterp39), the number of people in Ireland who are sedentary may be underestimated. It was therefore deemed necessary to include advice for energy requirements at sedentary levels of physical activity. This approach has the advantage of also providing guidance for moderately active people on how they need to adapt their energy intakes during periods of inactivity, thus preventing unintentional weight gain. No advice for very active people, as defined by the Institute of Medicine(21), was included because the needs of this subgroup were recognized as being heterogeneous and general guidance on healthy eating may not cover their needs appropriately.
Foods from the Bread, Cereal and Potato group were the main focus of energy guidance because these foods impact on the acceptable macronutrient distribution range(21). It was deemed important to alert consumers to the range of relative energy content of these foods, e.g. 460 kJ (110 kcal) for porridge v. 920 kJ (220 kcal) for a bagel. Without this sub-categorization, consumers could potentially believe that these critical foods for energy balance were equivalent.
The goal for Ca intakes in children aged 9–10 years (1300 mg/d) was difficult to attain and it was therefore recommended that daily servings of low-fat dairy foods may need to be increased due to the onset of puberty. Recent research shows that vitamin D intakes are very low in most age groups in Ireland(Reference Hill, O'Brien and Cashman40–Reference Kiely, Hannon and Walton42). Such poor vitamin D intakes are further compounded by Ireland's northerly latitude and temperate climate(Reference Holick43, Reference Ovesen, Andersen and Jakobsen44) and, as such, inadequate vitamin D status is evident in many subgroups(Reference McCarthy, Collins and O'Brien45, Reference Hill, Flynn and Kiely46). Ireland's latitude is comparable with the main populated areas of Canada where all milk is fortified with vitamin D on a mandatory basis. In addition to this, Health Canada recommends that all adults over 50 years take supplements providing 10 μg vitamin D daily(34). In this revision the only adjusted food patterns that provided an adequate intake of vitamin D included oily fish twice in four days, which is not reflective of eating habits in Ireland. Preliminary recommendations therefore include daily supplements (5 μg vitamin D for 5–50 years and 10 μg for 51 years and older). Given the preventive role of vitamin D in osteoporosis and its emerging role in the prevention of many chronic diseases(Reference Holick43), it has been suggested by some researchers that the current recommendations for daily intakes of vitamin D are not adequate(Reference Vieth47–Reference Cashman, Wallace and Horigan49). In relation to this the Institute of Medicine has recently revised its vitamin D intake recommendations, substantially increasing its previous dietary reference intakes for vitamin D(50). In Ireland, therefore, an expert group will be required to review and implement the most appropriate strategies for vitamin D supplementation in different subgroups of the Irish population.
To achieve the goal for saturated fat significant readjustments to food patterns were required involving use of low-fat dairy foods, unsaturated fat spreads and oils and lean meats. Food patterns developed for males with higher daily energy requirements of 10·0–11·7 MJ (2400–2800 kcal) that included occasional foods from the Other Foods group and some full-fat dairy products tended to exceed the ≤10 % of energy goal. Since males have a relatively high risk of developing CVD(Reference Ng51), it can be concluded that the best advice for everyone involves limiting ‘other foods’ and preferential use of low-fat dairy products, as well as unsaturated spreads and oils and lean meats. Such guidelines are in line with recently developed healthy eating guidelines in Australia(52), Canada(34) and the USA(17).
This revision found that fibre goals were difficult to achieve, as previously reported in Ireland(Reference Galvin, Kiely and Harrington53), particularly in food patterns that were based on lower energy requirements (<10 MJ/<2400 kcal). Specific adjustments of food patterns involved the sparing use of two fat-free sources of sugar, i.e. table sugar and preserves, to increase the acceptability and palatability of fibre-rich food sources, such as wholemeal cereals, breads and stewed fruit – an approach that has been previously used(52, 54). However this revision of healthy eating advice also includes advice to avoid frequent intakes of sugar for the promotion of good dental health(Reference Konig55). Previous work in Ireland has highlighted an inverse relationship between intakes of saturated fat and sugar and preserves(Reference Flynn, Sugrue and Codd56) and the inverse relationship between sugar and fat intakes is well established(Reference Drummond and Kirk57, Reference Hill and Prentice58). Notwithstanding this, the inclusion of sugar and sugary foods for their own sake (i.e. independent of fibre-rich foods) was not supported in this revision. Consumption of sugary foods, such as soft drinks, or sugary foods that also contain fat, such as confectionery, increases intakes of energy and possibly fat without providing essential nutrients(Reference Flynn, O'Brien and Faulkner15), and high-fat sweet foods may be positively associated with obesity(Reference MacDiarmuid, Vail and Cade59). Therefore, in addition to management of saturated fat intakes discussed above, limiting intake of these ‘other foods’ is also emphasized in this revision to allow for increased intake of more nutrient-dense food sources of energy, such as fibre-rich breads and cereals. A similar approach is taken in the recently updated dietary guidelines for Americans of all ages, where consumption of energy from solid fats (fats containing a high proportion of saturated and trans fatty acids) and added sugars is recommended to be kept ‘as low as possible’ to allow for increased intake of nutrient-dense foods without exceeding overall energy needs(60). In relation to trans fats, reformulation of the Irish food supply in recent years has led to a substantial reduction in the level of industrialized trans fat(61, 62). However, in the absence of specific regulations that label or restrict levels of industrialized trans fat in foods, consumers are advised that some foods in the Other Foods group, previously identified to be significant sources of such fats(Reference Cantwell, Flynn and Cronin63), may contain trans fats.
The present study found that the cost of healthy eating accounts for approximately one-third of the social welfare allowance in Ireland and is more expensive for families with children, especially those with older children. Older children need more food to cover the high energy and nutrients required to support their growth and development throughout adolescence(21, 25). However, child benefit and social welfare payments in Ireland do not take account of this. For example, the entire weekly social welfare allowance for the adolescent male only just covers the cost of healthy eating if all shopping is carried out in a ‘local’ store. Local convenience shops were found to be almost twice as expensive for healthy eating. It is known that access to cheaper grocery stores can be difficult for many families on low income due to reliance on public transport(Reference Kelleher, Lotya and O'Hara19, Reference Friel, Kelleher and Nolan20). The finding that foods promoted for healthy eating such as fruit and vegetables and lean meat alternatives are relatively much more expensive is supported by other studies(Reference Drewnowski and Specter13, Reference Drewnowski and Darmon14, Reference Friel, Kelleher and Nolan20). This barrier to healthy eating needs to be addressed as it is likely to contribute to the higher risk of diet-related diseases among those who are socially disadvantaged or on lower incomes(Reference Nelson11, Reference James, Nelson and Ralph12). Such work could focus on the development of healthy eating advice using cheaper food options (e.g. pulses and eggs as a cheaper alternative to meat) accompanied by community-based practical activities (e.g. meal planning, shopping and preparing meals on a budget).
The use of dietary databases to generate food patterns for healthy eating guidelines, as used in the USA(Reference Britten, Marcoe and Yamini16), has the clear advantage of being based on prevailing eating habits, engendering greater confidence in the potential acceptability of the resulting guidelines. Unfortunately this approach was beyond the scope and resources of this current revision. However, constructing the food patterns using foods ‘typically eaten’ (according to national nutrition surveys(27–29)), and involving nutritionists and dietitians experienced in assessing dietary intakes among various age and gender groups in Ireland, helped to provide food patterns that were largely reflective of mainstream eating habits in Ireland. It is recognized, however, that this is but a first step in providing guidance on healthy food choice due to the countless different food combinations that can make up a healthy diet. Nevertheless, for the prevention of obesity and chronic disease in Ireland, the most pertinent aspects of the food guide requiring revision were addressed in that the revised guidelines outline how nutrient goals can be achieved within energy requirements. In addition, guidance is provided which aims to reduce saturated fat, increase fibre and provide adequate vitamin D intakes. Further work is required that focuses on foods favoured by various subgroups of the population (e.g. teenagers v. older adults) and the development of the most appropriate form of communication (e.g. wording and graphic model).
These revised food-based dietary-guidelines need to be promoted in tandem with the recent national guidelines that recommend more physical activity in Ireland(64). The higher food intakes required to cover the extra energy expenditure associated with increased physical activity may provide more scope for individuals with low energy requirements to achieve adequate intakes of nutrients such as fibre and Ca. Finally, even small changes towards healthier habits in both diet and physical activity can be effective at addressing the spiralling rates of overweight and obesity evident in Ireland over recent years(Reference Hill65), especially in children and youth(Reference Flynn, McNeil and Maloff66).
Acknowledgements
The work reported in this manuscript was funded by the Food Safety Authority of Ireland (FSAI). There are no conflicts of interest. The contributions of each author to the submitted manuscript are as follows. M.A.T.F.: research design, overall supervision and co-author of the manuscript; C.M.O'B. main researcher on all aspects of this work, supervision of research assistants, co-author of manuscript; V.R.: research assistant on assessment of the affordability of healthy eating and contributor to manuscript write-up; C.A.F.: research assistant on development and analysis of the food intake patterns and contributor to manuscript; S.J.B.: research assistant on assessment of the affordability of healthy eating and contributor to manuscript. We gratefully acknowledge the following dietitians who provided guidance on acceptable food patterns for children and older people: Ita Saul and Nicola Harris (Our Lady's Children's Hospital, Dublin); Valerie Kelly and dietetic colleagues (Children's University Hospital, Dublin); and Pauline Dunne and Grainne Flanagan (Older Person's Services, Midlands Health Service Executive). Special thanks are due to Margot Brennan, who coordinated feedback from members of the Irish Nutrition and Dietetic Institute. The advice and input of Members of the Steering Committee on Revision of the Food Based Dietary Guidelines for Ireland, FSAI, are also gratefully acknowledged. Finally many thanks are due to the administrative staff at the FSAI who helped to format and prepare the manuscript: Aileen Ward, Alice Kenny, Nicola Canning, Niamh Devaney and Marianne McFeely.


