Meat is considered an important food with respect to protein intake as well as intake of Fe and Zn and certain B-vitamins. However, to date very little is known about amount of meat consumed in Switzerland and how much meat consumption contributes to protein intake. Regional studies such as CoLaus(Reference de Abreu, Guessous and Vaucher1) and Sapaldia(Reference Steinemann, Grize and Ziesemer2) used specific dietary assessment instruments to quantify the intake of different food groups in Swiss populations. However, these assessments were always restricted to certain Swiss regions, never covering the entire country, and none of these studies compared the extremes of meat consumption. In contrast, the Swiss Health Survey assesses the health of the Swiss population in a systematic manner every 5 years starting in 1992, but it covered diet only in a minimalistic and crude manner(Reference Eichholzer, Bernasconi and Jordan3). menuCH, the first National Nutrition Survey conducted in Switzerland, allows to quantify meat consumption in greater detail than previous studies and to assess whether the unique Swiss situation of three different language and cultural regions is reflected by different meat consumption habits. In the first analysis, Chatelan et al.(Reference Chatelan, Beer-Borst and Randriamiharisoa4) described the intake of different types of foods in Switzerland and observed differences by language region, including differences in meat consumption.
High consumption of meat from mammals (‘red meat’), mostly pork and beef, but also sheep, goats, rabbit or venison, is common in affluent western societies. However, the high consumption of red meat, in particular processed red meat, has raised some health concerns with respect to increased risk of colorectal cancer(5), CVD(Reference Micha, Michas and Mozaffarian6) and overall mortality(Reference Wang, Lin and Ouyang7). Epidemiological studies among vegetarian and vegan populations are still scarce, and it is thus unclear if vegetarians and/or vegans have lower risk of dying from chronic diseases compared with meat eaters or whether the decreased mortality in vegetarians compared with the general population is mainly due to a healthy lifestyle, that is, being non-smokers, leaner, more physically active, etc.(Reference Dinu, Abbate and Gensini8–Reference Chang-Claude, Hermann and Eilber10).
Currently, very little is known about the prevalence of vegetarians in Switzerland, and even less about their dietary habits or sociodemographic characteristics; likewise, high-meat eaters are not well characterised either. This study aims to characterise no-meat and meat eaters in Switzerland, ranging from no- to high-meat eaters, based on protein intake and sociodemographic, anthropometric, lifestyle and dietary factors.
Methods
National nutrition survey menuCH
The first Swiss National Nutritional Survey, menuCH, was conducted from January 2014 to February 2015 in ten study centres that cover the three main language regions, that is, German, French and Italian. Ethical approval for the survey was obtained from the main ethics committee in Lausanne (Protocol 26/13, 12 February 2013) and by the corresponding regional ethics committees. Guidelines of the Declaration of Helsinki were respected, including written informed consent from the study participants. ISRCTN registration number is 16778734 (https://doi.org/10·1186/ISRCTN16778734). A representative sample was drawn by the Federal Statistical Office(11), and 13 606 individuals aged between 18 and 75 years were invited to participate in the survey. This sample targeted 4 627 878 women and men living in the twelve major cantons. Eventually, 2086 people responded, 2081 answered the questionnaire and 2057 completed the two 24-h dietary recalls (24-HDR)(Reference Chatelan, Marques-Vidal and Bucher12). The design of two non-consecutive interviews was chosen to minimise inter- and intra-individual variation in dietary intake and to increase accuracy, as the survey was conducted during all seasons and included both weekdays and weekends. The first 24-HDR was assessed at the study centre, the second one by telephone 2–6 weeks later, both conducted by a trained dietitian and using the standardised software GloboDiet®(Reference Chatelan, Marques-Vidal and Bucher12). Food consumption data from the 24-HDR were linked with the Swiss Food Composition Database(13) to compute intake of energy, proteins, carbohydrates and fats.
To assess the overall diet quality of menuCH participants, a modified version of the Alternate Health Eating Index was computed(Reference Chiuve, Fung and Rimm14). The original score, aiming to assess the adherence to the Dietary Guidelines for Americans, includes the following eleven components: vegetables, fruits, whole grains, sugar-sweetened beverages, nuts and legumes, red and processed meat, trans fat, fish, PUFA, Na and alcohol(Reference Chiuve, Fung and Rimm14). However, since meat is the outcome variable in the present analyses, the Alternate Health Eating Index was modified to exclude the component meat. The modified total score can range from 0 to 100 points, indicating minimal adherence to maximal adherence to the Dietary Guidelines for Americans. A more detailed description about the original calculation of the score was previously published(Reference Pestoni, Krieger and Sych15).
In addition to diet, using a self-administered questionnaire, the study assessed sociodemographic information of the study participants, including age, sex, education, marital status, nationality and household income; lifestyle characteristics such as smoking habits, physical activity and use of dietary supplements; information about the participants’ self-reported health and avoidance of certain foods including meat. The food avoidance question generated data about avoidance of meat, fish and seafood, as well as other food groups, however without specifying a time frame.
Body weight and height were measured at the study centres following a standardised protocol and used to calculate the BMI. In case measurements of weight and height were impossible (n 7), self-reported measures were used. In additions, for pregnant and lactating women (n 27), BMI was calculated using self-reported weight before pregnancy and measured height(Reference Chatelan, Marques-Vidal and Bucher12).
Categorisation by meat consumption
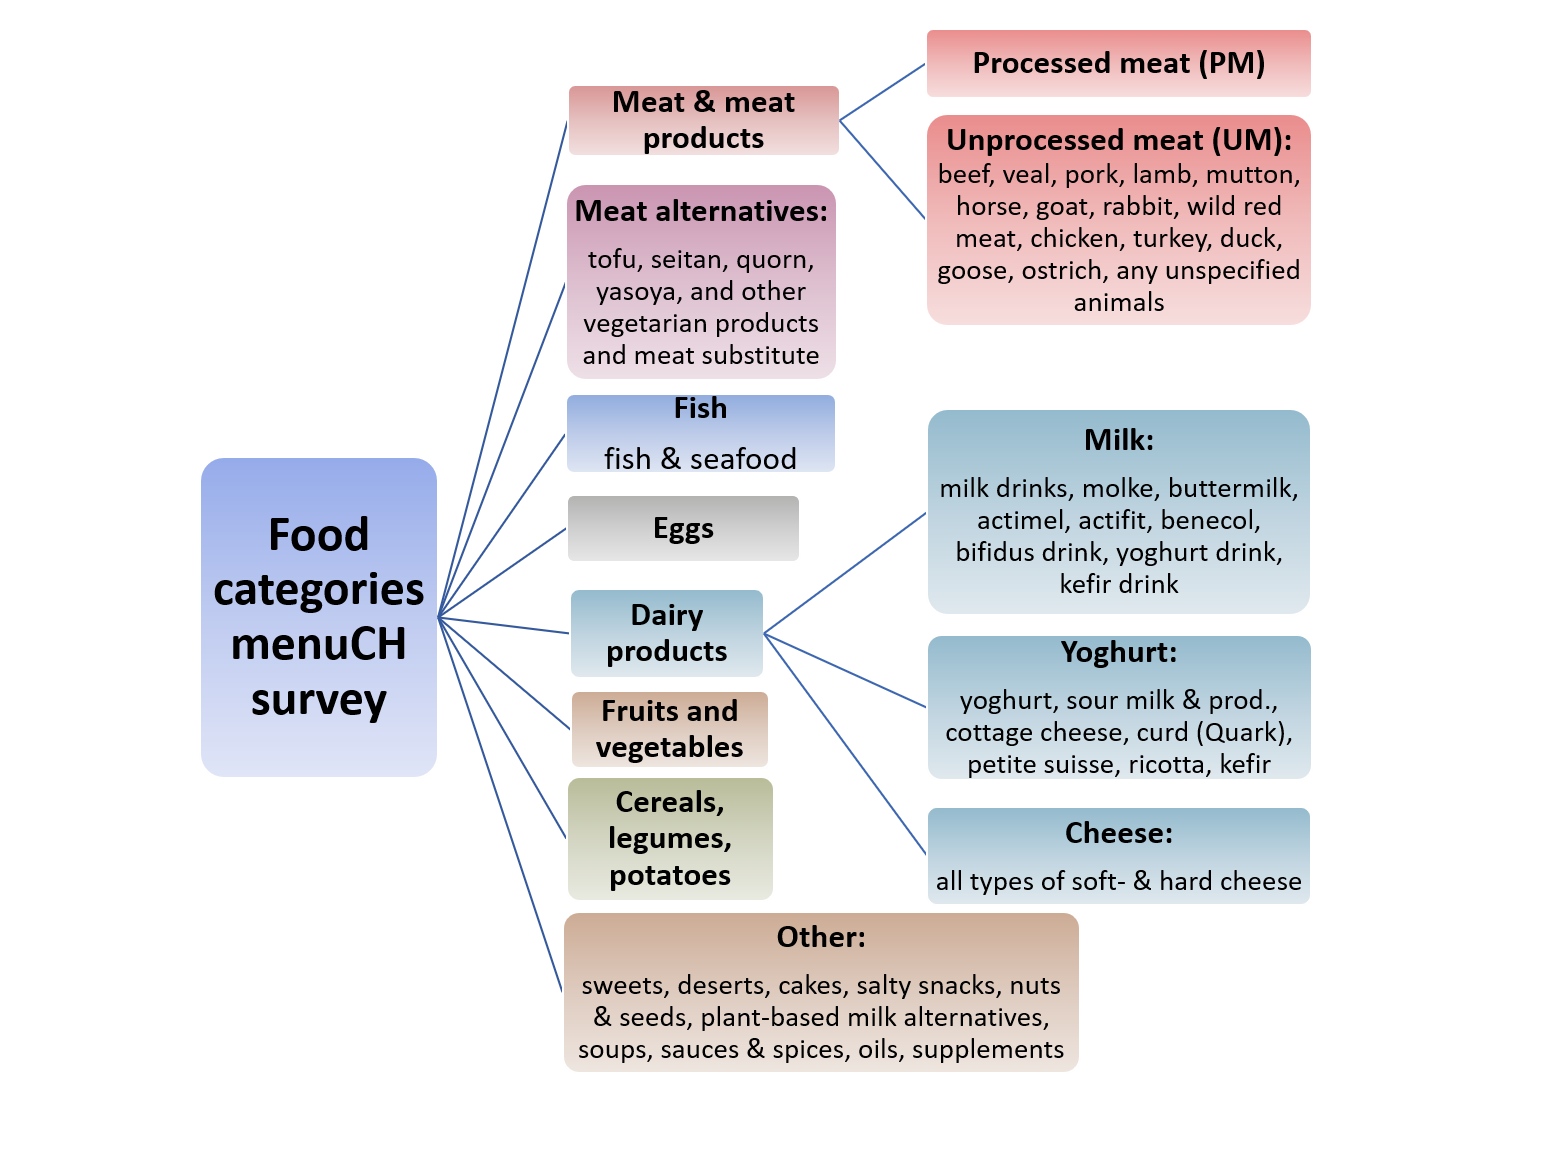
To analyse meat consumption habits, we referred to the subcategory of meat and meat products as defined in GloboDiet® including processed meat, unprocessed meat and offal from mammals, poultry and other animals. Unprocessed meat included fresh meat and offal from beef, veal, pork and other types of mammals, all types of poultry and their offal, and other types of meat (e.g. frogs, ostrich; online Supplementary Fig. 1); processed meat included mainly pork and beef, but also poultry and meat of other animals that has been treated to improve taste, colour and shelf life. A detailed analysis of processed meat consumption in menuCH is provided by Sych et al.(Reference Sych, Kaelin and Gerlach16).
To categorise study participants by level of meat consumption, four subgroups were formed based on results of meat avoidance derived from the questionnaire and on actual consumption of meat as reported in the 24-HDR, that is, no-, low-, medium- and high-meat eaters. No-meat eaters were defined as participants who reported avoidance of meat consumption from any animal including mammals, poultry and other species in the questionnaire and who did not report meat consumption in the 24-HDR. Originally, we planned to distinguish between ovo-lacto vegetarians and pescetarians, but due to low prevalence (1·8 and 2·6 %, respectively), we decided post hoc to combine these two groups. Study participants who did not report meat avoidance in the questionnaire or who reported meat consumption on at least one of the 24-HDR were assigned to the group of low-, medium- or high-meat eaters based on energy contributions of total meat intake to total energy intake (meat:energy ratio). This approach was chosen because it reflects differences in energy intake due to quantity and meat type (processed meat usually has a higher energy density than unprocessed meat) and takes into account that women usually eat less meat than men on the absolute scale, but not necessarily when taking energy intake into account. From the two 24-HDR interviews, average total meat intake per individual and per day was estimated from total meat intake and expressed as a percentage of total energy intake. In order to have a sufficient number of participants in the low- and high-meat consumption groups, we decided to assign 15 % of the participants to each of these groups. Using this basis, we assigned 15 % of the participants with the lowest meat:energy ratio to low-meat eaters (meat:energy ratio of ≤2·4 %) and 15 % of the participants with the highest meat:energy ratio to high-meat eaters (ratio of ≥18·7 %). Participants with a meat:energy ratio of 2·5–18·6 % were assigned to the intermediate category (medium-meat eaters; Fig. 1). No corrections were applied and under- or over-reporters were not excluded from the data set.
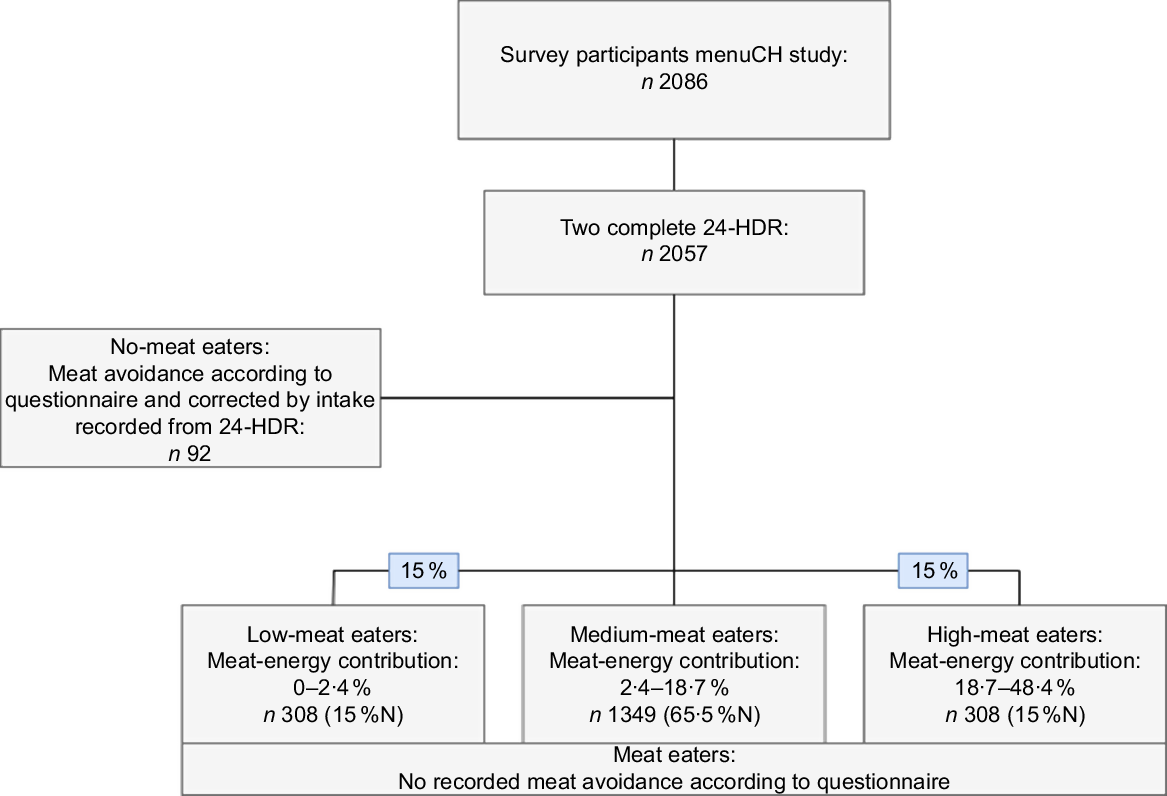
Fig. 1 Subgroup formation by meat consumption: no-meat (including vegetarians and pescetarians), meat eaters including low-, medium- and high-meat eaters
Statistical analysis
Weighting strategy
The National Nutrition Survey menuCH included a weighting strategy to better represent the target population of Switzerland. A multiple-step stratified sample included weights with respect to age, sex, marital status, major area of Switzerland based on home address, nationality and household size. In addition, the 24-HDR data were corrected for season and uneven data collection over the weekdays. The weights applied were constructed based on characteristics of the whole sample of 2057 participants(Reference Pasquier, Chatelan and Bochud17). Since the group formation of this study is based on criteria not included in the menuCH survey weighting strategy, the subgroups for level of meat intake were established with non-weighted values. Subsequently, weights were used for all calculations including characteristics of the entire study group, protein intake and regression analysis.
Imputation of missing covariates
Multivariate imputation by chained equations with m = 25 was used to impute missing information on the variables of interest. In this way, we were able to include all menuCH participants with complete dietary assessment (n 2057) in the analysis.
Adequacy of protein intakes as compared with national guidelines
We computed mean daily protein intake by source of protein and categorised the protein sources as follows: meat and meat products, meat alternatives (other protein-based vegetarian products including tofu, seitan, Quorn, yasoya etc.), fish, eggs, milk and milk products, cereal products together with legumes and potatoes, fruits and vegetables, and others (sweets, desserts, cakes, salty snacks, nuts & seeds, plant-based milk alternatives, soups, sauces & spices, oils, supplements). We defined sufficiency of protein intake based on the recommendations of the German, Austrian and Swiss Nutrition Societies(18). For participants up to 64 years, an intake of at least 0·8 g protein/kg body weight was considered sufficient, whereas an intake of at least 1·0 g protein/kg body weight was considered sufficient for participants aged 65 years and older.
Association of meat consumption with sociodemographic, anthropometric and lifestyle determinants
We used multinomial logistic regression models to examine the association of meat consumption habits with sociodemographic, anthropometric and lifestyle characteristics. The categories no-meat, low-meat and high-meat eaters were compared with the category medium-meat eaters (reference). Exposure variables were sex (male and female), language region (German, French and Italian), age (18–29, 30–44, 45–59 and 60–75 years), nationality (Swiss, Swiss binationals and other), marital status (single, married, divorced and other), highest degree of education (primary school or no degree, secondary, tertiary), gross household income per month (<6000 CHF, 6000–13 000 CHF and >13 000 CHF), BMI category (<18·5, 18·5 to <25·0, 25·0 to <30·0 and ≥30·0 kg/m2), self-reported physical activity (low, moderate and high), smoking status (current, former and never), micronutrient supplement use (yes and no) and self-reported health status (good/very good and very bad/bad/moderate). The regression models were adjusted for total energy intake, season and weekday.
All statistical analyses were conducted using R software (version 3.4.1). Logistic regression was conducted using the nnet package(Reference Venables and Ripley19) and the imputation with the mice package(Reference van Buuren and Groothuis-Oudshoorn20).
Results
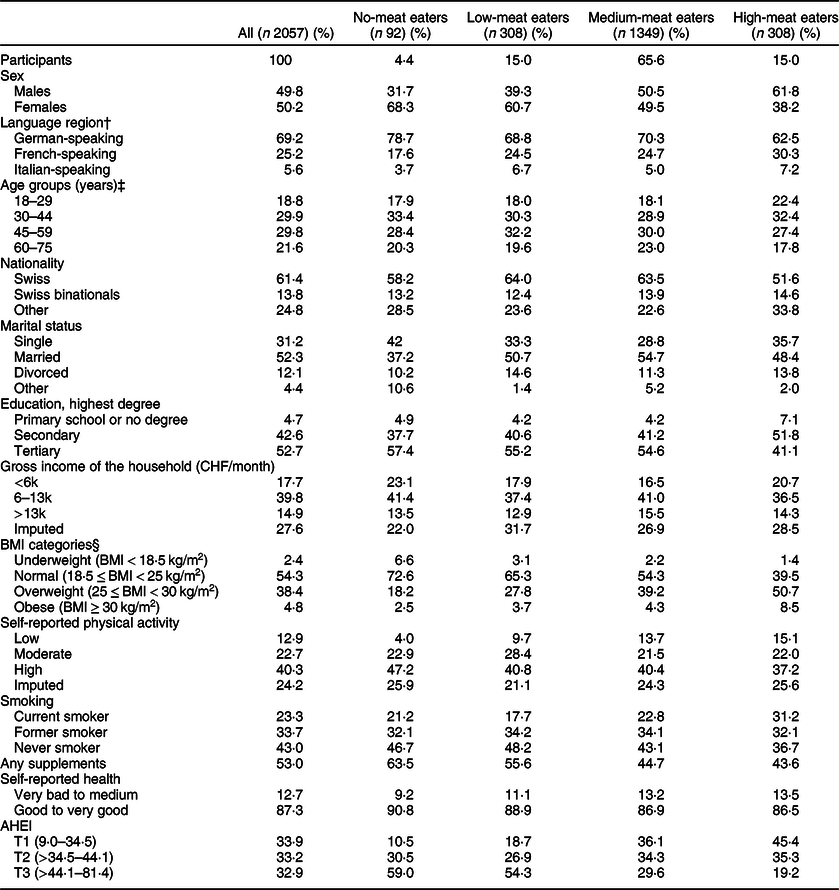
Of the 2057 study participants, 4·4 % were no-meat eaters (Table 1). The majority of no- and low-meat eaters were female (68·3 and 60·7 %, respectively), whereas 61·8 % of high-meat eaters were male. Other characteristics of the different meat-eating categories are shown in Table 1. The groups particularly differed by BMI, physical activity and smoking habits, but also language region. Almost 60 % of no-meat eaters were in the highest tertile with respect to overall diet quality (i.e. Alternate Health Eating Index), but only 10 % in the lowest tertile. Low-meat eaters had an overall diet quality similar to that of no-meat eaters, whereas 45 % of high-meat eaters were in the lowest tertile of diet quality.
Table 1 Characteristics of the meat consumption subgroups*
24HDR, 24-h dietary recall; CHF, Swiss Francs; AHEI, Alternate Healthy Eating Index; T, tertile.
* Percentages are weighted for sex, age, marital status, major area, household size and nationality. Number of imputed values is not shown for variables with <0·2 % of missing values (0–4). AHEI without the component meat. The score can range from 0 to 100 points with 0 meaning minimal and 100 meaning maximal adherence to dietary recommendations.
† German-speaking region includes the cantons of Aargau, Basel-Land, Basel-Stadt, Bern, Lucerne, St. Gallen and Zurich; French-speaking region: Geneva, Jura, Neuchatel and Vaud; and Italian-speaking region: Ticino.
‡ Age is the self-reported age on the day; the dietary and physical activity behaviour questionnaire was filled.
§ BMI was obtained from measured height and weight. Self-reported weight or height was used when measurements were impossible. For lactating and pregnant women, self-reported weight before pregnancy was used to calculate BMI.
Participants with different meat-eating habits differed only slightly by total energy intake, with greater differences by energy source (Fig. 2). Energy intake from carbohydrates was highest in no-meat eaters and lowest in high-meat eaters, whereas energy intake from fat was similar between groups. However, high-meat eaters had the highest energy intake from protein.
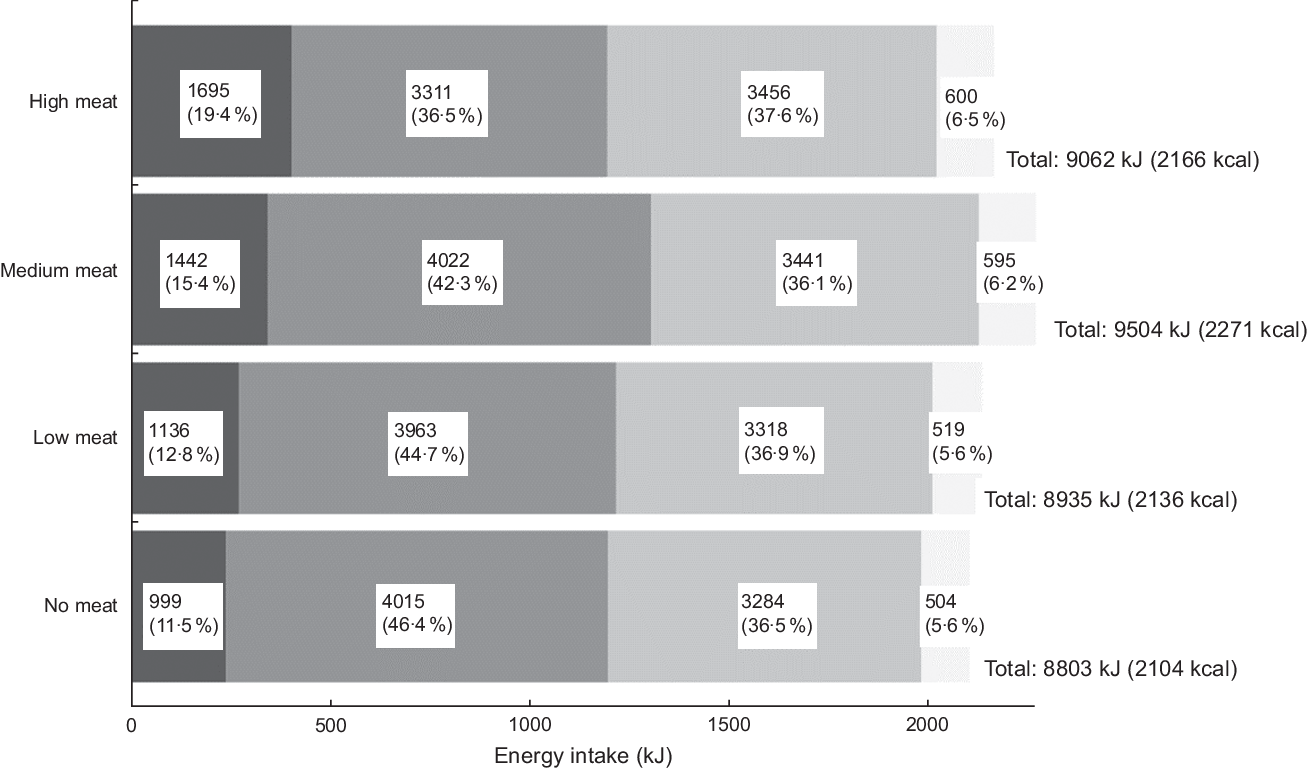
Fig. 2 Macronutrient contribution to total energy intake by meat consumption subgroups (no, low, medium and high meat, as kJ and %). ‘Other’ includes alcohol and dietary fibres. Numbers are weighted for age, sex, marital status, major region of Switzerland, household size, nationality, season and weekday. ![]() , Energy protein;
, Energy protein; ![]() , energy carbohydrates;
, energy carbohydrates; ![]() , energy fat;
, energy fat; ![]() , energy other
, energy other
Consumption of protein-rich foods and adequacy of protein intakes
The consumption of different types of protein-rich foods differed by amount of meat consumption (Table 2). Meat alternatives such as tofu and Quorn were consumed in large amounts only by no-meat eaters; this group also consumed fish, but in lower amounts than meat eaters. Consumption of milk and dairy product was highest among low-meat eaters. Interestingly, the intake of the category cereals, potatoes and legumes was similar across meat consumption groups, but low-meat eaters had the highest intake of fruits and vegetables, followed by no-meat eaters. Protein intake by food sources follows the pattern shown in Table 2 (amount of food consumed) and Fig. 3 (protein intake from each food group). The amount of mean daily protein intake was lowest in no-meat eaters (59·7 g/d) and highest in high-meat eaters (101·3 g/d), and sources of protein differed largely between no- to low-meat eaters and medium- to high-meat eaters. In high-meat eaters, 57·1 % of protein was derived from meat, but only 3·5 % in low-meat eaters. However, 37·7 % of protein consumed by no-meat eaters came from cereal products, legumes and potatoes, but only 15·2 % in high-meat eaters. Fish contributed most in low-meat consumers with about 9 %. Interesting to note is that the group ‘other sources of protein’ made up for 19 % of protein intake in no-meat eaters. Based on the recommendations of the nutrition societies in Germany, Austria and Switzerland (‘DACH’), protein intake was insufficient for 41·7 % of no-meat eaters, 32·4 % of low-meat, 19·9 % of medium-meat and 11·2 % of high-meat eaters from the menuCH study group.
Table 2 Total intake of protein-rich foods by meat consumption groups*
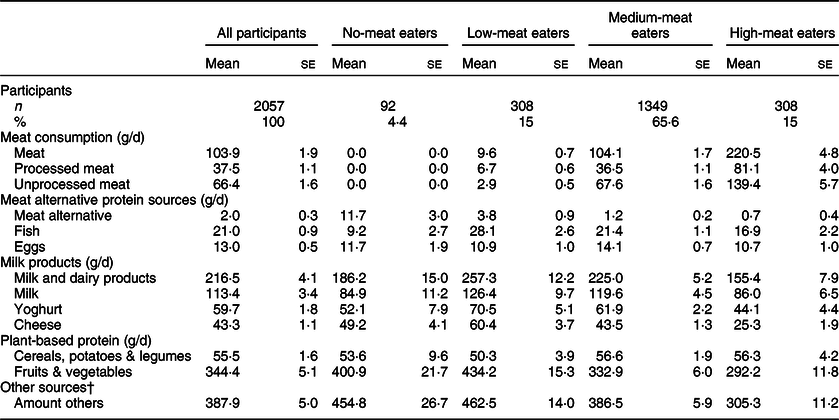
* Results are weighted for sex, age, marital status, major area, household size and nationality, seasonality and weekdays.
† Including sweets, desserts, cakes, salty snacks, nuts & seeds, plant-based milk alternatives, soups, sauces & spices, oils and supplements.
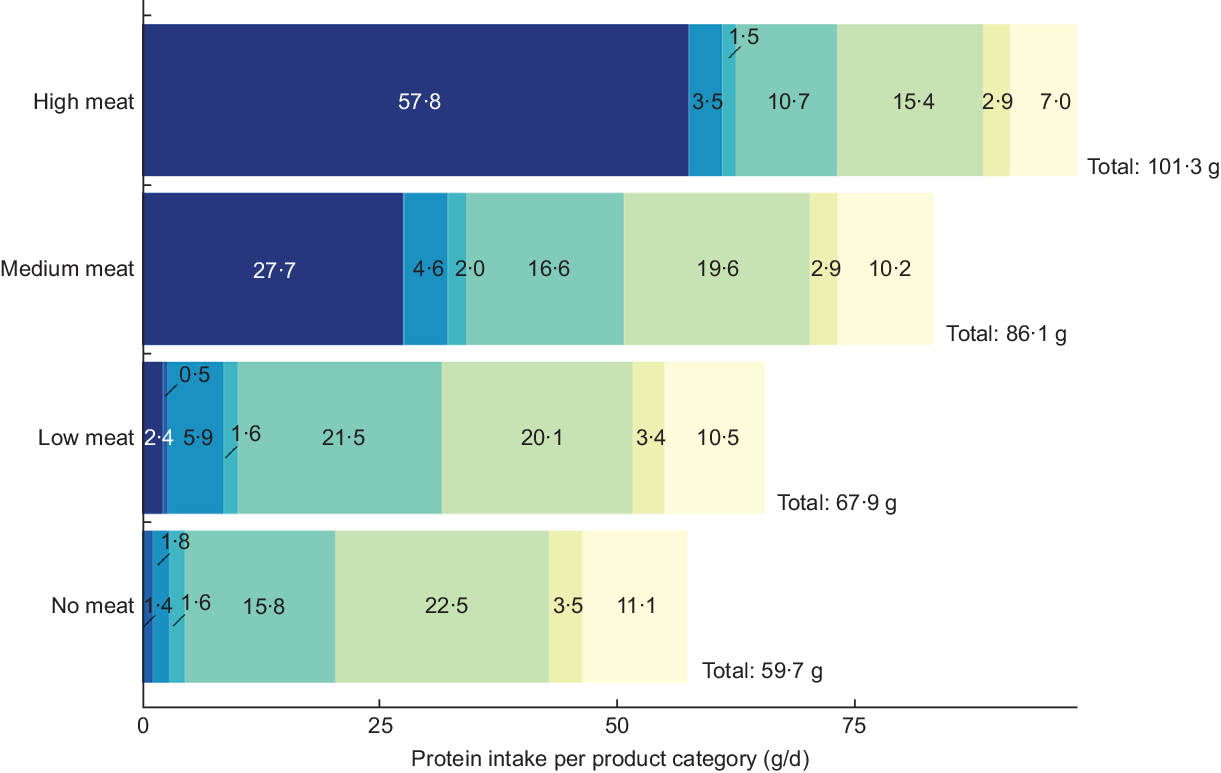
Fig. 3 Protein intake (in g/d) from protein-rich foods by meat consumption subgroups. ‘Other’ includes alcohol and dietary fibres. Numbers are weighted for age, sex, marital status, major region of Switzerland, household size, nationality, season and weekday. Protein category: ![]() , meat;
, meat; ![]() , meat alternatives;
, meat alternatives; ![]() , fish;
, fish; ![]() , eggs;
, eggs; ![]() , milk products;
, milk products; ![]() , cereals, potatoes, legumes;
, cereals, potatoes, legumes; ![]() , fruits & vegetables;
, fruits & vegetables; ![]() , others
, others
Association of meat consumption with sociodemographic, anthropometric and lifestyle determinants
Women were less likely to be high-meat eaters than men (Table 3). Young participants were less likely to be no-meat eaters, whereas non-Swiss participants were more likely to be high-meat eaters. Singles and participants of ‘other’ marital status (e.g. widowed) were more likely to be no-meat eaters. Participants with tertiary education were less likely to be high-meat eaters. Overweight and obese participants were less likely than normal-weight participants to be no- or low-meat eaters, but more likely to be high-meat consumers. Participants with low physical activity were less likely to be low-meat eaters compared with participants who were moderately active. Finally, users of dietary supplements were more likely to be no- or low-meat eaters than those individuals who did not report using supplements.
Table 3 Association between dietary patterns and sociodemographic and lifestyle factors†
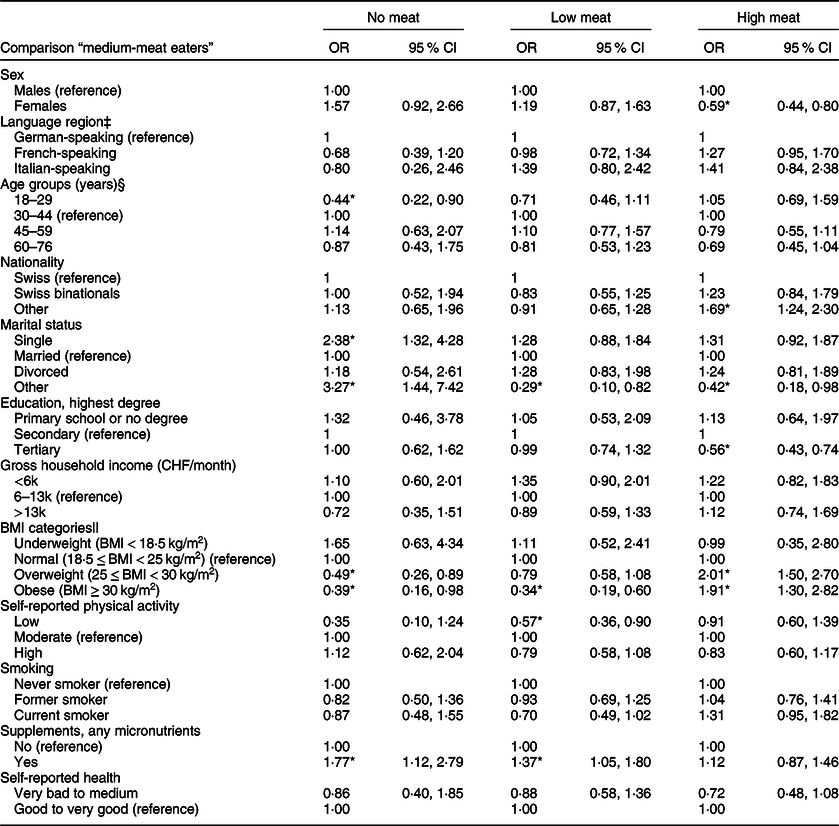
24HDR, 24-h dietary recall; CHF, Swiss Francs.
† Results of the multinomial regressions are adjusted for all variables presented in this table and for energy intake, season and weekday, and weighted for sex, age, marital status, major area, household size and nationality.
‡ Age groups are based on the self-reported age on the day; the dietary and physical activity behaviour questionnaire was filled.
§ German-speaking region includes the cantons of Aargau, Basel-Land, Basel-Stadt, Bern, Lucerne, St. Gallen and Zurich; French-speaking region: Geneva, Jura, Neuchatel and Vaud; and Italian-speaking region: Ticino.
|| BMI was obtained from measured height and weight. Self-reported weight or height was used when measurements were impossible. For lactating and pregnant women, self-reported weight before pregnancy was used to calculate BMI.
* P-value < 0·05.
Discussion
This analysis of the first Swiss National Nutrition Survey highlights differences in sociodemographic, anthropometric, behavioural and dietary factors between participants with different meat-eating habits.
The prevalence of no-meat eating in our study (4·4 %) was somewhat lower than the figure previously reported by Chatelan et al. (4·9 %), who only considered self-reported meat avoidance (lifestyle questionnaire), but not the 24-HDR results(Reference Chatelan, Beer-Borst and Randriamiharisoa4). According to the Swiss Health Surveys, the percentage of self-declared no-meat eaters increased from 1·9 % in 1992 to 2·7 % in 2012(Reference Schupbach, Wegmuller and Berguerand21). In 2017, a representative study including 1296 participants aged 15–74 years old was conducted in the German- and French-speaking parts of Switzerland by DemoSCOPE for the organisation Swissveg. Results showed 3 % of the participants reported to be vegans, 11 % vegetarians, 17 % flexitarians and 69 % regular meat consumers(22). However, the percentage of self-reported strict vegans and vegetarians was only 1·5 and 6·8 %, respectively. These results are higher than those computed from menuCH, which might be due to differences in methods. Indeed, the Swissveg survey consisted of self-reported dietary preference without assessment of food consumption(22), likely overestimating the percentage of vegans and vegetarians.
Our result for the prevalence of no-meat eaters is largely comparable with data from Germany; in a representative German study, 4·3 % of the participants reported a vegetarian diet with a higher prevalence among women (6·1 %) than men (2·5 %)(Reference Mensink, Lage Barbosa and Brettschneider23). However, no-meat eaters in our study included vegetarians and pescaterians. The German and Swiss figures are higher than those observed in the most recent French survey INCA 3 (2015–2017), in which 1·9 % of the participants declared to follow a vegetarian diet(24).
Total energy intake was largely comparable between the different meat-eating groups in our study, which was also seen in the German Nutrition Survey NVS II(Reference Koch, Heuer and Krems25) and in the NutriNet-Santé study(Reference Alles, Baudry and Mejean26). However, in our survey, the sources of energy differed between the groups, such that protein intake contributed between 11·5 and 19·4 % to total energy intake, being lowest in no-meat eaters and highest in high-meat eaters, which is comparable with results from the EPIC-Oxford and the NutriNet-Santé cohorts(Reference Alles, Baudry and Mejean26,Reference Davey, Spencer and Appleby27) . In all of these studies, the contribution to total energy was highest from carbohydrates for no-meat eaters. In the UK Biobank cohort, regular meat eaters consumed about a quarter of their total energy intake from high-protein source foods (meat, fish, milk, cheese, yoghurt, eggs, legumes, nuts and vegetarian alternatives), whereas vegetarians consumed about 20 % and vegans around 15 % of total energy from these foods(Reference Bradbury, Tong and Key28).
In the NutriNet-Santé Study, vegans and vegetarians had a mean protein intake of 62 and 66 g/d, respectively, and regular meat eaters had an intake of 81 g/d(Reference Alles, Baudry and Mejean26); these results are largely comparable with the results in menuCH. In contrast, in the Adventist Health Study 2, total protein intake did not differ significantly between non-vegetarians and vegetarians(Reference Rizzo, Jaceldo-Siegl and Sabate29). In NVS II, no-meat eaters did not substitute meat with other animal-based foods but had higher intake of cereals, vegetables and soya(Reference Koch, Heuer and Krems25).
In the NutriNet-Santé cohort, 15 % of vegetarians and 27 % of vegans, but only 4 % of meat eaters had a protein intake below the acceptable distribution range(Reference Alles, Baudry and Mejean26). In our study, the respective percentages were much higher (ranging from 11 to 41 %). However, we used a different definition of protein sufficiency than in NutriNet-Santé (acceptable distribution range for proteins: 10–20 % below 70 years of age, 15–20 % above 70 years of age). In the EPIC-Oxford cohort, 16·5 % of male vegans and 8·1 % of female vegans did not meet the protein recommendations (based on a cut-off of 0·6 g/kg body weight), which was higher than the proportion among vegetarians, fish eaters and meat eaters(Reference Sobiecki, Appleby and Bradbury30). Independent of the definition, no-meat eaters were more likely to have rather low protein intake. To meet protein requirements, both quantity and quality of protein are crucial, due to overall lower biological value of plant proteins (except for soya) than animal proteins. Increased consumption of legumes (e.g. chickpeas) is highly recommended in low-/no-meat diets. In all studies, no-meat eaters tended to consume a larger variety of legumes, soya products and cereals, which leads to increased protein quality of a plant-based diet. However, even in non-meat eaters, legume consumption in menuCH was low compared with other studies (18·8 v. 33 g/d in NutriNet-Santé(Reference Alles, Baudry and Mejean26)).
Similar to previous studies, we observed that no- or low-meat consumers were more likely female, single and users of dietary supplements(Reference Koch, Heuer and Krems25,Reference Alles, Baudry and Mejean26,Reference Rizzo, Jaceldo-Siegl and Sabate29,Reference Hoek, Luning and Stafleu31) . Tertiary education was not associated with an increased odds of being no-meat consumers, but with a lower odds of high-meat consumption. Overweight and obese individuals were more likely to be high-meat consumers than individuals with normal BMI. Associations of meat consumption habits with BMI have been reported in other populations(Reference Koch, Heuer and Krems25–Reference Davey, Spencer and Appleby27,Reference Rizzo, Jaceldo-Siegl and Sabate29) , with meat consumers usually having higher BMI than no-meat consumers.
A major strength of our study was that the categorisation of participants into no-, low-, medium- and high-meat eaters was based on both self-declaration in the questionnaire and results from the 24-HDR. Originally, we planned to distinguish between ovo-lacto vegetarians and pescetarians, but due to low prevalence (1·8 and 2·6 %, respectively), we decided to combine these two groups. Only three participants were ‘true’ vegans based on 24-HDR interviews. Nevertheless, we cannot exclude misclassification of individuals within the category of meat eaters because dietary assessment was based on only two 24-HDR. However, the additional use of a question about food avoidance provided further information about the eating habits of the participants at the point of the first interview and enabled us to categorise the participants in no-meat and meat eaters. Using the Swiss Food Composition Database, we characterised the participants’ diet with respect to macronutrient intake but could not compute micronutrient intake as this database does not have micronutrient information for many foods. Hence, we were not able to assess nutrient (in-)adequacies with respect to crucial micronutrients such as Fe, Ca, vitamin B12 or folate. However, we used the Alternate Health Eating Index to evaluate overall diet quality. Lastly, our study was based on a representative sample of the Swiss population. However, due to self-selection of the participants, we cannot exclude that study participants are healthier than the general Swiss population.
This first characterisation of meat consumption patterns on a national level shows that 4·4 % of the Swiss population follows a no-meat diet. No-meat and low-meat eaters have a more diverse diet compared with medium- and especially high-meat eaters and differ by sociodemographic, anthropometric and health characteristics from high-meat eaters. However, despite replacement of meat sources with plant alternatives, total protein intake of the no-meat eaters is considerably lower than of meat eaters, which could be a health concern over the long term.
Acknowledgements
Acknowledgements: None. Financial support: This work was funded by the Federal Food Safety and Veterinary Office (What does the Swiss population eat? Characterization of food consumption, dietary patterns and lifestyle in the Swiss language regions, project 5.17.02ERN). Conflicts of interest: The authors declare no conflicts of interest. Authorship: Conceptualisation, L.S., S.R., J.-P.K., G.P. and J.S.; methodology, L.S., I.K., G.P. and J.P.K.; formal analysis, investigation and data curation, L.S., I.K. and G.P.; validation, I.K. and G.P.; writing—original draft preparation, L.S.; writing—review and editing, all.; supervision, S.R. and J.S.; project administration and resources, S.R.; funding acquisition, S.R., D.F. and J.S. Ethics of human subject participation: This study is a secondary data analysis using data that were completely anonymised. For the original study, ethical approval was obtained from the main ethics committee in Lausanne (Protocol 26/13, 12 February 2013) and by the corresponding regional ethics committees. Guidelines of the Declaration of Helsinki were respected, including written informed consent from the study participants.
Supplementary material
For supplementary material accompanying this paper visit https://doi.org/10.1017/S1368980020003079