


Childhood and adolescence are critical periods in the life course in terms of appropriate nutrition due to the increased nutritional needs for growth and development. Unhealthy dietary habits are of concern as they contribute to the epidemic of obesity, but can also contribute to inadequate micronutrient intakes. The impact of prolonged low micronutrient intakes can have negative health effects(Reference Iglesia, Doets and Bel-Serrat1), such as insufficient intakes of Fe and of the B vitamins and its association with different types of anaemia and with lower cognitive performances(Reference Camaschella2); Ca and vitamin D intakes as determinants of bone mineral content and density(Reference Stagi, Cavalli and Iurato3) granted that approximately 40 % of total bone mass is accumulated during adolescence. Additionally, in the longer term, food choices and eating patterns are established early in life(Reference Craigie, Lake and Kelly4). Adopting thus a healthful diet in childhood and adolescence may further help reduce the risk of non-communicable chronic diseases (NCD) in adulthood(Reference Kimokoti and Millen5).
Although the European food environment supplies an overabundance of energy and macronutrients, several national dietary surveys, such as the Dutch National Food Consumption Survey(Reference van Rossum, Fransen and Verkaik-Kloosterman6), the German Health Interview and Examination Survey for Children and Adolescents and the Spanish National Dietary Survey on the Child and Adolescent Population (ENALIA)(Reference Lopez-Sobaler, Aparicio and Gonzalez-Rodriguez7), indicate inadequate intakes for several micronutrients. It has been suggested that this phenomenon could be explained by changes observed in many industrialised countries regarding food consumption patterns and an increase towards the consumption of foods with a low micronutrient density (i.e., fast-food, sugar-sweetened beverages, salty snacks)(Reference Castro-Quezada, Roman-Vinas and Serra-Majem8,Reference Keast, Fulgoni and Nicklas9) . To help design effective interventions for achieving nutrient adequacy, it is valuable to know the types of foods that contribute substantially to micronutrient intakes.
In Greece, with the exception of certain studies carried out either at regional level(Reference Klimis-Zacas, Kalea and Yannakoulia10) or at national level but in limited age ranges(Reference Manios, Moschonis and Grammatikaki11), a survey examining dietary intake among representative sample of children and adolescents has not been conducted to date. The objectives of the current study were to: (i) provide updated estimates of the usual intake of twenty micronutrients – vitamins A, D, E, K, C, B6, B12, thiamin, niacin, riboflavin, pantothenic acid, folate, Ca, P, Mg, Fe, Zn, Cu, Se and potassium – for Greek children and adolescents aged 1–19 years using dietary data from the Hellenic National Nutrition and Health Survey (HNNHS); (ii) evaluate nutrient intake adequacy in the population and (iii) get insight into the main food sources of nutrients.
Methods
Study design and population
HNNHS was a population-based, nationally representative, cross-sectional study launched in Greece between September 2013 and May 2015, and it was designed to assess health and nutritional status of Greek children and adults. The survey methodology, which has been described previously, included a multistage probability sampling design based on the 2011 census data(Reference Magriplis, Dimakopoulos and Karageorgou12). Briefly, stratification was made according to geographical density by country periphery, age group and sex distribution. Infants <6 months old, pregnant/lactating women, people unable to speak the national language or unable to provide informed consent due to any cause (e.g., mental impairment) and people residing outside the country or a private household (e.g., nursing homes, prisons) were excluded. Data collection included an in-person interview using the Computer-Assisted Personal Interview (CAPI) method, which was administrated by trained interviewers at the participant’s residence, and a health examination appointment in the HNNHS mobile examination units performed by medical doctors and trained dietitians (approximately 1/3 of the trained interviewers). Written informed consent for inclusion was obtained from all participants or proxies before they participated in the study.
All children and adolescents aged 1–19 years who provided at least one 24 h recall were eligible for inclusion in the current study (n 842). From this eligible sample, recalls with extreme energy values (>25 104 kJ) were excluded from the main analyses (n 10). The plausibility of energy intakes (EI) for the remained recalls was assessed using the Goldberg’s cut-off method updated by Black(Reference Black13) according to the ratio of reported EI and predicted BMR. EI was the average value of EI for each 24 h dietary recall. BMR was estimated using Schofield’s age- and sex-specific equations(Reference Koletzko, Goulet and Hunt14) based on body weight and height. Consequently, after the exclusion of misreporters (over-reporters = 55; under-reporters = 209), the final analytic sample consisted of 577 plausible children and adolescents.
Dietary intake
Detailed information on dietary intake was collected by trained interviewers using a computerised 24 h recall which was designed based on the validated USDA Automated Multiple-Pass Method (AMPM)(Reference Blanton, Moshfegh and Baer15). Proxies, most commonly a parent, were used to collect dietary data for children aged 1–6 years and assisted with the dietary interview for children aged 7–11 years; adolescents aged 12–19 years reported their own dietary intakes. Estimations of the portion size were facilitated through the use of appropriate by age food atlases(Reference Foster, Hawkins and Simpson16,Reference van Kappel, Amoyel and Slimani17) and of standardised household measures (e.g., cups, glasses, grids) to ensure quality. Two 24 h recalls, the first in-person and the second by telephone, were conducted approximately 10–14 d apart. HNNHS was conducted for 22 months and thus encompassed all seasons. Values for energy and micronutrients were estimated using mainly the Nutrition Data System for Research (NDSR) (developed by the University of Minnesota), as well as Greek food composition tables for traditional Greek recipes (e.g., moussakas)(18).
Food grouping
To determine food sources of nutrients, it was first important to design the appropriate food grouping scheme. Food items were classified into thirty-eight food groups (listed in online supplementary material, Supplemental Table S1), each of which included foods of similar nutrient composition and culinary use. Composite foods (e.g., sandwiches) and recipes (e.g., moussakas) were disaggregated to their ingredients, which were further allocated to their appropriate food group; pizza, souvlaki and burger were not disaggregated, but instead they formed the ‘fast-food’ group due to their high EI and low micronutrient intake.
The percentage contribution made by any one food group to the intake of a given nutrient was estimated in the total sample. This was calculated by dividing the total nutrient provided by a specific food group by the total nutrient provided by all food groups and multiplying this by 100(Reference Block, Dresser and Hartman19).
Assessment of non-dietary variables
A general questionnaire, interview based, was used to record demographic data. Those data included sex, age and country of origin; family income was not used due to a high percentage of missing data (20·6 %). Furthermore, body weight and height were reported; when the participant was unable to self-respond (i.e., young age), a parent/guardian was asked to respond.
Statistical analysis
All statistical analyses have been performed based on the nature of the study (svy: in STATA 2013), for proportions and main group comparisons. To account for the survey’s complex design and to better reflect known strata in the population, a weighted average of the population (total population/sampled population) was obtained, accounting for the primary sampling unit (PSU = household). A P value < 0·05 was considered statistically significant.
The normality of the distribution of the continuous variables was tested using the Kolmogorov–Smirnov test. Continuous variables are expressed as the medians, 25th and 75th percentiles, whereas categorical variables are expressed as percentages (%).
Nonparametric Mann–Whitney test was used to compare sex differences for skewed variables and Student t test for continuous, normally distributed data. Chi square tests were conducted for categorical variables.
The National Research Council (NRC) method(20) was applied to estimate the usual intake distribution of twenty vitamins and minerals, after removing the effects of day-to-day (within subject) and subject-by-subject (between-subject) variability in dietary intakes. In brief, the NRC consists of four steps: (i) examining normality of intake distribution (log transforming if required); (ii) estimating the within- and between-person variances; (iii) adjusting individual subjects’ mean intakes to estimate the distribution of usual intakes and (iv) back transforming the adjusted data (if original data were transformed in step 1). The usual (adjusted) dietary intake (step 3) was calculated by the following equation(20):
 $$\eqalign{
& {\rm{Adjusted}}\,{\mkern 1mu} {\rm{intake}} = [({\rm{subject's}}{\mkern 1mu} \,{\rm{mean}} - {\rm{group}}{\mkern 1mu} \,{\rm{mean}}) \times {{{\rm{S}}{{\rm{D}}_{{\rm{between}}}}} \over {{\rm{S}}{{\rm{D}}_{{\rm{observed}}}}}}]\, \cr
& \,\,\,\,\,\,\,\,\,\,\,\,\,\,\,\,\,\,\,\,\,\,\,\,\,\,\,\,\,\,\,\,\,\,\,\,\,\,\,\,\,\,\,\,\,\,\,\,\,\,\,\,\,\,\,\,\,\,\,\,\,\,\,\,\,\,\,\,\,\,\,\,\,\,\,\,\,\,\,\,\,\,\,\,\,\,\,\,\,\,\,\,\,\,\, + group{\mkern 1mu} \,mean, \cr} $$
$$\eqalign{
& {\rm{Adjusted}}\,{\mkern 1mu} {\rm{intake}} = [({\rm{subject's}}{\mkern 1mu} \,{\rm{mean}} - {\rm{group}}{\mkern 1mu} \,{\rm{mean}}) \times {{{\rm{S}}{{\rm{D}}_{{\rm{between}}}}} \over {{\rm{S}}{{\rm{D}}_{{\rm{observed}}}}}}]\, \cr
& \,\,\,\,\,\,\,\,\,\,\,\,\,\,\,\,\,\,\,\,\,\,\,\,\,\,\,\,\,\,\,\,\,\,\,\,\,\,\,\,\,\,\,\,\,\,\,\,\,\,\,\,\,\,\,\,\,\,\,\,\,\,\,\,\,\,\,\,\,\,\,\,\,\,\,\,\,\,\,\,\,\,\,\,\,\,\,\,\,\,\,\,\,\,\, + group{\mkern 1mu} \,mean, \cr} $$where SDbetween is the square root of true variance of the distribution of usual intakes, and SDobserved is the square root of the variance in the observed daily intakes that is not accounted for by between-subject differences, both divided by the mean number of days of intake data per participant. In case that someone had only one 24 h dietary recall (24·4 % of plausible participants), the mean number of days of intake data was set to one.
The estimated average requirement (EAR) cut-off point method proposed by the Institute of Medicine (IOM) was used to assess the adequacy of vitamin and mineral intakes, except Fe, of children and adolescents(21). The IOM DRIs were used since they are regularly updated and frequently used compared with reference values provided by other scientific bodies of organisations(Reference Manios, Moschonis and Grammatikaki11). The EAR is the average daily nutrient level estimated to meet the requirements of 50 % of all healthy individuals in a particular life stage and group. The proportion of individuals in a group with usual intakes below the EAR provides an estimate of the prevalence of inadequate intakes in the group(21). For vitamin K, pantothenic acid and K, the proportion below the adequate intake (AI) was used to assess nutrient adequacy of groups, as there are no established EAR values. The AI is defined as a recommended average daily nutrient intake level, based on experimentally derived intake levels or approximations of observed mean nutrient intake by a group (or groups) of apparently healthy people that are assumed to be adequate. Regarding Fe, the proportion of menstruating adolescent girls aged 11–19 years with suboptimal intake was estimated by probability approach. This was performed since the underlying requirement distribution for Fe after menstruation varies with blood loss, and this needs to be accounted for when estimating nutrient inadequacy(22). For the probability approach method, an upper limit of Fe absorption of 20 % was accounted for to observed intake, since Greek children and adolescents have a diet rich in animal proteins.
Results
Characteristics of the studied sample are presented in Table 1. Participants were equally distributed to boys and girls (49·0 and 51·0 %, respectively, P = 0·587) and had a Greek nationality (96·0 %). In total, 75·6 % of the plausible Greek children and adolescents provided two recall days.
Table 1 Characteristics of 1- to 19-year-old Greek children and adolescents providing plausible dietary intake data in Hellenic National Nutrition and Health Survey
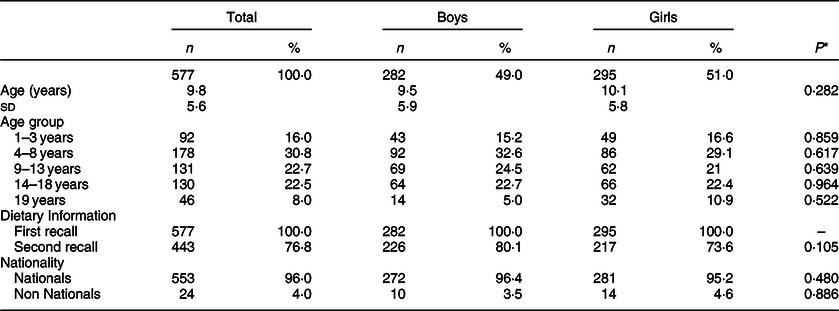
The symbol ‘–’ indicates that the test could not be implemented because there were insufficient data.
*P values are derived from t test to detect significant differences (P < 0·05) between sex groups.
The usual dietary intakes of vitamins and minerals are summarised in Tables 2 and 3, respectively.
Table 2 Usual intakes of vitamins stratified by sex and age group in 1- to 19-year-old Greek children and adolescents and percentage of the population having usual micronutrient intakes below the estimated average requirement: data from Hellenic National Nutrition and Health Survey

EAR, estimated average requirement; AI, adequate intake.
* AI and therefore the percentages of subjects below AI have been calculated.
† Data on pantothenic acid are subject to potential underestimation since values for this nutrient for specific Greek foods are lacking to date.
Table 3 Usual intakes of minerals stratified by sex and age group in 1- to 19-year-old Greek children and adolescents and percentage of the population having usual micronutrient intakes below the estimated average requirement: data from Hellenic National Nutrition and Health Survey
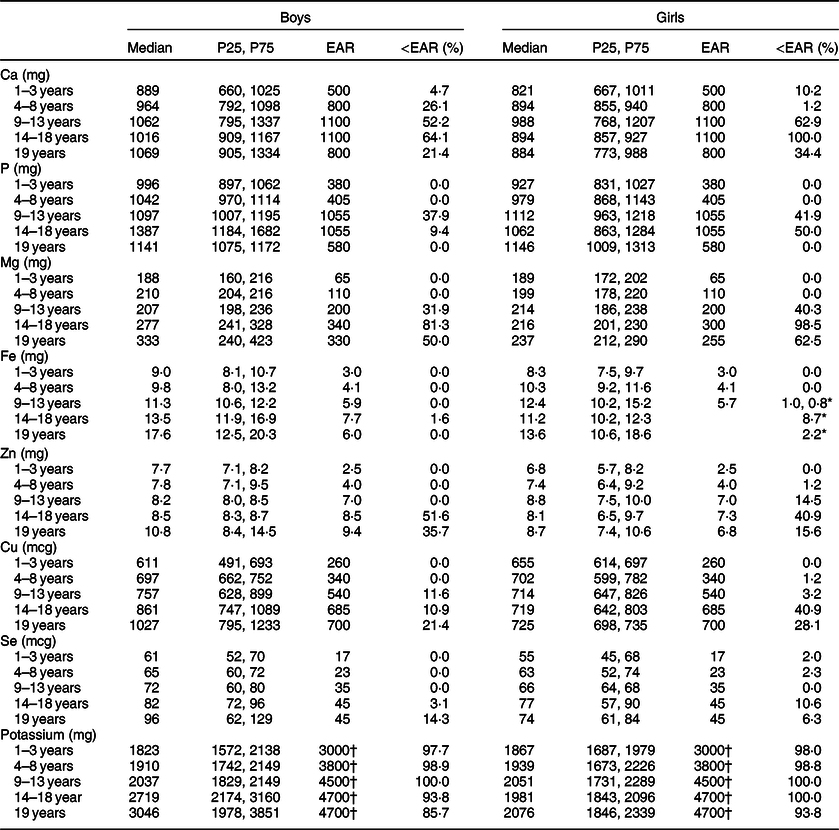
EAR, estimated average requirement; AI, adequate intake.
* EAR cut-off point method was used to estimate Fe inadequacy in 9–10 years girls, and probability approach in 11–19 years menstruating girls.
† AI and therefore the percentages of subjects below AI have been calculated.
Vitamins
In both sexes and all age groups, the percentage of the participants with a usual intake of vitamins D and K below EAR reached 100·0 %. Exceptions to this conclusion were boys aged 19 years for vitamin D (85·7 % inadequacy) and for vitamin K (85·7 % inadequacy) and females aged 19 years for vitamin K (75·0 % inadequacy). Nearly all children aged 1–13 years met the EAR for the fat-soluble vitamin A. Inadequate intake in vitamin A (>60·0 %) was recorded in the oldest age groups, with the subset of female adolescents 14–18 being far below the acceptable range (100·0 %). Similarly, the prevalence of vitamin E and pantothenic acid inadequacy was quite high among the sample. Greek children and adolescents met intake recommendations for the remaining water-soluble vitamins (thiamin, riboflavin, niacin and vitamins B6 and B12) in general. However, more than 50·0 % of the participants aged 9–18 years had folate intakes below the specific sex and age EAR. Additionally, more than 70·0 % of girls aged 14–18 years and boys aged 19 years had low vitamin C intake.
Minerals
The prevalence of inadequacy was extremely high for potassium in every subset of the population ranging from 85·7 to 100·0 %. Dietary inadequacy was also high for Ca and Mg, in the subset of adolescents aged 14–18 years. Also, approximately one out of ten girls aged 14–18 years reported intakes of Ca and Mg below the EAR (88·6 and 87·1 %, respectively). Regarding Zn, the prevalence of inadequacy was in general low, except the subset of male adolescents aged 14–18 years (51·6 %).
Dietary intake of P was sufficient for most age groups other than 9- to 18-year-old female participants and for 9- to 13-year-old males. Similarly, only the subset of females aged 14–18 years showed a slight inadequacy of Cu intake. Finally, the inadequacy percentages for Fe and Se were small ranging from 0·0 to 1·6 % in boys and 0·0 to 6·3 % in girls, and 0·0 to 14·3 % in boys and 0·0 to 10·6 % in girls, respectively.
The food sources of energy and the studied vitamins and minerals were ranked, and top ten sources are presented in Tables 4 and 5 for all Greek children and adolescents.
Table 4 Dietary sources of energy and vitamins among 1- to 19-year-old Greek children and adolescents: Hellenic National Nutrition and Health Survey

Table 5 Dietary sources of minerals among 1- to 19-year-old Greek children and adolescents: Hellenic National Nutrition and Health Survey

Energy and vitamins
Processed cereals were the major source of energy (17·9 %) for 1- to 19-year-olds, followed by milk (9·3 %) and fast-food (8·7 %). In general, processed cereals together with milk were the two highest ranked dietary sources of many vitamins. More specifically, processed cereals were found to be the prevailing source of folate (44 %), reporting the highest contribution of a food group to a vitamin, of vitamin A (21·9 %), thiamin (36·9 %), riboflavin (23·5 %), niacin (34·2 %) and vitamin B6 (23 %). Processed cereals were also among the top three sources of vitamins D (18·2 %), E (12·2 %), K (6·8 %), B12 (22·6 %) and pantothenic acid (12·2 %). Milk had the highest contribution to vitamin D (28·2 %), pantothenic acid (26·3 %) and vitamin B12 (26·4 %). Furthermore, the dairy products, milk and cheese, were important contributors to riboflavin (23·2 and 6·9 %, respectively). Cheese was also ranked as the third food source for vitamin A (8·4 %).
As far as wholegrain cereals are concerned, the specific food group was ranked as the second or third highest contributor of certain vitamins: thiamin (6·6 %), pantothenic acid (7·1 %), folate (16·3 %), vitamins B6 (10·6 %) and B12 (12·7 %). Non-starchy vegetables provided less than half of vitamin K intake (40·5 %); this group also provided 14·9 % of vitamin C. Fruit and fruit juices predominated as dietary sources of vitamin C (17·6 and 16·8 %, respectively). Lastly, salty snacks were the main food source of vitamin E (12·5 %).
Minerals
Processed cereals were the highest ranked dietary source of Mg, Fe, Zn, Cu and Se (15·5, 41·2, 20·7, 18·3 and 31·0 %, respectively). This food group was also ranked as second major source of P (12·5 %) and third major source of Ca (11·5 %). Milk was the first contributor to Ca, P and potassium (30·7, 20·9 and 16·4 %, respectively) and was also the second highest food source of Mg and Se (11·9 and 11·0 %, respectively). In addition, the dairy product cheese was placed among the top three contributors of Ca and P (13·3 and 9·1 %, respectively). Wholegrain cereals, red meat, water and fruits were recorded as the second higher food source of Fe (11·4 %), Zn (11·8 %), Cu (11·3 %) and potassium (11·4 %), respectively.
Discussion
Intake of twenty micronutrients among children and adolescents in Greece consumed from food and beverages were assessed in the present study. This was performed to estimate inadequacies that can possibly affect their growth and development. Excluding vitamin D, for which the major source is exposure to sunlight, a well-balanced and healthy diet should cover the needs of all vitamins and minerals assessed. The current study showed a high prevalence of inadequate micronutrient intake, as more than half of the population studied intakes were below the EAR reference values. Additionally, the current study provides insight in the major dietary sources of those nutrients. The intake of micronutrients was estimated by other studies in Greece, but this information either came from limited areas of the country, hence was not representative(Reference Roma-Giannikou, Adamidis and Gianniou23), or information provided include mostly vitamins and is limited in minerals(24).
Our study highlights the poor mean vitamin D intake, and the fact that the prevalence of inadequacy was over 97·0 % across all age and sex groups, with the exception of the 19-year-old boys. Such high prevalence of vitamin D along with the recommendations to avoid sun exposure needs to be further evaluated, since historically hypovitaminosis D has been associated with an increased risk of skeletal disease, including rickets in children, while increasing evidence supports an association between low intake of vitamin D and CVD, cancer and diabetes(Reference Pilz, Zittermann and Trummer25). Our results are in line with other European epidemiologic surveys conducted in Spanish children and adolescents(Reference Lopez-Sobaler, Aparicio and Gonzalez-Rodriguez7) and in European adolescents(Reference Diethelm, Huybrechts and Moreno26). This is due to the fact that vitamin D occurs naturally in a limited number of foods, specifically egg yolks and oily fish, such as salmon, cod liver oil(Reference Zhang and Naughton27) and these foods are consumed scarcely making it unrealistic to achieve the recommended dietary intake. Food fortification and the use of supplements have been reported to impact the % <EAR for vitamin D in Northern European countries(Reference Laaksi, Ruohola and Ylikomi28) and USA(Reference Bailey, Fulgoni and Keast29) and could set the basis for improving vitamin D status in Greece.
Vitamins K and E were also identified as nutrients of public health concern from the current analysis with inadequate prevalence rates ranging from 51·2 to 100 %. Regarding vitamin K, almost all individuals had intakes that were at risk. This prevalence is quite high relative to the HELENA study(Reference Diethelm, Huybrechts and Moreno26), although differences may be due to different eating patterns. More specifically, Manios et al. (Reference Manios, Moschonis and Grammatikaki11) concluded that 86·0–93·0 % of boys and girls in Greece aged 9–13 years did not meet the recommended portions for vegetables, which are the primary food source of vitamin K(Reference van Ballegooijen, Pilz and Tomaschitz30). This fat-soluble vitamin is important for the prevention of CVD and of osteoporosis, but to have a clear estimate of the problem blood pro-thrombin levels are required. Low vitamin K intake among Greek children and adolescents needs to be accounted for and programs focusing on higher consumption of greens are recommended. Regarding vitamin E, the findings of the current study are consistent with those reported by NHANES 2003–2006, which showed that 83·0 % of children and adolescents failed to meet the recommendations, except for those taking supplements(Reference Bailey, Fulgoni and Keast29). Similar data were observed in Spanish adolescents(Reference Lopez-Sobaler, Aparicio and Gonzalez-Rodriguez7). The importance of vitamin E is underlined by its antioxidant activity and its potential protective role against CVD, certain types of cancer and neurological disease(Reference Zingg31). Deficiency symptoms include a progressive neurologic disorder resulting in ataxia(Reference Traber32). Vitamin E deficiency is more frequently found in children compared with adults due to low body reserves and intense growth and development, making low vitamin E intake reported in the current study a major concern. Dietary consumption of nuts and seeds and vegetable oils is positively associated with increasing alpha-tocopherol concentrations. It must be emphasised that the present study assessed low intakes and not deficiencies; therefore, clinically relevant assessments cannot be made.
A substantial portion of adolescents had usual intakes below the EAR also for vitamins A and C. While the adequacy in the intake of those two vitamins has been reported from several European studies(Reference van Rossum, Fransen and Verkaik-Kloosterman6,Reference Lopez-Sobaler, Aparicio and Gonzalez-Rodriguez7) , data from the current analysis are comparable with the percentages reported for children and adolescents in the USA(Reference Berner, Keast and Bailey33). Vitamin A is required in a wide array of physiologic processes, including vision, immune function, cell differentiation, intercellular communication and reproduction(Reference Debelo, Novotny and Ferruzzi34). Vitamin A deficiency has been associated with increased rates of infectious diseases and of visual defects. As for vitamin C, in addition to its antioxidant properties, it is required in the normal functioning of immune system and improves the absorption of Fe(Reference Padayatty and Levine35). Severe deficiency of this water-soluble vitamin can result in scurvy and should thus be prevented. The observed low intakes of vitamins A and C among Greek adolescents could be related to the lower adherence to the Mediterranean diet(Reference Castro-Quezada, Roman-Vinas and Serra-Majem8), as reported also in a more recent study among young Greeks and Cypriots(Reference Kyriacou, Evans and Economides36). Increasing fruit and vegetable consumption may improve the intake of those micronutrients(Reference Polidori, Carrillo and Verde37).
Low folate intake among children and adolescents over 9 years raises concerns, especially for female adolescents of whom only 1·5 % had intakes above the EAR. Other nutritional studies have also reported problematic folate dietary intake by adolescents(Reference Lopez-Sobaler, Aparicio and Gonzalez-Rodriguez7,Reference Diethelm, Huybrechts and Moreno26) . Adequate intake among women of reproductive age is essential only for prevention of fetal neural tube defects during pregnancy, for nucleic acids (DNA and RNA) synthesis, for essential functions of cell metabolism and for the prevention of hyperhomocysteinemia and megaloblastic anaemia(Reference Iyer and Tomar38). Recently, Martiniak et al. (Reference Martiniak, Heuer and Hoffmann39) investigated the potential population dietary folate intake, based on the German National Dietary Survey II data, considering different food fortification levels and evaluated the percentage of the population meeting the recommended intake. The consumption of foods with a high fortification level led to a substantial decrease in the prevalence of inadequacy.
Children and adolescents aged over 9 years did not meet the recommendations for the water-soluble vitamin pantothenic acid, with boys aged 9–13 years and girls aged over 14 years showing the lowest adequacy. Surveys providing data on pantothenic acid are scarce in Europe(Reference Lambert, Agostoni and Elmadfa40). Foods rich in this nutrient include meat products, eggs, nuts and vegetables(41), and the low consumption of those foods by Greek children and adolescents could explain the low intakes of this vitamin. Pantothenic acid’s primary function is the synthesis of coenzyme A and acyl carrier protein, which are involved in carbohydrate, protein and fat metabolisms.
Regarding minerals, potassium intake was found to be below the EAR in almost the whole population regardless of age and sex. Some studies have reported an inverse relationship of potassium intake with blood pressure which is a risk factor for several cardiovascular outcomes(Reference Falkner42). Considering that dietary patterns established in childhood can set the scene for future food choices, it is important to encourage a diet for children that is high in potassium-rich foods. Similar results have been observed in other European children and adolescents(Reference Lopez-Sobaler, Aparicio and Gonzalez-Rodriguez7,Reference Diethelm, Huybrechts and Moreno26) .
The proportion of inadequate Ca and Mg intakes increased by age with the highest proportion (lowest intakes) observed in adolescents, especially among girls. Several published studies(Reference Lopez-Sobaler, Aparicio and Gonzalez-Rodriguez7,Reference Berner, Keast and Bailey33) have also shown underconsumption of these micronutrients by adolescents compared with the EAR. Adequate intake of Ca and Mg, the two most important minerals for skeletal development during adolescence, is crucial for decreasing the incidence of osteoporosis in adult life(Reference Stagi, Cavalli and Iurato3,Reference Palacios43) . Furthermore, it has been reported that one-quarter of female children and adolescents aged 9–18 years and male children aged 9–13 years follow a low P diet(Reference Palacios43), increasing the concern of the bone health for this population.
The EAR for many minerals was met by almost all children and adolescents, excluding Zn and Cu. Our data showed that approximately one-third of adolescent males had low usual Zn intake in agreement with similar median daily Zn intakes reported in the NDNS(Reference Whitton, Nicholson and Roberts44). This mineral is primarily found in animal products and seafood(Reference Foster and Samman45), and the low consumption of those food groups could explain the low intakes. Zn has a number of physiologic roles, and it is critical for immune function and normal growth(Reference Livingstone46). Mild Zn deficiency (clinical features not easily identifiable) is of great importance since it increases the risk for infection and poor growth. As for Cu, findings indicated that girls over 14 years were less likely to reach the recommendations. Cu is known to be important for the proper functioning of organs and several metabolic processes, and associations have been found between low Cu intake and bone malformation during development, risk of osteoporosis development in later life, increased frequency of infections, impaired development of cardiovascular system and alterations in cholesterol metabolism(Reference Bost, Houdart and Oberli47). Although Fe in most groups was adequate, Fe in adolescent girls was evaluated separately to account for blood losses. Intakes in approximately 10 % of adolescent girls were inadequate to meet their needs in comparison with 40 % of Australian counterparts(48). Other comparisons cannot be easily made, since the probability method has, unfortunately, not been extensively used. Of course, inadequate intake is not suggestive of deficiency; however, information from the current study suggests a need for nutritional intervention programs, to decrease potential deficiency risks in children and adolescents at the lower intake.
Faced with this high prevalence of inadequate nutrient intakes among children and adolescents, it was important to identify principal food consumption sources contributing to energy and micronutrient intakes. The current analysis showed that major sources of energy in young people’s diet are not necessary the same food groups that provide rich sources of nutrients. Five food groups including fast-food, desserts and sweets, baked products, salty snacks and sugar-sweetened beverages provided cumulatively 25·3 % of EI, with no noticeable contribution to other nutrients. In contrast, dairy products (milk, yogurt and cheese) accounted for 15·9 % of EI and provided a variety of nutrients, such as vitamin D, Ca and pantothenic acid. The conclusion that foods providing empty calories are highly ranked as sources of energy are consistent with reports that many children and adolescents do not follow dietary recommendations(Reference Keast, Fulgoni and Nicklas9). Another important issue highlighted in the current study is the high and consistent consumption of processed cereals, processed and ultra-processed food (e.g., fast-food, salty snacks, desserts and sweets) when identifying the main sources of each nutrient. Although these foods provide limited amount of nutrients, their high intake along with the low consumption of fruits, vegetables and other healthy foods make them primary contributors for many vitamins and minerals in children residing in Greece. The dietary nutrient profiles of these food items (high amounts of salt, added sugars, fat and/or additives) raise concerns as they lead in increased EI and weight gain, and they have been associated with increased risk of NCD across many industrialised countries(Reference Hall, Ayuketah and Brychta49).
One of the main strengths of the current analysis is that HNNHS is the first nationally representative survey in Greece, to our knowledge, and therefore its dataset can provide a robust basal analysis of the nutritional status of the Greek population. Adjustments for within- and between-subject variability to estimate usual intakes using the NRC method also strengthen this report. Also, with regard to the above, the assessment period of HNNHS covered all months of the year and all days of the week were included, thus the effects of intakes’ variability by season and of day-to day variability could be removed. Since 24 h recalls are prone to under- and over-reporting, misreporters were identified and excluded from the analysis. The age- and sex-groups differed significantly in their adherence to the EAR recommendations in nearly all nutrients (data not shown). Moreover, the use of standardised and validated procedures to record data (dietary intake, anthropometric and demographic characteristics) could be considered as another asset of the survey.
Some limitations of the study should also be noted. First, the small HNNHS sample size in young ages could be listed as one of the main limitations, despite the stratified sampling. Further, self-reporting of food intake data via 24-h recall introduces bias (e.g., such as misreporting because of respondent memory lapses, or miss-estimation of portion size consumed) to the dietary intake data(Reference Poslusna, Ruprich and de Vries50), even though misreporters were excluded. Another important issue is the lack of detailed Greek food consumption tables and the use of NDSR food and nutrient database for the current analysis, a database that includes nutrient composition for enriched/fortified foods available in Greece and specific brands that are consumed in both the USA and Europe. This was performed since validated Greek databases are not available. Lastly contraceptive use was not included in the survey’s questionnaires and no further analysis regarding Fe status among adolescent girls could be performed.
Conclusion
The present paper provides a detailed analysis of the current dietary intake of vitamins and minerals and their food sources among Greek children and adolescents. Identification of micronutrients of concern and major food contributors can help public health policy makers design and promote effective population-based strategies to increase nutrient density of the diet and decrease ultra-processed food consumption. Overall, nutrition professionals, in collaboration with teachers and parents, can educate children and adolescents on the Mediterranean pattern, taking into account regional and cultural differences, including lessons from MEDIS Study and from grandparents with family role recognised by ‘WHO action plan’. Additionally, the addition of fortification policy or supplements for some crucial nutrients would seem advisable but more in-depth evaluation is needed.
Acknowledgements
Acknowledgements: The authors are grateful to the: Contributors: Evangelia Fappa, Eleni-Maria Theodoraki, Eirini Trichia, Theodora-Eirini Sialvera, Aggeliki Varytimiadi, Eleni Spyreli, Antonis Koutelidakis, George Karlis, Stauroula Zacharia, Anna Papageorgiou, Advisory Committee: George P. Chrousos, Georgios Dedoussis, George Dimitriadis, Ioannis Manios, Eleftheria Roma and Field workers: Ioanna Adami, Aggeliki Anastasiou, Elisavet Anestiadou, Nikolaos Altanis, Georgios Arguropoulos, Euaggelia Arvanitidou, Anastasios Barounis, Alexandra Basdeki, Polychronis Bazakidis, Dimitra Borsa, Vasileia Chatzistergiou, Theodoros Chrysanidis, Konstantinos Daskalou, Chrysaugi Galanaki, Konstantinos Georgiou, Chrysanthi Gerasimatou, Arriana Gkouvi, Lampros Grampsas, Eleni Ioannidi, Vasiliki Kanaki, Eustratios Karagiannidis, Eirini Kasapidou, Vasiliki Katseni, Georgios Koktsidis, Eirini Konstantakou, Andronikos Kostakidis, Sotiria Kottara, Eleutheria Kourliti, Maria Kourtidou, Aikaterini Lymperopoulou, Nikoleta Markoglou, Aikaterini Markou, Anna Mauromanoli, Panagiota Merou, Areti Miha, Marianna Moira, Ioannis Moschakis, Dimitra Mougopetrou, Konstantina Mouliou, Andromachi Mourtzouhou, Vasiliki Moustakaki, Vissarios Moutsanas, Maria-Aggeliki Mpoulet, Evangelia Nanou, Ioannis Nikolaidis, Giannos-Aggelos Nikolaou, Sakellarios Panagiotakis, Eirini Panagiotou, Panagiotis Papadopoulos, Vasiliki Papageorgiou, Nikolaos Papaspanos, Olga Papazisi, Euthymia-Iro Pappa, Eufrosyni Patiraki, Konstantinos Petsanis, Maria-Christina Polychronopoulou, Nikolitsa Psylia, Alexandros Sachinidis, Avraam Sarafopoulos, Paraskevi Seferidi, Christos Sifnaios, Dimitra Stauropoulou, Myrto Stavrou, Chrysanthi Tatsi, Nena Theodoridou, Anna Theou, Christina-Yakinthi Tzotziou, Georgios Vergos, Agapi Vlachou, Anastasia Xatziapostolou, Iliana Xatzifragou, Adela Zana. Financial support: The study was co-funded by Greece and the European Union (European Social Fund) under the Operational Program ‘Human Resources Development 2007–2013’. Conflict of interest: None. Authorship: A.V.M. formulated the research question, designed the study, analysed the data and wrote the manuscript; E.M. supervised the statistical analysis and revised the manuscript; I.D., D.K., I.B., R.M., G.M., M.C., T.N., S.M.T., K.A., D.B.P. and A.Z. revised the manuscript critically and approved the final version. Ethics of human subject participation: The current study was conducted according to the guidelines laid down in the Declaration of Helsinki, and all procedures involving research study participants were approved by the Ethics Committee of the Department of Food Science and Human Nutrition of the Agricultural University of Athens. It was also approved by the Hellenic Data Protection Authority. Written informed consent was obtained from all subjects.
Supplementary material
For supplementary material accompanying this paper visit https://doi.org/10.1017/S136898001900449X


