


Trends in undernutrition indicators in Brazil show that the prevalence of stunting and undernutrition in children decreased significantly between 1974–1975 and 2008–2009(Reference Conde and Monteiro1). Improvements in purchasing power, women’s education, and access to health care, water and sanitation have all contributed to the decline of undernutrition in Brazil(Reference Monteiro, Benicio and Konno2). However, the condition is still present in more impoverished regions of the country(Reference Gubert, Spaniol and Segall-Corrêa3) and in low-income groups(Reference Conde and Monteiro1). On the other hand, overweight and obesity rates have increased in the same period(Reference Conde and Monteiro1). In fact, in the past 10 years, the obesity rate among adults living in Brazilian state capitals has increased by about 1 % each year(4), following rising obesity levels across the globe(Reference Gregg and Shaw5).
This scenario results in the loss of billions of dollars since malnutrition in all its forms impacts negatively on morbidity and mortality, educational outcomes and productivity(6). High BMI is among the largest contributors of lost disability-adjusted life-years worldwide and in Brazil(7). In terms of health-care costs, between 2009 and 2011, the total annual cost of hospital admissions and outpatient procedures in Brazil related to non-communicable diseases (NCD) associated with excess weight was $US 2·1 billion. Approximately 10 % of this cost was attributed to overweight and obesity(Reference Bahia, Coutinho and Barufaldi8). On top of that, out-of-pocket expenditure on medication in Brazil is 16 % higher in households with obese individuals(Reference Canella, Novaes and Levy9).
Although obesity levels are still higher in high-income countries in comparison to low- and middle-income ones, the gap between them is narrowing as rates of overweight and obesity are growing at a faster pace in low- and middle-income countries(Reference Gregg and Shaw5). The relationship of socio-economic status (SES) and race/ethnicity with obesity is largely known in high-income countries(Reference Krueger and Reither10). In low- and middle-income countries, however, such relationship is not as clear. While for women of low SES living in low- and middle-income countries, the shift of obesity seems to occur at an earlier stage of economic development than it does for men(Reference Monteiro, Conde and Popkin11), in the last three decades obesity grew relatively more rapidly among men living in low- and middle-income countries – particularly those aged 25–29 years – than for women and those living in high-income countries(Reference Gregg and Shaw5). In Brazil, an 8-year cohort study of government employees showed that women identifying as mixed-race or black and women and men who were less educated gained more than 1 kg/m2 during the evaluated period compared with those were white or had high education(Reference Chor, Andreozzi and Fonseca12).
Understanding to what extent both undernutrition and excess BMI rates are partnered by income, level of education and race/ethnicity supports the implementation of more equitable programmes and policies targeted at the continued fight against undernutrition and rising levels of overweight and obesity in low- and middle-income countries. In a context of comparing Latin American countries and describing a panorama of social inequalities of malnutrition in the region, the aim of the present study was thus to describe malnutrition in all its forms (undernutrition and excess weight) by income, level of education and race/ethnicity in Brazilian children, adolescents and adults. We hypothesized that higher undernutrition and excess BMI levels would be found in children, adolescents and adults of low income, low level of education and racial/ethnic minorities in Brazil.
Methods
Data source and sample
The present study used available data of the Brazilian Household Budget Survey (HBS) conducted by the Brazilian Institute of Geography and Statistics between May 2008 and May 2009.
The 2008–2009 HBS is nationally representative and involved a probabilistic sample of 55 970 Brazilian households, based on a complex sample plan using two-stage cluster sampling, with random selection of census tracts during the first stage and of households in the second stage. For the selection of the census tracts, the 12 800 census tracts of the Master Sample of Household Surveys (a tool used by the Brazilian Institute of Geography and Statistics in all national household surveys since 2006) were grouped to obtain household strata with geographic and socio-economic homogeneity. Geographical location of the census tracts (region; state; urban or rural area) and education of the heads of households (years of schooling) were considered for this grouping. The number of census tracts and households selected inside each one was proportional to the total number(13).
We used data for all children aged <5 years, adolescent girls and boys aged 11–19 years and adult women and men aged 20–49 years (131 132 individuals; 47 945 households) and sociodemographic data. The reason for analysing these population groups was to allow the comparison with data from other Latin American countries.
Assessment of nutritional status
The survey provided data on weight and height measured using standard techniques by trained researchers(13). Weight was measured using portable electronic scales with a maximum capacity of 150 kg and graduations of 100 g, and recorded in kilograms. Height was measured in centimetres using length for children under 24 months old and stature for those aged 25 months or above. Length was measured using infant anthropometers with a capacity of up to 105 cm and a scale in millimetres, and height was measured using portable stadiometers with a 200 cm-long retractable tape measure, accurate to the nearest 0·1 cm(13).
BMI was calculated as [weight (kg)]/[height (m)]2 for adults, and height-for-age Z-score (HAZ), weight-for-height Z-score (WHZ) and BMI-for-age Z-score (BMIZ) were calculated for children and adolescents. Following WHO recommendations, valid values were considered as: HAZ between <–6 and +6; WHZ between <–5 and +5; BMIZ between <–5 and +5; and BMI between 10 and 58 kg/m2(14–Reference de Onis, Onyango and Borghi16).
Nutritional status of individuals was classified using WHO recommendations for each age group, in order to evaluate malnutrition in all its forms (undernutrition and excess weight). Excess BMI indicators were overweight, obesity and excess weight. Overweight was defined as BMI between ≥25·0 and 29·9 kg/m2 for adults (20–49 years), BMIZ between >+2 and ≤+3 for children under 5 years and BMIZ between >+1 and ≤+2 for adolescents (11–19 years). Obesity was defined as BMI ≥ 30·0 kg/m2 for adults, BMIZ > +3 for children under 5 years and BMIZ > +2 for adolescents. Excess weight (overweight + obesity) was defined as BMI ≥ 25·0 kg/m2 for adult women, BMIZ > +2 for children and BMIZ > +1 for adolescents. Undernutrition indicators included wasting or underweight and stunting or short stature. Wasting was defined as WHZ < –2 for children, and underweight as BMIZ < –2 for adolescents and BMI < 18·5 kg/m2 for adults. Stunting was defined as HAZ < –2 for children and HAZ < –2 for adolescents; and adults’ short stature was considered if height was <1·49 m(14–Reference de Onis, Onyango and Borghi16).
Evaluation of social conditions
Individual characteristics included age, gender, per capita household income, education level (years of schooling of the head of the household for children and adolescents, and years of schooling of the women or men themselves for adults; grouped into low (0–6 years), medium (7–12 years) and high level (>12 years)) and self-reported race/ethnicity (white, black, mixed, Asian or indigenous).
Household characteristics and goods were also used to describe the population. We include data on presence of an earthen floor; use of firewood or charcoal for cooking (instead of a gas oven); access to public sewage system, public water connection and electricity; and motor vehicle (car, van, truck or motorcycle), television, computer (laptop or desktop), refrigerator and telephone ownership.
Data analyses
Characteristics of individuals, households and the ownership of goods were described for Brazil and according to tertiles of SES. Prevalence (%) and 95 % CI of excess BMI and undernutrition indicators were described by tertiles of household income, education level and race/ethnicity. Differences in proportions were tested using the test for linear combinations (lincom function in Stata).
Analyses were carried out using the statistical software package Stata/SE version 14.2 in the survey module, which considers the effects of complex sampling and enables the extrapolation of results for the Brazilian population, considering a 95 % CI and a 5 % significance level.
Results
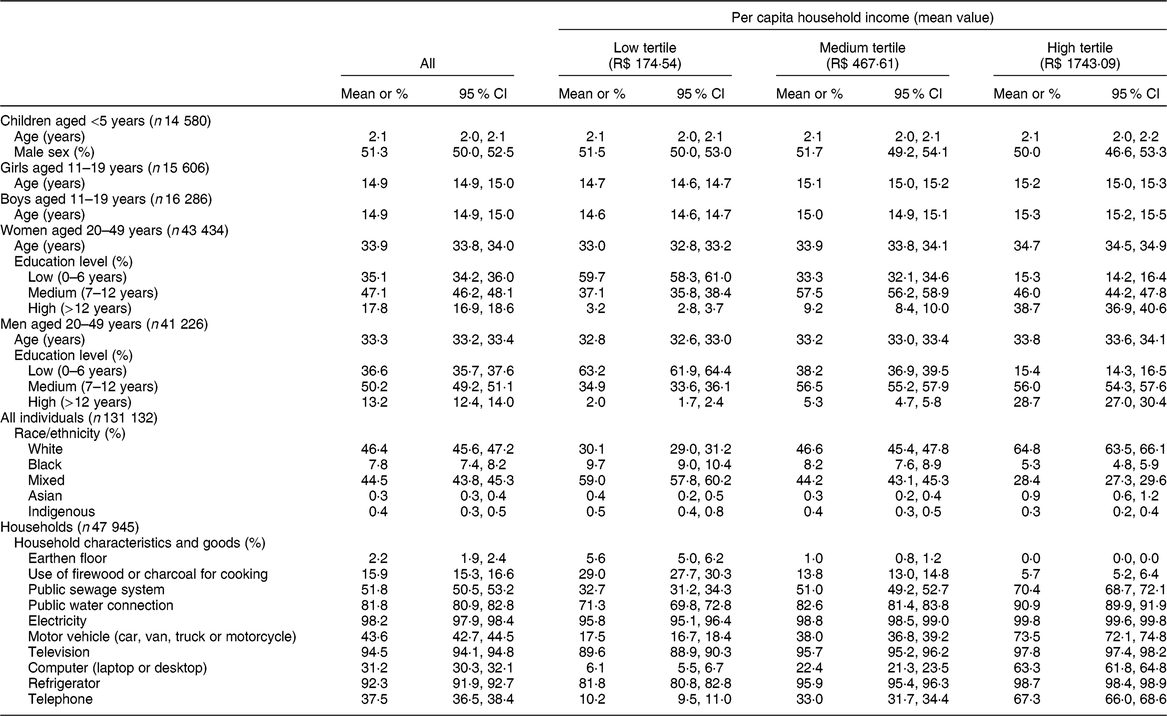
The sample was composed of 131 132 individuals (14 580 children aged <5 years; 31 892 adolescents aged 11–19 years; 84 660 adults aged 20–49 years). Characteristics of the studied population and characteristics and goods of their households by tertile of household income are presented in Table 1. Black and mixed-race individuals were more likely to be in the lowest tertile of household income.
Table 1 Sample characteristics by tertile of per capita household income in Brazil. Household Budget Survey 2008–2009
In children under 5 years, overweight prevalence was 10·1 % and obesity prevalence was 7·2 %. Wasting was present in less than 3·0 % of the children and stunting in about 6·0 %. Stunting, wasting and overweight rates were higher in low-income children. Stunting was higher, and overweight and obesity were lower, for those children whose head of household had low education level. Obesity was higher and wasting was lower in white children compared with black and mixed-race children (Table 2).
Table 2 Prevalence of malnutrition by income, education level and race/ethnicity in Brazil. Household Budget Survey 2008–2009

BMIZ, BMI-for-age Z-score; WHZ, weight-for-height Z-score; HAZ, height-for-age Z-score.
a–mP < 0·05 for difference between alow and medium income/education; blow and high income/education; cmedium and high income/education; dwhite and black; ewhite and Asian; fwhite and mixed; gwhite and indigenous; hblack and Asian; iblack and mixed; jblack and indigenous; kAsian and mixed; lAsian and indigenous; mmixed and indigenous.
* Overweight: BMIZ > +2 and ≤+3 for children aged <5 years; BMIZ > +1 and ≤+2 for girls/boys aged 11–19 years; and BMI ≥ 25·0 and <30·0 kg/m2 for women/men aged 20–49 years.
† Obesity: BMIZ > +3 for children aged <5 years; BMIZ > +2 for girls/boys aged 11–19 years; and BMI ≥ 30·0 kg/m2 for women/men aged 20–49 years.
‡ Overweight/obesity: BMIZ > +2 for children aged <5 years; BMIZ > +1 for girls/boys aged 11–19 years; and BMI ≥25·0 kg/m2 for women/men aged 20–49 years.
§ Wasting: WHZ < –2 for children aged <5 years. Underweight: BMIZ < –2 for girls/boys aged 11–19 years; and BMI < 18·5 kg/m2 for women/men aged 20–49 years.
‖ Stunting: HAZ < –2 for children aged <5 years; HAZ < –2 for girls/boys aged 11–19 years. Short stature: height < 1·49 m for women/men aged 20–49 years.
Prevalence of overweight in adolescent girls and boys was 14·7 and 15·4 %, respectively. Obesity prevalence was 3·7 and 5·1 %, underweight was 2·8 and 3·7 %, and stunting was 5·5 and 7·3 % for girls and boys, respectively. Obesity levels were lower in low-income girls and boys and in boys whose head of household’s education level was low, but underweight and stunting levels were higher in this group. The prevalence of obesity was higher, and the prevalence of stunting was lower, in white girls and boys compared with mixed-race and black adolescents, respectively (Table 2).
Overweight was present in about a third of adults aged 20–49 years (28·4 % for women and 36·6 % for men). Obesity rate was 13·8 %, over twice as much as the prevalence of short stature (5·7 %) and three times as much as the prevalence of underweight (3·9 %) in women. For men, the prevalence of obesity was 11·3 % while the prevalence of underweight and short stature was only 1·7 and 0·2 %, respectively. Prevalences of overweight, obesity and short stature were all higher in low-income and low-educated women. Obesity and underweight prevalences were higher among black women compared with mixed-race and white women. Short stature, however, was more prevalent in mixed-race women. The scenario was different for adult men. Prevalence of overweight and obesity was higher among those with high income and high education, while underweight was higher in low-income men. White men presented a higher prevalence of overweight and obesity compared with black and mixed-race men (Table 2).
Discussion
Based on representative data of the Brazilian population and analysing malnutrition in all its forms, we found a high prevalence of overweight and obesity in all age and SES groups across the lifespan. The prevalence of excess weight was at least threefold higher compared with undernutrition for children and adolescents. In adults, the prevalence of excess weight was at least sevenfold higher than that of undernutrition. Additionally, we found important social inequalities in the distribution of malnutrition for children, adolescents and adults. Higher prevalence rates of wasting/underweight and stunting were found in more disadvantaged children and adolescents. Lower-income, less-educated, as well as black and mixed-race women presented both more obesity and short stature compared with more privileged women. Noteworthy is the fact that black and mixed-race individuals were also more likely to be low-income individuals. On the other hand, higher-income, higher-educated and white men presented higher prevalence of overweight and obesity.
We found that more disadvantaged conditions (low income, low education and black and mixed-race people) were related to higher rates of undernutrition in children and adolescents in Brazil. These findings are in line with those from a study based on secondary data evaluating nearly 100 low- and middle-income countries nearly a decade ago. The authors found that lower SES was related to higher undernutrition rates and other unfavourable health outcomes, but not obesity(Reference Barros, Victora and Scherpbier17). In fact, the scenario observed in Brazil is consistent with that verified in a systematic review assessing the association between SES and measured obesity in low- and middle-income countries that pointed out that child obesity is predominantly a problem of higher SES groups in these countries(Reference Dinsa, Goryakin and Fumagalli18). Nevertheless, more recent findings show that upward mobility protects against obesity in Brazilian children and therefore low-income children may be more at risk of becoming obese when they get older(Reference Aitsi-Selmi, Batty and Barbieri19). On a brighter side, improvements in adolescents’ height in Brazil seem to protect them against overweight(Reference Conde, Rinaldi and Enes20). Considering race/ethnicity, Brazilian black and mixed-race children and adolescents had higher undernutrition and obesity rates. Similar findings have been reported in the USA(Reference Ogden, Carroll and Lawman21).
In our study, disadvantaged Brazilian women had both higher undernutrition and excess BMI levels than more affluent women, while higher prevalence of overweight and obesity was verified among more affluent men. In fact, almost 10 % of all low-income and low-educated women were considered to be of short stature, while excess weight ranged between 43 and 50 % among poorer, less-educated and black women. Similar values are observed in other countries, particularly in south-central Asia(Reference Black, Allen and Bhutta22). Results of a systematic review showed that in middle-income countries the association between obesity and SES is more likely to be inverse for women and it is variable for men, with countries showing an inverse or direct association(Reference Dinsa, Goryakin and Fumagalli18). However, in Brazil, the prevalence of obesity among adults is higher among those with lower education(Reference Malta, Andrade and Claro23) and did not seem to vary by race/ethnicity(Reference Malta, Moura and Bernal24). Black and mixed-race individuals had, though, a lower dietary quality(Reference Malta, Moura and Bernal24). In the USA, obesity levels are higher in racial/ethnic minorities such as Hispanics and non-Hispanic Blacks, particularly among women(Reference Flegal, Kruszon-Moran and Carroll25). Despite the complexity of race/colour self-identification in Brazil that may result in the aforementioned inconsistent relationships between race/ethnicity and health/diet outcomes, particularly among mixed-race individuals(Reference Berquó26), access to better education and consequently higher income and health care is undeniably lower in Brazilian black and mixed-race individuals(Reference Barros, Victora and Horta27–Reference Boccolini and de Souza Junior29). Such inequalities reinforce the need for improvements in measuring race and ethnicity in the country, which, in turn, will provide better evidence for the development of more equitable policies.
Our results point to and reinforce the importance of equitable measures to control undernutrition and curb rising rates of obesity.
In the past 30 years, the gap in child undernutrition rates by SES reduced in Brazil(Reference Monteiro, Benicio and Conde30), however the rate remained relatively high in disadvantaged groups and certain locations(Reference Benicio, Martins and Venancio31). Measuring the nutritional risk in disadvantaged populations such as quilombolas (direct descendants of Brazilian slaves), indigenous peoples and beneficiaries of the conditional cash transfer programme helps the formulation of tailored programmes and policies focused on their specific needs. In our study, the small proportion of indigenous people did not allow us to draw any conclusions regarding the nutritional status of this subgroup. Specific surveys reveal a high prevalence of undernutrition in these groups(32–Reference Jaime, Vaz, Nilson, de Sousa, Ximenes and Jaime34), who require tailored programmes, such as the Agenda for Intensification of Nutritional Attention to Child Undernutrition, implemented by the Brazilian Government in 2012(35).
If the scenario of undernutrition in Brazil is relatively optimistic, the causes of the decline in undernutrition reveal the success of equitable policies implemented in the country for more than a decade(Reference Monteiro, Benicio and Conde30). Unfortunately, for obesity, equity-promoting policies do not seem to be enough to detain the rising rates in the country. Obesity has multiple and complex causes and has been shown to be linked to the consumption of ultra-processed foods and beverages, demanding a set of intersectoral actions to control it(36–Reference Louzada, Baraldi and Steele39).
The WHO has proposed the implementation of double-duty interventions, programmes and policies with the potential to simultaneously act on malnutrition in all its forms, by reducing the burden of undernutrition, obesity and diet-related NCD. Such double-duty strategies can help countries achieve the goals of the UN Decade of Action on Nutrition and the Sustainable Development Goals(40), of which Brazil is a signatory.
Two central documents of Brazil’s Health Ministry for the malnutrition agenda were published in 2011: the National Food and Nutrition Policy (PNAN) and the Strategic Action Plan to Tackle NCDs. PNAN, first launched in 1999 and updated in 2011, has the purpose of improving the diet, nutrition and health of the population by promoting healthy and adequate eating habits, food and nutrition surveillance, and the prevention and comprehensive care of diet-related diseases. PNAN recognizes the importance of intersectoral measures to tackle food and nutritional insecurity and prioritizes undernutrition and obesity prevention and treatment, as well as diet-related NCD(36). The Strategic Action Plan to Tackle NCDs refers to the period of 2011–2022 and has the purpose of promoting the development and implementation of effective, integrated, sustainable and evidence-based public policies for preventing and controlling NCD. The fight against obesity is central to the Brazilian Strategic Action Plan to Tackle NCDs. One of the Plan’s goals is to reduce the prevalence of child and adolescent obesity and curb the growth of adult obesity(41).
The school environment is recognized as an important setting to deal with malnutrition. Two national programmes focused on the school environment in Brazil deserve to be mentioned: the National School Food Program and the School Health Program. The first one started in the 1950s but was recently improved, and aims to promote healthy eating habits in students and contribute to their development and school performance by offering free meals for all students enrolled in the public-school system(42). The second one is an intersectoral programme that offers activities developed by primary health-care professionals along with education professionals focused on assessing the students’ health conditions and on health promotion(43).
More recently, the updated Dietary Guidelines for the Brazilian Population, launched by the Ministry of Health in 2014, focus on the promotion of a healthy and sustainable diet to tackle malnutrition. The guidelines include the classification of foods based on the extent and purpose of industrial food processing and present the following central recommendation: ‘always prefer natural or minimally processed foods and freshly made dishes and meals to ultra-processed foods’(44,Reference Monteiro, Cannon and Moubarac45) .
Regardless of the successful measures that have helped reduce undernutrition and are now also focusing on promoting a healthy and sustainable diet and curbing obesity levels, regulatory measures – such as those that were successful in reducing the prevalence of smoking(Reference Moodie, Stuckler and Monteiro46) – are necessary to reduce the consumption of ultra-processed foods and tackle obesity. They need to target the access, pricing, labelling and promotion of ultra-processed foods, and contribute to make natural and minimally processed foods more readily available and affordable(47–Reference Colchero, Guerrero-López and Molina51).
Despite the implemented Brazilian programmes and policies related to malnutrition, the current national scenario (since 2017) is of political and institutional rupture. Austerity measures have been implemented which may affect Brazil’s social and nutritional policies. Thus, Brazil’s progressive and successful measures related to reducing undernutrition and the needed actions for tackling obesity are under threat(Reference Doniec, Dall’Alba and King52–Reference Malta, Duncan and Barros55).
Conclusion
In conclusion, overweight and obesity prevalence rates are higher than undernutrition rates in Brazilian children, adolescents and adults. Nevertheless, higher rates of both over- and undernutrition were in general found in low-income groups with lower level of education and racial/ethnic minorities, except for adult men. Public policies aimed at reducing undernutrition have been successful and must continue; however, the implementation of equitable measures to control and reduce obesity remains a challenge.
Acknowledgements
Acknowledgements: The authors would like to thank Latin American Nutrition Leadership Program (Programa LILANUT) for the coordination of the supplement ‘Malnutrition in all its forms by wealth, education and ethnicity in Latin America: who are more affected?’ and Carlos Augusto Monteiro for contributing ideas that have improved the manuscript. Financial support: The Fundação Carlos Chagas Filho de Amparo à Pesquisa do Estado do Rio de Janeiro (FAPERJ) (process number E-26.202.667/2018) provided funds for the publication of this manuscript. FAPERJ had no role in the design, analysis or writing of this article. Conflict of interest: The authors declare that there are no conflicts of interest. Authorship: D.S.C., A.C.D. and R.M.C. designed the research. D.S.C. analysed the data. D.S.C. drafted the paper with contributions from the other authors. All the authors read and approved the final manuscript. Ethics of human subject participation: This study used data from the Brazilian HBS, collected by the Brazilian Institute of Geography and Statistics, that are publicly available and de-identified.


