


The burden of undernutrition has declined progressively in developing countries, with the rate of reduction varying by region. The largest reductions have been in Asia, whereas a modest reduction in prevalence is documented in Africa( Reference Black, Victora and Walker 1 ). Ethiopia has documented a significant decline in the prevalence of both stunting and underweight over the past 14 years (between 2000 and 2014). For example, the prevalence of stunting decreased by 31 % (from 58 % to 40 %), while the prevalence of underweight decreased by 39 % (from 41 % to 25 %), between 2000 and 2014( 2 – 5 ). Although this is significant progress in the reduction of stunting and underweight prevalence, the current prevalence levels are still considerable. Based on the WHO recommended criteria for assessing the severity of stunting and underweight at the population level, the country is classified under a medium to high grade (prevalence range of 20–40 % for stunting and 10–30 % for underweight). To help ameliorate the current unacceptably high burden of undernutrition among children under the age of 5 years, the Government of Ethiopia has launched a national nutrition programme (June 2013–June 2015) prioritizing nutrition as a viable strategy for the country’s growth and development plans( 6 ).
Among other things, a reduction in the burden of child undernutrition requires nutrition programmes targeted on the basis of nutritional vulnerability and burden( Reference Ruel and Alderman 7 ). Targeting based on vulnerability and burden would help reach households that are most likely to benefit from these programmes. Targeting requires identifying specific locations of an at-risk population in a given geographical area. Identifying the area where a segment of a population at risk lives is central in assisting geographical targeting of an intervention and the optimal utilization of resources. This requirement is partially fulfilled through the application of spatial analytical approaches( Reference Pullan, Sturrock and Soares Magalhaes 8 ).
Spatial point process, one of the approaches to spatial analyses, utilizes the physical location of events within a given geographic area in order to determine whether events have a tendency to cluster and to delineate the locations of clusters. The clusters identified in using this analytical approach are areas having a higher risk than the expected risk for the underlying at-risk population( Reference Pullan, Sturrock and Soares Magalhaes 8 ). This approach assists in appropriate geographical targeting and determining the scale of planned interventions through identifying and delineating the physical locations, sizes and intensity of the clusters (high-risk areas).
With an ultimate aim of optimizing interventions, spatial approaches have been used extensively in dealing with public health problems such as infectious diseases, malaria, intestinal nematodes and diarrhoea( Reference Ashton, Kefyalew and Tesfaye 9 – Reference Schur, Hurlimann and Garba 13 ). For example, spatial approaches through an identification of the local clustering of malaria cases have been used to identify ‘hot spots’ of malaria cases in an area( Reference Bousema, Drakeley and Gesase 14 ) and to guide malaria control and response efforts( Reference Coleman, Coleman and Mabuza 15 ). The application of the spatial clustering approach also emphasized that a smaller proportion of households carried most of the case burden in an area. Studies have also reported that in areas where there is a clustering of malaria risk, interventions that are not targeted were highly inefficient( Reference Carter, Mendis and Roberts 16 ) and reduced programme effectiveness( Reference Brooker, Clarke and Njagi 10 ). Identifying the location of areas with high risks allows for targeted interventions, thus resulting in a greater impact( Reference Carter, Mendis and Roberts 16 ).
Although the approach is a vital input for disease control and the geographical targeting of locations, its application in the area of public health nutrition has been limited. Of the studies that have investigated aspects of undernutrition, few of them employed spatial analytical tools to examine spatial patterns and the clustering of undernutrition among children under the age of 5 years. The few studies to date also showed conflicting reports on the spatial structure of undernutrition indicators as measured by different anthropometric indices. The studies confirmed the existence of spatial patterns in the distribution of childhood undernutrition. However, the scale of clustering still remains unclear. Some indicated that the distribution of undernutrition is heterogeneous within a geographic area, varies between villages and households( Reference Madise, Matthews and Margetts 17 ) and is spatially structured( Reference Pawloski, Curtin and Gewa 18 , Reference Kandala, Madungu and Emina 19 ). Others argued against the evidence for clustering at the community level( Reference Morris 20 ) and identified the geographic extent of clustering only at a household or individual level( Reference Fenn, Morris and Frost 21 ).
In the present paper, we attempted to investigate the local spatial structure of stunting and wasting among children under the age of 5 years. More specifically, we aimed to: (i) evaluate whether undernutrition indicators (stunting and wasting) have a tendency to cluster; (ii) determine the physical location and scale of clustering; and (iii) determine the risk factors for the observed clustering. The results of the spatial analysis would be helpful in improving our understanding of the distribution of undernutrition indicators on a local scale, in addition to the applicability of this approach for designing targeted nutrition intervention programmes.
Methods
Study area
The present study was conducted in the Meskane Mareko District (38·45763°E, 8·042144°N), which is located in the Guraghe Zone approximately 130 km south of Addis Ababa, the capital city of Ethiopia (Fig. 1). The study district (Fig. 1) is about 513·65 km2 in size and houses a Rural Health Programme (BRHP) run by Addis Ababa University. The BRHP is a health and demographic surveillance system that collects data on vital and demographic events in the district.
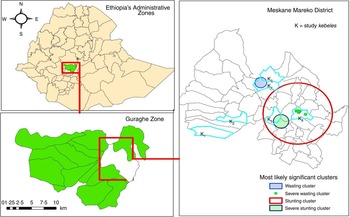
Fig. 1 (colour online) Geographic location of the Meskane Mareko District and the Guraghe Zone and the most likely significant clusters of stunting, severe stunting, wasting and severe wasting among children under the age of 5 years in the Meskane Mareko District, Ethiopia, 2014
Established in 1986, the BRHP includes one urban and nine rural communities (kebeles; a kebele is the smallest administrative unit in Ethiopia). The selection of these kebeles used a simple random sampling, but was based on a representation of the three agro-ecological zones (highlands, midlands and lowlands) of the district.
Study design and period
A community-based cross-sectional study design was employed, with the study conducted between December 2013 and April 2014.
Sampling and study population
The nine rural kebeles in the BRHP represent the three agro-ecological zones in the district. Each agro-ecology zone in the district is represented by three kebeles in the BRHP and we randomly selected two out of the three kebeles from each agro-ecology zone under the BRHP. We then collected data from all households residing in the six kebeles, namely Bati Lejano, Dobena, Shershera Bido, Yeteker, Dirama and Misrak Meskane. The locations of the six kebeles are indicated in the district map in Fig. 1.
The Bati Lejano and Dobena kebeles were from the lowlands, the Dirama and Misrak Meskane kebeles were from the midlands, and the Shershera Bido and Yeteker kebeles represented the highlands. The socio-geographic profiles of these kebeles are provided in the online supplementary material (supplemental file S1, Table S7).
The Butajera surveillance programme within the six selected kebeles included 4077 households. Out of these, 737 households were excluded from the study for the reason of being vacant or the inhabitants being very old and unable to respond to our questions. Consequently, 3340 households were eligible for the current study.
We obtained the list of names and identification numbers (household codes) for the head of each of the 3340 households from the BRHP registry under the surveillance programme, with support from the BRPH field workers and supervisors. Moreover, all households with children under the age of 5 years were included in the current study.
Household survey and mapping
Anthropometric measurements
We collected anthropometric data from all children under 5 years of age. The weight of each child was measured using a digital weighing scale (Coline brand), which has a capacity of 150 kg and graduations of 100 g. In some cases, we used tare weighing (we weighed the mother with the child, followed by weighing the mother without the child; the difference between these two measurements was taken as the child’s weight).
We used locally constructed length/height boards to measure the length/height of children. Children who were under 2 years of age were measured in a lying (recumbent) position, with older children in a standing position. All length/height measurements were taken with a precision of 0·1 cm.
Due to the lack of vital registration systems, we used a local calendar of events to estimate the children’s month and year of birth which we developed with the help of local residents and research assistants( 22 ). All research assistants were required to apply the local events calendar for all children to estimate their age.
Standardization of anthropometric measurements
We recruited twenty research assistants who were residents in the study district. We formed ten teams of research assistants with each team composed of a female measurer and a male supporter. This team composition was chosen so that a male data collector could give support to the female measurer during the anthropometric measurement, to help carry the measuring boards and weighing balance during the household visits and to help ensure ‘safety’ during travelling far distances within a village.
Each team had initial practical sessions on measuring the weight and length/height of children, reading and recording the measurements, and evaluation of the performances. This was followed by standardization exercises on five of the selected children and their respective mothers. Each team measured the height of all five children independently and we calculated the technical error of measurement (TEM). The intra-pair and inter-pair TEM were computed to evaluate the variation in measurement within and between pairs, respectively( Reference Perini, de Oliveira and Ornelia 23 ). For each standardization exercise, we calculated the coefficient of reliability (R), which estimates the proportion of total variance that cannot be explained by measurement error( 24 , Reference Sicotte, Ledoux and Zunzunegui 25 ). We continued the standardization exercise roughly four times until the coefficient of reliability (R) reached 86 %.
On top of this exercise, it was shown that trained research assistants drawn from the community perform well with anthropometric measurements in community settings( Reference Ayele, Aemere and Gebre 26 ). The results on the standardization of height/length measurements are provided in the online supplementary material (supplemental file S2).
Data collection and instrument
We developed a questionnaire adapted from the Ethiopian Demographic and Health Survey. A range of sociodemographic and health data of children and respondents, such as the child’s age, sex, morbidity, the mother’s education, religion, marital status, occupation and others, was collected. Household data such as the ownership and size of land, type of house and construction materials, availability of radio, television, telephone, bed, chair and other household items, possession of domestic animals, and sanitation facility and source of water were also collected.
Household food security was measured using the Household Food Insecurity Access Scale (HFIAS) tool developed by the Food and Nutrition Technical Assistance Project( Reference Swindale and Bilinsky 27 ). Household food intake was qualitatively captured through asking about the consumption of food groups. In particular, we asked about the consumption of twelve food groups, including (i) meat, (ii) fish, (iii) vegetables, (iv) fruits, (v) eggs, (vi) potatoes and other roots/tubers, (vii) milk and milk products, (viii) beans, (ix) cereals/breads, (x) oil, fat or butter, (xi) sugar or honey, as well as (xii) other types of foods such as coffee and tea in the 24 h preceding the survey. Interviews were conducted primarily with mothers in the household since they are the ones who are usually responsible for caregiving and food preparation in a household.
Interviews were conducted by twenty research assistants, all of whom had similar experience in data collection. The data collection was overseen by two supervisors, with a comprehensive training given on anthropometric measurement, geo-referencing of houses using a Global Positioning System (GPS), the administration of items in the questionnaire and interviewing skills. The questionnaire was translated into the Amharic language (official language) by one of the authors (S.H.G.) and reviewed together with the research assistants who were residents in the study district. A pre-test was conducted in a nearby district with socio-economic characteristics similar to those in the study district.
Spatial mapping
The geographic locations and elevations of all households visited were determined by using a hand-held GPS (Garmin GPSMAP®).
Data entry and analysis
We used EpiData version 3·1 for data entry and the statistical software package Stata version 11·0 for cleaning and analysis.
Anthropometric analysis
Anthropometric indices (Z-scores) were calculated using WHO Anthro software version 3·2·2 based on the recent WHO reference standard. We calculated both moderate and severe forms of stunting (an indicator for chronic undernutrition) and wasting (an indicator for acute undernutrition) among children under the age of 5 years. Children were considered wasted or stunted if the Z-score for weight-for-height or height-for-age, respectively, was 2 sd below the median value in the WHO 2006 growth standard. Children were considered severely wasted or severely stunted if the Z-score for weight-for-height or height-for-age, respectively, was 3 sd below the median value in the WHO 2006 growth standard. We used a unique identifier created for each household and child to merge the anthropometric results with the remaining data set.
The HFIAS was used to classify households into food secure and food insecure. The HFIAS is based on nine occurrence questions on the household experience of food insecurity, which were asked with a recall period of four weeks preceding the survey. If a respondent responded ‘yes’ to any of the questions, a follow-up frequency-of-occurrence question was asked to determine the frequency of experience. The frequency of occurrence is classified as ‘rarely’ (if occurring once or twice), ‘sometimes’ (three to ten times) or ‘often’ (more than ten times). A food-secure household is one that experienced none of these nine questions (conditions) or just experienced the first condition (worrying about food) although with a frequency of one or twice over the past four weeks (‘rarely’)( Reference Coates, Swindale and Bilinsky 28 ).
Household-level mean dietary diversity score was generated using the sum of all foods (twelve food groups) eaten in the respective household during the day and night prior to the date of the survey( 29 ). Based on the reported number of food groups consumed, we classified households into two levels (‘lowest’ and ‘medium/high’) of dietary diversity. A household with a lowest dietary diversity score consumed three or fewer food groups. A household with a medium/high dietary diversity score consumed four or more food groups.
We applied a principal component analysis in order to construct a relative household wealth index. The variables included in the principal component analysis model were ownership and size of land, type of house and construction materials, availability of fixed assets such as a radio, television, telephone, bed, chair and other household items, possession of domestic animals, type of water source for drinking and cooking, and availability and type of latrine. We constructed a relative socio-economic status by dividing the resulting score into quintiles.
Analysis of spatial clustering
We prepared an attribute table containing information for each household such as the household’s identification number, the number of children under 5 years of age in each household (population), number of cases and household coordinates. This file was imported into ArcGIS 10·1 for visualization. The coordinates’ projection was defined using the World Geodetic System (WGS) 1984, Universal Transverse Mercator (UTM) Zone 37°N. The shape file created was exported to the software SaTScan™ version 9·1·1 (http://www.satscan.org) for cluster analysis.
An analysis of the spatial clustering of stunting and wasting was conducted in two steps based on the scale of analysis. The first step aimed at evaluating the existence of clustering on a smaller scale (within-kebele), and if present defined the characteristics of clusters such as sizes and locations. Each kebele was looked at separately to identify clustering. The second step aimed at examining the presence and locations of a significant cluster of undernutrition on a higher scale (intra-kebele) over the six selected kebeles.
We applied Kulldorf’s spatial scan statistics and used SaTScan™ version 9·1·1 to identify locations and estimate cluster sizes. The scan statistics evaluate whether undernutrition cases are distributed randomly over a defined space. If the process is not random, the scan statistics help to identify significant spatial clusters. A circular window is used by the Kulldorf spatial scan to identify significant clusters of undernutrition over the study area. The window size varies continuously from zero to any upper limit. In order to detect both small and large clusters, we set the upper limit of the window size at 50 % of the study population. This upper limit will ignore the clusters that have more than 50 % of the population. For each scanning window, a likelihood ratio test is conducted to test whether there is an increased risk of undernutrition within, as compared with the distribution outside, the window. We used a retrospective purely spatial Poisson probability model to identify and locate areas with high rates (clusters), while the Gumbel distribution was selected to generate accurate P values( Reference Kulldorff 30 ).
Analysis of the determinants of clustering
Although identifying the presence of clustering is the primary objective, it is recommended to perform a further analysis to help identify the underlying process that governs the observed clustering. The observed clustering might be due to the underlying aggregation of known risk factors that are not randomly distributed geographically (e.g. poor households, food-insecure households residing in a close neighbourhood) or the presence of spatial dependency (‘Tobler’s first law of geography’)( Reference Tobler 31 ). This law states that ‘everything is related to everything else, but nearby objects are more related than distant objects’.
For these reasons, a conditional logistic regression model was fitted using the statistical software package Stata version 11·0. We compared cases (stunted children) identified within the spatial cluster with cases outside the cluster. If there is a difference in one or more of known risk factors between the groups, we can hypothesize that the underlying aggregation of risk factors that are not randomly distributed geographically may be responsible for the observed clustering. If there is no difference, the observed clustering could be due to a function of either a spatial dependency and/or a non-random distribution of various risk factors.
The dependent variable is a binary variable and indicates whether a case (stunted or severely stunted) is present within the identified cluster or not (yes/no). The potential risk factors considered included child morbidity status (if the child has had cough, diarrhoea or fever in the past two weeks), place of residence (kebele), location, household, wealth status, availability of latrine, household food insecurity status and household dietary diversity. Those variables that were statistically significant at the 20 % significance level (P<0·2) during bivariate analyses were considered for the multivariate model.
Based on the adequacy of the number of cases found in a spatial cluster (as identified by the scan statistics), we were restricted to conducting the analysis only for cases of stunting and severe stunting. The numbers of cases for wasting (n 31) and severe wasting (n 7) identified in the spatial cluster were too small for further analysis.
Results
A total of 3340 households were visited for the study. Among these visited households, only 1784 (53·4 %) households had one or more children age under the age of 5 years. Among 1784 approached households, we had a response rate of 97·8 % (1744 households). Sixty-nine houses were not surveyed after repeated visits because of unavailability and a couple of refusals.
We took anthropometric measurements from a total of 2371 children residing in 1744 households. Most of our respondents (89·3 %) were mothers of the child (or children) included in the anthropometric measurement. The mean age of respondents was 33·3 years. Occupationally, 75·5 % were housewives and 10·2 % were merchants. Only 3·4 % of the respondents could read and write, while the great majority (75·5 %) were illiterate.
Nutritional status of children
The nutritional status by selected background characteristic of the study participants is shown in Table 1. Nearly equal proportions of male and female children were included in the study.
Table 1 Nutritional status of children under the age of 5 years according to two anthropometric indices (weight-for-height and height-for-age), by area of residence and selected background characteristics, Butajera, Ethiopia, 2014
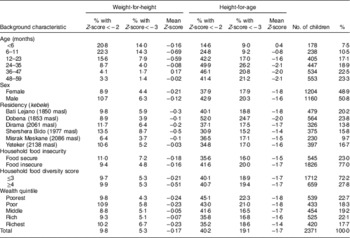
masl, metres above sea level.
Stunting (height-for-age)
Table 1 shows that the overall prevalence of stunting among children under the age of 5 years was 40·2 (95 % CI 38·2, 42·2) %, with 19·1 (95 % CI 17·5, 20·6) % of the children being severely stunted. We found the highest prevalence of stunting in children aged 24–35 months (49·9 %) and the lowest in children below the age of 6 months (14·6 %). A higher prevalence of stunting was documented among male children (42·9 %) than female children (37·9 %). The prevalence of stunting increased as the age of the child increased, whereas a higher proportion of children in the poorest wealth stratum were stunted (45·1 %) than children in the richest wealth stratum (35·2 %). The prevalence of stunting varied considerably among the six kebeles. The highest prevalence of 52·0 % was documented in Dobena kebele, which is located at a lower elevation of 1853 m above sea level.
Wasting (weight-for-height)
We found that the prevalence of wasting and severe wasting was 9·8 (95 % CI 8·6, 11·0) % and 5·3 (95 % CI 4·4, 6·2) %, respectively (Table 1). A smaller difference in wasting prevalence was found between male children (10·7 %) and female children (8·9 %). The highest prevalence of wasting was documented in Shershera Bido (13·5 %) and Dirama (11·7 %) kebeles. These kebeles are located at a comparatively higher elevation of ≥1977 m above sea level.
Clustering of stunting and wasting
We applied spatial scan statistics separately for the six kebeles in order to find out whether there was a distinct spatial cluster in the distribution stunting and wasting at a smaller scale (within-kebele).
We found most likely significant clusters only for wasting and severe wasting in two of the six kebeles (Table 2). In Dirama, a single cluster of thirty-one cases (18·2 expected) in 129 households was identified (relative risk (RR)=4·83, P<0·01). We found that children within this cluster were more than four times more at risk of wasting than children outside the cluster. In Bati Lejano, a smaller cluster of seven cases (0·88 expected) in fifteen households was identified (RR=10·31, P<0·01), and children within the cluster were ten times more at risk of severe wasting than children outside the cluster. The geographic size of the most likely clusters for wasting was higher than the size for severe wasting. The geographic size of the cluster for wasting and severe wasting was within a 1·18 km radius (2·36 km length) and 0·27 km (0·54 km in length), respectively. The geographical locations of these clusters are depicted in Fig. 1. We did not find any other most likely significant and secondary clusters in any of the remaining kebeles. The detailed results of spatial scan cluster statistics of the six kebeles and forms of undernutrition are provided in the online supplementary material (supplemental file S1).
Table 2 Purely spatial scan statistics of the most likely significant clusters for wasting and stunting among children under the age of 5 years, Butajera, Ethiopia, 2014

We further examined the presence and locations of significant clusters of undernutrition on a higher scale (intra-kebele) over the six selected kebeles. The result of the scan statistics indicated a most likely significant cluster for stunting and severe stunting. For stunting, a single large cluster size of 390 cases (304·19 expected) in 756 households was identified (RR=1·48, P<0·01), and children within this cluster were 1·5 times more at risk of stunting than children outside the cluster. For severe stunting, a single cluster size of 106 cases (69·39 expected) in 364 households was identified (RR=1·69, P=0·035) and children within this cluster were 1·7 times more at risk of severe stunting than children outside the cluster. The sizes of the most likely significant clusters were within a 10·81 km radius (21·62 km length) and 1·55 km (3·10 km length) for stunting and severe stunting, respectively. The clusters for severe stunting and severe wasting were located within the bigger cluster for stunting (Fig. 1). The calculated size of the cluster for stunting (using the geometry function of ArcGIS) was approximately 153·8 km2. This is about 30 % of the total area of the district.
Risk factors for spatial clustering
This analysis aimed to provide further insights into risk factors for the clustering of stunting and severe stunting and to evaluate whether the observed clustering exhibits a spatial dependency or is due to the distribution of various risk factors that are not randomly distributed geographically( Reference Pfeiffer, Robinson and Stevenson 32 ).
We found no difference with regard to child and household dietary-related factors such as child morbidity, household dietary diversity and food security status between stunting cases found in a spatial cluster (as identified by the scan statistics) and cases outside the cluster (Table 3). There were also no significant differences with respect to household socio-economic conditions and latrine availability between the groups. This finding indicates these factors are randomly distributed in the area and did not vary across cases (stunted children) identified within the cluster and cases identified outside the cluster.
Table 3 Risk factors for clustering of stunting and severe stunting among children under the age of 5 years in five kebeles, Butajera, Ethiopia, 2014

masl, metres above sea level; Ref., reference category.
Variables significant at the 20 % significance level were subsequently entered into multivariate logistic regression models, with the variable kebele excluded from the multivariate analysis of severe stunting due to absence of observations and comparison group.
***P<0·01.
The only factors that continued to be different were household locations (elevation of the houses and place of residence). Stunted children within an identified spatial cluster were positioned at lower elevations than those outside a cluster (P<0·05).
For severe stunting, we found significant differences with regard to household dietary diversity, food security status and latrine availability between cases of severe stunting found within a spatial cluster and cases found outside the cluster. For example, children within an identified spatial cluster were more than three times more likely to be food insecure than those found outside the cluster (P<0·01). Moreover, no differences were documented with regard to the elevation of the houses and place of residence between cases identified both within and outside a cluster.
Discussion
In the present paper, we report an analysis of the clustering of stunting and wasting among children under the age of 5 years. We aimed to evaluate the presence and sizes of clusters of stunting and wasting on different scales and whether the observed clustering is due to a spatial dependency or to a non-random distribution of risk factors. We found significant clusters of wasting and severe wasting in two of the six kebeles and a most likely significant cluster for stunting and severe stunting, and we also identified the physical locations and sizes of the clusters. Children identified within a cluster were more than four times more at risk of wasting, ten times more at risk of severe wasting, 1·48 times more at risk of stunting and 1·69 times more at risk of severe stunting than children outside the cluster.
The present study has established a significant spatial clustering of wasting and stunting on different scales. This finding indicates that the spatial distribution of wasting and stunting may not be a completely random process. Our study builds upon the findings on the spatial structuring of undernutrition measured by anthropometric indices on different scales, including the household and community level( Reference Madise, Matthews and Margetts 17 – Reference Kandala, Madungu and Emina 19 ). Little area-level clustering of undernutrition among children under 5 years has been reported elsewhere( Reference Morris 20 , Reference Fenn, Morris and Frost 21 ). Based on these findings, some hypothesized that the basis for the differences in nutritional status within a country is determined entirely by individual- or household-level characteristics( Reference Fenn, Morris and Frost 21 ). However, we have demonstrated that the difference in nutritional status could be determined beyond the individual or household level, and we also argue against the lack of area-level clustering of undernutrition among children under 5 years of age.
For stunting, the observed clustering seems to exhibit a spatial dependency, as we accounted for known influences. We did not find any significance difference in known risk factors between the cases identified within a cluster and those outside the cluster( Reference Pfeiffer, Robinson and Stevenson 32 ). However, we did not find a similar result for a cluster of severe stunting. There was also a difference in food security status and other factors between the cases identified within a cluster and for children outside the cluster. This may indicate that the observed cluster might be due to e.g. households that are food insecure residing in a close neighbourhood, rather than randomly over the study area. Thus, the observed clustering for severe stunting could therefore be due to a function of either a spatial dependency and/or a non-random distribution of various risk factors that we have not measured in the study( Reference Pfeiffer, Robinson and Stevenson 32 ).
Children at a lower elevation had a higher rate of stunting than the ones at a higher elevation, and we observed the highest stunting prevalence in Dobena kebele which is located at a comparatively lower elevation. The relationship between elevation and undernutrition risk is not consistent in the literature of Ethiopia. Although our finding indicates a higher prevalence in the lowland kebele, other literature has reported a higher rate of stunting among the highlands of Ethiopia( 2 – 5 , Reference Hagos, Lunde and Mariam 33 ). Even though the reasons for this observation are not documented, we hypothesize that the variation in determinant factors, livelihood context and differences in the socio-cultural constructs of the community at different elevations could be responsible for the observed variation.
Using spatial scan statistics, we have determined the size and delineated the physical location of clusters of stunting and wasting within the study area. Households identified in this cluster have a higher risk than the expected risk for the underlying at-risk population. The findings indicate that there is a defined micro-level variation in the risk for stunting and wasting within a given district. This variability in risk could be concealed if programmes rely exclusively on district-level averages. Understanding this pattern will have implications to guide intervention strategies.
Geographically targeting interventions, particularly to high-burden clusters, could result in gains( Reference Hoddinott 34 ). Geographical targeting of interventions requires stratifying areas according to levels of risks. As demonstrated in the present study, spatial approaches assist in the appropriate geographic targeting through stratifying areas with higher risk and delineating the physical locations. For example, in the current analysis we found that out of the total of 954 cases of stunting found in the six villages, more than 32 % (309 cases) were located within the identified cluster. The identified cluster is approximately one-third of the total area of the district. In addition, of the 309 stunted children (cases) found within the spatial cluster, most of 280 (71·8 %) were found in one village (Dobena kebele). Hence, this specific cluster is a high-burden location and an intervention targeted at this area would optimize resources, as well as improve programme coverage and effectiveness.
Geographically targeting interventions also requires lower leakages due to inclusion error and under-coverage( Reference Baker and Grosh 35 ). The results from spatial scan statistics reduce the errors of under-coverage and leakages as the approach identifies specific households within the high-burden cluster. This might help to improve the number of beneficiary households to be included in a programme, and consequently increase programme coverage. Given these advantages, we believe that a geographically targeted intervention would be feasible and applicable on top of the approaches focusing on the individual or household level( Reference Morris 20 , Reference Fenn, Morris and Frost 21 ).
Nevertheless, in practice geographic targeting is not without its limitations. A common problem that could arise from geographic targeting is the movement of local people to the targeted areas( Reference Baker and Grosh 35 ). As programmes or interventions are perceived as benefits by the community, more people may move to the targeted area insofar as seeking benefits and make the cost of a programme higher than expected. Another limitation that could arise from geographic targeting is that giving benefits to one area instead of another may prompt an objection( Reference Baker and Grosh 35 ) if communities are not well engaged in the design of a programme. In spite of these limitations, geographic targeting has potential to accelerate the reduction of undernutrition through improving programme effectiveness and optimizing the limited available resources.
We believe that the current analysis has its limitations. The spatial analysis employed a circular process rather than other windows to identify and physically locate significant clusters. The implication of choosing one of these is not yet clearly documented in the literature on child undernutrition; as a result the current analysis indicated a circular cluster. In reality, however, the most likely clusters could be elliptical or irregularly shaped, or a long and narrow cluster. This limitation has practical implications when planning geographically targeted interventions, since only including households physically found within the circular cluster might not be accurate. In addition to this, there are risk factors that we have not measured in the present study. The risk factors that are not measured could be responsible for the observed clustering of stunting. For this reason, the non-random distribution of risk factors not measured in the study might play a role in governing the clustering process.
Conclusion
In conclusion, the current work has employed a spatial approach to generate information on the spatial structure of stunting and wasting on different scales. Although the overall child undernutrition rates seem pronounced within the study area, we found locations with higher risks and burdens than others. Intervention planning based exclusively on the district-level average may mask micro-level variations in the risk and burden of undernutrition within a geographic area. Identifying high-burden areas would help in geographically targeting interventions. Hence, we recommend similar work in other contexts in Ethiopia and other developing countries to help validate and strengthen our results. We also recommend other studies aimed at analysing the possible risk factors of stunting and wasting, taking into account the observed spatial dependency.
Acknowledgements
Acknowledgements: The authors thank Dr Rachel Pullan for the technical support provided at the initial (design) phase of the study, and all the study participants for their willingness to participate in the study. Financial support: This work was supported by the Centre for International Health at the University of Bergen. The funding body had no role in the designing of the study, in the collection, analysis and interpretation of the data, in the writing of this manuscript and in the decision to submit for publication. Conflict of interest: The authors declare that they have no competing interests. Authorship: S.H.G. and B.L. designed the study. All authors participated in the data analysis and the drafting of the manuscript. All the authors read and approved the final manuscript. Ethics of human subject participation: The study protocol was approved by institutional review boards from the Addis Ababa University, College of Health Sciences. The study was also approved by the Regional Committee for Medical and Research Ethics, Western Norway (REK Vest). Information on the research objective was read to the participants and verbal informed consent was received. The privacy and confidentiality of the respondents were also maintained.
Supplementary Material
To view supplementary material for this article, please visit http://dx.doi./org/10.1017/S1368980015003377


