


Vitamin A deficiency is a global health problem, resulting in millions of preventable deaths in children below 5 years of age( Reference West, Klemm and Sommer 1 , 2 ). Vitamin A deficiency is usually associated with low socio-economic and poor anthropometric status( 2 – Reference Ahmed, Azim and Akhtaruzzaman 4 ). In South Africa, according to the South African Vitamin A Consultative Group, 33 % of children aged 6–71 months in 1994 were vitamin A-deficient based on a serum retinol concentration <20 μg/dl( 5 ). The prevalence of vitamin A deficiency ranged from 18·5 % to 43·5 %, being the lowest in the Northern Cape Province. The more recent National Food Consumption Survey in 2005 showed vitamin A deficiency to be more prevalent, with 64 % of children (1–6 years) having a serum retinol concentration <20 μg/dl( Reference Labadarios 6 ). The Northern Cape Province again had the lowest prevalence (23 %).
The three main internationally recognised strategies to address vitamin A deficiency are high-dose supplementation, food fortification and dietary diversification. A combination of these strategies, together with public health measures to reduce poverty and increase food accessibility, is considered to be the best approach( 3 ). In South Africa, there are currently two blanket approaches at national level, i.e. the national food fortification programme( 7 ) and the national vitamin A supplementation programme( 8 ). The national food fortification programme was introduced in 2003 and requires wheat flour and maize meal to be fortified with micronutrients, including vitamin A( 7 ). The vitamin A supplementation programme, introduced in 2002, targets 6–59-month-old children at public health facilities to receive a high-dose vitamin A supplement every 6 months( 8 ). While the vitamin A content of the child's diet and the rate of utilisation of vitamin A by the body determine the interval at which vitamin A is needed, a single dose of 60 000 μg retinol equivalents (RE; 200 000 IU) is considered adequate to protect the 12–59-month-old child against vitamin A deficiency for 4–6 months( 9 , Reference Swaminathan, Susheela and Thimmayamma 10 ). Vitamin A is stored mainly in the liver and this storage capacity helps to buffer against deficiency during periods of low intake( Reference Mahan and Escott-Stump 11 ).
Dietary diversification is considered the ideal and most sustainable solution for the eradication of micronutrient deficiencies, including that of vitamin A. However, dietary diversification takes a long time to implement and it can be many years before desired effects are evident, as it involves educating communities and families to increase their intake of vitamin A-rich foods, as well as promoting the cultivation of these foods( 3 ).
Nevertheless, there may be areas in South Africa where vitamin A-rich foods are already part of the population's natural diet. For example, a recent study in an impoverished community in the Hantam district of the Northern Cape Province showed 5·8 % of the pre-school children to be vitamin A-deficient (serum retinol <20 μg/dl), despite high levels of stunting, underweight and low birth weight( Reference Van Stuijvenberg, Schoeman and Lombard 12 ). This is in sharp contrast to the national prevalence of 64 %( Reference Labadarios 6 ). None of the children eligible for participation in that study had received a high-dose vitamin A supplement during the 6 months prior to the study and the virtual absence of vitamin A deficiency was presumably due to the consumption of sheep's liver( Reference Van Stuijvenberg, Schoeman and Lombard 12 ), an exceptional source of vitamin A( Reference Wolmarans, Danster and Dalton 13 ). Liver was found to be frequently eaten, but liver intake in this community was not quantified. The aim of the present study, undertaken in the same community two years later, was to quantify liver intake and hence vitamin A intake from liver. The contributions of the national food fortification programme and the national vitamin A supplementation programme to vitamin A intake were assessed as secondary aims.
Methods
Study population and design
The present cross-sectional study was conducted among 24–59-month-old children living in Calvinia West, the disadvantaged section of the town Calvinia, which is situated in the Hantam district of the Northern Cape Province. Sheep farming is the main industry in the Hantam area and there are two abattoirs situated on the outskirts of the town where slaughtering takes place on a daily basis.
A map was obtained from the local municipality and all households in Calvinia West were visited. To be included in the study, children had to be aged between 24 and 59 months and had to have lived in Calvinia West from the age of 6 months (or younger). The caregiver had to be the biological mother of the child. All residents who were willing to participate in the study and who fit the inclusion criteria were eligible for inclusion. Only one pre-school child per household was selected. If there was more than one child per household in the age category 24–59 months, convenience sampling was applied, i.e. choosing the child who was available or the child whose age would ensure equal distribution across age categories. Of the 182 mother–child pairs selected to participate, twenty-eight mothers were not interested, three were under the influence of alcohol at more than one visit, and one mother moved to another area after an appointment was made for an interview. Collection of data took place between May 2010 and August 2011.
The study was approved by the Committee for Human Research, Faculty of Medicine and Health Sciences, Stellenbosch University (ref. no. N10/03/068) and permission was obtained from the provincial and national Departments of Health. Written informed consent was obtained from the mother of each participant.
Measurements
Sociodemographic information
All data were collected by a member of the research team by means of an interviewer-administered questionnaire to the mother of the child. Interviews were done in the local language, Afrikaans. The questionnaire included information on household size and income, period the participant had been residing in the study area, as well as the education level and employment status of the mother.
Information on vitamin A supplementation
Information on vitamin A supplementation (dosage and date) received at the clinic was obtained from the Road-to-Health Chart and local clinic records where possible. According to the national vitamin A supplementation programme, children aged 1–5 years are scheduled to receive a 60 000 μg RE (200 000 IU) dose once every 6 months( 8 ). Only vitamin A supplements received during the 6 months prior to the assessment date were used for the purposes of calculating vitamin A intake via the supplementation programme. The daily dose was calculated by dividing the 60 000 μg RE vitamin A by the number of days (n 183) in 6 months.
Dietary intake of vitamin A
Vitamin A intake was assessed by means of a single 24 h dietary recall, which was completed by interviewing the mother of the child and/or the person who was responsible for feeding or preparing the child's food on the previous day. All food and drinks that were consumed during the previous day, as well as portion sizes, were recorded. Food models and household utensils were used to determine portion size. The 24 h recall was used to calculate total vitamin A intake, the vitamin A intake derived from liver, as well as the amount of vitamin A received via the fortification programme. The 24 h recall was also used to calculate a dietary diversity score (the number of food groups consumed over a 24 h period)( Reference Steyn, Nel and Nantel 14 ).
An adapted quantified FFQ, focusing on liver and liver products, and previously piloted in the study area, was completed to obtain information on habitual liver intake. This included frequency of liver consumption over at least a 1-month period; portion size; age at which liver was introduced into the child's diet; source from where liver was obtained; and the effect of season on liver intake.
Each food item obtained by the 24 h recall and liver frequency questionnaire was coded using the Medical Research Council Food Quantities Manual ( Reference Langenhoven, Conradie and Womarans 15 ) and the Condensed Food Composition Tables for South Africa ( Reference Wolmarans, Danster and Dalton 13 ). The data were then analysed to obtain daily nutrient intakes using the 2010 updated South African Food Composition Database (SAFOODS)( 16 ). All dietary assessments and coding were done by the local dietitian, specifically trained for this purpose.
Anthropometric status
Weight of the children was measured to the nearest 0·05 kg, using an electronic load cell scale (UC-321 Personal Precision Health Scale; A&D Company, Ltd, Tokyo, Japan). Measurements were done in light clothing and without shoes. The scale was calibrated daily with an object of known weight. Height was measured in a standing position, using a portable SECA 214 Leicester Height measure (Invicta Plastics Limited, Leicester, UK). Measurements were taken without shoes or cap, to the nearest 0·1 cm. All measurements were taken at the time of the interview. Height-for-age, weight-for-age and weight-for-height Z-scores were calculated using the 2006 WHO growth standards( 17 ) and the Anthro Plus software program.
Statistical analysis
Data were analysed using the statistical software package IBM SPSS Statistics version 19. Continuous data were expressed as means and standard deviations or as medians and interquartile range, and categorical data were reported as numbers and percentages. The Mann–Whitney U test (two-sided) was used to compare liver intake of the higher socio-economic categories with the lower socio-economic categories. P values below 0·05 were considered statistically significant.
Results
In total, 150 mother–child pairs were interviewed. The characteristics of the children and mothers are displayed in Table 1. The mean age of the children was 3·5 years, with the children equally distributed over age and gender categories. Stunting, underweight and wasting were prevalent in 36·9 %, 25·5 % and 12·1 % of children, respectively. The mean age of the mothers was 30 years, ranging between 17 and 49 years. The majority of the mothers (85 %) had been living in the study area for more than 10 years, with 65·3 % having lived there all their lives. The number of people per household ranged between two and fourteen, and in 43·3 % of households the number of people exceeded six. Only 25·3 % of the mothers completed high school; none had a post-school qualification. A quarter (24·7 %) of the mothers were employed at the time of the study, while 64·0 % were unemployed during the 12 months prior to the study. None of the mothers was employed in a professional capacity and 13·3 % did unskilled labour. The average monthly income per household was R3381 ($US 338), with 12·1 % having an income below R1000 ($US 100) and 14·8 % an income of R5500 ($US 550) or more (exchange rate: R10 (South African Rand) = $US 1 as at June 2013).
Table 1 Characteristics of children and mothers participating in the study (n 150), Northern Cape Province, South Africa, May 2010–August 2011
*Height-for-age Z-score <−2 sd of the WHO reference median(17).
†Weight-for-age Z-score <−2 sd of the WHO reference median(17).
‡Weight-for-height Z-score <−2 sd of the WHO reference median(17).
§Students (n 4) were included in this category.
||Exchange rate: R10 (South African Rand)=$US 1 as at June 2013.
Sheep's liver, in cooked or fried form, was consumed in 92·7 % of households and by 84·7 % of the children participating in the study (Table 2). Sixty-eight per cent of the children consumed liver at least once monthly, while 14·7 % consumed liver once weekly or more. The average portion size of those children who consumed liver was 65·9 g; 22·8 % of the children consumed more than 100 g liver at a time. Liver was introduced into the children's diet at a mean age of 18·5 months, while 49·6 % of the children had been eating liver from age 15 months or younger. No seasonal effect on liver intake was reported. Liver was readily available and was mostly bought at the local abattoirs at an affordable price, with 700 g liver costing approximately the same as one loaf of bread.
Table 2 LiverFootnote * consumption patterns of the study population (n 150), Northern Cape Province, South Africa, May 2010–August 2011
* Liver was consumed in cooked or fried form.
† For those who ate liver.
The relationship between sociodemographic factors and liver intake is shown in Table 3. Liver intake per month (frequency and amount of intake) was significantly higher in children whose mothers were unskilled compared with those with skilled mothers (P = 0·017 and P = 0·016, respectively). Liver intake (amount of liver per month) was also significantly higher (P = 0·028) in children from households with a monthly income of less than R5500 ($US 550) as opposed to those from households with an income of R5500 ($US 550) or more. Although not significant, children of mothers who did not complete grade 12 tended to eat more liver. There was no association between the number of years that the mother had lived in the study area and liver intake in the child.
Table 3 Relationship between sociodemographic factors and liver intake of children aged 24–59 months, Northern Cape Province, South Africa, May 2010–August 2011
*For those who ate liver (n 127).
†P value comparing the two categories, using the Mann–Whitney U test (two-sided).
‡Exchange rate: R10 (South African Rand)=$US 1 as at June 2013.
Vitamin A intake derived from liver, food fortification and vitamin A supplementation, respectively, is shown in Table 4. Mean total vitamin A intake according to the 24 h recall was 947 μg RE/d. The mean intake of vitamin A derived from liver was 537 μg RE/d according to the 24 h recall, and 325 μg RE/d according to the liver frequency questionnaire. The median vitamin A intake from liver as measured by the 24 h recall was zero. The national food fortification programme provided 80·2 μg RE/d, and the national vitamin A supplementation programme an additional 122·1 μg RE/d. The intake of Fe and Zn from liver was 0·43 mg/d and 0·24 mg/d, respectively. The mean dietary diversity score was 3·45 (sd 1·06), with 55·7 % of the children having a score below 4.
Table 4 Daily vitamin A intake derived from liver, food fortification and supplementation in the 24–59-month-old children living in the study area, Northern Cape Province, South Africa, May 2010–August 2011
IQR, interquartile range; RE, retinol equivalents; RtHC, Road-to-Health Chart.
*For 24 h recall, n 149.
†For liver frequency questionnaire, n 150.
‡Vitamin A intake through supplementation was calculated for the 137 children whose RtHC was available. Of these children, only 37·2 % (n 51) received 60 000 μg RE during the past 6 months, i.e. 328 μg RE/d (60 000/183 d); thus the per capita mean for the group was 122·1 μg RE/d and not 328 μg RE/d.
The contributions of liver, food fortification and vitamin A supplementation to the vitamin A intake per age category are shown in Fig. 1. In all three age categories, liver alone (measured by the liver frequency questionnaire) supplied more than the Estimated Average Requirement, but tended to be highest in the 3–3·9 year age category. The contribution of fortification was the highest in the older children (4–5 years), while the contribution of the supplementation programme was highest in the 2–2·9 year age group.
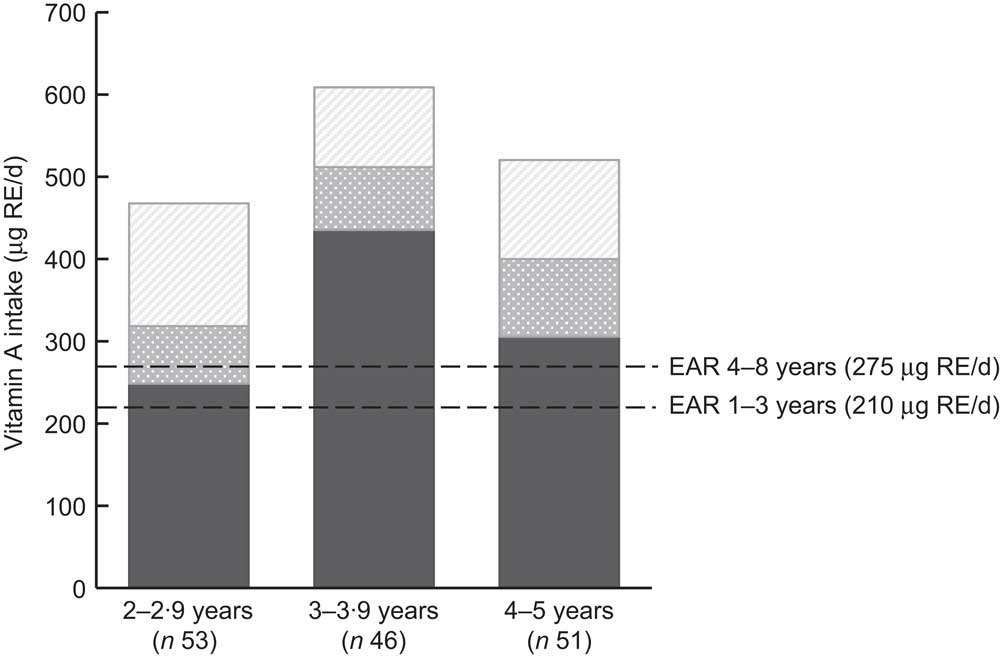
Fig. 1 The mean contributions of liver (![]() ), the national food fortification programme (
), the national food fortification programme (![]() ) and the national vitamin A supplementation programme (
) and the national vitamin A supplementation programme (![]() ) to the vitamin A intake, per age category, of children aged 24–59 months (n 150), Northern Cape Province, South Africa, May 2010–August 2011. Liver intake was assessed by a liver frequency questionnaire (RE, retinol equivalents; EAR, Estimated Average Requirement)
) to the vitamin A intake, per age category, of children aged 24–59 months (n 150), Northern Cape Province, South Africa, May 2010–August 2011. Liver intake was assessed by a liver frequency questionnaire (RE, retinol equivalents; EAR, Estimated Average Requirement)
Discussion
The present study assessed the contribution of sheep's liver to the vitamin A intake of pre-school children in an impoverished South African community where vitamin A deficiency had previously been shown to be virtually absent( Reference Van Stuijvenberg, Schoeman and Lombard 12 ). Liver is known to be frequently eaten in this area, but liver intake had not been quantified before. The results of the present study showed that liver alone provided more than 100 % of the Estimated Average Requirement for vitamin A for pre-school children.
Liver, mostly in cooked or fried form, was eaten by most of the children, with the majority eating liver at least once monthly and 15 % at least once weekly. The average portion size among those who consumed liver was 65·9 g at a time. Liver is an excellent source of preformed vitamin A, with a 70 g portion containing 5464 μg RE vitamin A( Reference Wolmarans, Danster and Dalton 13 ). The Estimated Average Requirement for the pre-school child ranges between 210 and 275 μg RE vitamin A/d( 18 ), and a 70 g portion of liver will thus theoretically ensure an adequate vitamin A supply for 26 d in a 1–3-year-old child and for 20 d in a 4–8-year-old child.
Liver intake was assessed by both the 24 h recall method and a quantified liver frequency questionnaire. The mean intake of vitamin A from liver measured by the 24 h recall was 1·6 times higher than the vitamin A intake measured by the liver frequency questionnaire. The 24 h recall can both underestimate( Reference Borrelli, Cole and DiBiase 19 ) and overestimate( Reference Vucic, Glibetic and Novakovic 20 ) nutrient intake. In the present study, the 24 h recall gave an overestimation of the mean vitamin A intake derived from liver, when compared with the liver frequency questionnaire. This is because of the exceptionally high vitamin A content of liver( Reference Wolmarans, Danster and Dalton 13 ) and the fact that eight children (5·4 %) ate liver on the previous day. Conversely, because liver was on average eaten only once or twice monthly, liver intake could have been easily underestimated or missed even had a multiple 24 h recall been used. Using the median to express vitamin A intake would not have given an accurate reflection of vitamin A intake either, because the majority of the children (95 %) did not eat liver the day before, which resulted in the median vitamin A intake from liver being zero. The 24 h recall thus is not a suitable tool for assessing vitamin A intake in areas where liver is frequently eaten. Liver does not have to be eaten on a daily or even weekly basis to contribute significantly to vitamin A intake, and it is therefore important that the 24 h recall in such areas is complemented with an FFQ which focuses on the intake of liver specifically and which covers a period of at least 1 month.
Although liver is regarded as a good source of Fe and Zn, intake of these two micronutrients from liver was negligible. This is because, compared with vitamin A, the Fe and Zn content in liver is considerably lower, and eating liver only once or twice monthly is not frequent enough to meet Fe and Zn requirements.
It can be assumed that the 24 h recall, even though it was only one recall per child, gave a good reflection of the mean intake of staple foods and thus the vitamin A intake derived from the national fortification programme, which was 80 μg RE/d or 30–40 % of the Estimated Average Requirement. This is a low socio-economic community that follows a diet with little variety (as indicated by a mean dietary diversity score of below 4). Both weekdays (75·8 %) and weekend days (24·2 %) were represented in the assessments. Bread is the staple food in the area( Reference Van Stuijvenberg, Schoeman and Lombard 12 ), and a sample size of 150 would have been large enough to reflect the mean consumption.
The national vitamin A supplementation programme contributed an additional 122 μg RE/d. Children aged 1–5 years are targeted to receive a 6-monthly dose of 60 000 μg RE (200 000 IU) vitamin A( 8 ), which would theoretically provide 328 μg RE/d. However, because only 37·2 % of the children received a vitamin A supplement during the 6 months that preceded the study, the per capita mean for the study group was 122 and not 328 μg RE/d. The low vitamin A coverage observed in this study population is in line with the national average, which was only 43·4 %( Reference Massyn, Day and Barron 21 ).
The high levels of stunting, underweight and wasting, which are double the national prevalence( Reference Labadarios 6 ), are similar to those previously found in this population( Reference Van Stuijvenberg, Schoeman and Lombard 12 ). Although poor anthropometric status is usually associated with vitamin A deficiency, it does not apply to this area and the poor growth in these children may be due to factors other than vitamin A deficiency. This is being investigated further.
Vitamin A deficiency is also generally associated with low socio-economic status( 2 – Reference Ahmed, Azim and Akhtaruzzaman 4 ). However, the paradox in this community is that children from households that are socio-economically more vulnerable had a higher intake of liver and therefore were less likely to be vitamin A-deficient. This is in line with the results of the previous study in this community, which showed a significant inverse correlation between educational level of the caregiver and the frequency of liver intake at household level( Reference Van Stuijvenberg, Schoeman and Lombard 12 ). Sheep farming being the main agricultural activity in this area results in liver being an affordable source of meat for the poor, with children eating liver from an early age. This is a good example of how the inherent eating habits of a poor community can act as a ‘coping mechanism’ and naturally protect them against a deficiency, without the health authorities having to implement interventions using pharmacological doses.
A concern in the present study is the fact that in 15 % of the children, the vitamin A intake from liver alone, as measured by the liver frequency questionnaire, exceeded the Tolerable Upper Intake Level for their respective age categories (i.e. 600 μg RE/d for children aged 1–3 years and 900 μg RE/d for children 4–8 years)( 18 ), which could put them at risk of excessive vitamin A intake. This does not take into account the contribution from the national food fortification and national vitamin A supplementation programmes. Too much vitamin A is known to be harmful( Reference Penniston and Tanumihardjo 22 ) and cases of severe vitamin A toxicity resulting from excessive intake of liver have been documented( Reference Mahoney, Margolis and Knauss 23 , Reference Carpenter, Pettifor and Russel 24 ).
The fact that serum retinol was not measured in the present study could be seen as a shortcoming. However, results of previous studies in the same community showed vitamin A deficiency to be virtually absent( Reference Van Stuijvenberg, Schoeman and Lombard 12 , Reference Van Stuijvenberg, Smuts and Wolmarans 25 ). There are indications that the liver-eating habits of this community, and hence the absence of vitamin A deficiency, are not restricted to the study area. Sheep farming is the major agricultural activity in most of the dry and expansive Northern Cape Province, and an extensive survey, covering the whole of this province, is underway to identify pockets where liver is frequently eaten( Reference Van Stuijvenberg, Schoeman and Lombard 12 ). The results of this survey could have important implications for the vitamin A supplementation policy at sub-national level.
Conclusions
The present study showed that liver alone provides enough vitamin A to meet the requirements of the pre-school children in an impoverished community. It also highlights the fact that the 24 recall on its own is not an appropriate tool for assessing vitamin A intake from liver and that the latter should be complemented with a liver frequency questionnaire, covering a period of at least 1 month. The study further challenges the notion generally held by international health bodies that vitamin A deficiency goes hand in hand with poverty and poor anthropometric status, and reinforces the fact that South Africa is a culturally diverse society for which targeted rather than blanket interventions are required.
Acknowledgements
Sources of funding: This research was supported by the South African Medical Research Council, Cape Town. No specific grant was received from any other funding agency in the public, commercial or not-for-profit sectors. Conflict of interest: The authors have no conflict of interest. Authors’ contributions: All authors contributed to the conceptualisation and design of the study and writing of the manuscript. J.N. collected the data and wrote the first draft. M.E.v.S. analysed and interpreted the data and was responsible for the final version of the manuscript. C.J.L. was responsible for the statistical aspects of the study. Acknowledgements: The authors thank the mothers and children of Calvinia West community who participated in the study; the Northern Cape Department of Health for giving permission to conduct the study; Mieke Faber for advice on the collection of dietary data in young children; Ria Laubscher for analysing the dietary data; and Maria Barlow for assisting with the fieldwork.


