


Food insecurity, the condition of inconsistent or uncertain availability of safe and nutritionally adequate food, is considered a major public health issue in the USA( Reference Gundersen 1 , Reference Hoefer and Curry 2 ). Food security and insecurity are categorized into four levels by the US Department of Agriculture (USDA): (i) food secure; (ii) marginal food security; (iii) low food security; and (iv) very low food security. In the literature, and according to the USDA, the last two categories of low to very low food security are referred as food insecurity. Food insecurity is associated with poor diet quality and excess weight gain, including high rates of diabetes and hypertension among adults( Reference Seligman, Laraia and Kushel 3 – Reference Larson and Story 5 ). The Institute of Medicine has concluded that it is critical to address food insecurity (i.e. low to very low food security) to address health disparities and negative health outcomes among low-income populations in the USA( 6 ).
The current literature suggests that the home food environment, specifically in terms of exposure to and availability of different types of fruits and vegetables, is positively associated with their daily intake( Reference Kendall, Olson and Frongillo 7 – Reference Darmon and Drewnowski 9 ). For instance, in a sample of primarily African-American, low-income, overweight/obese women (n 319), the availability of fruits and vegetables was significantly associated with the intake of these items, and the availability of processed, packaged foods was significantly associated with the intake of energy from fat( Reference Kegler, Alcantara and Haardörfer 8 ). Studies examining predictors of the home food environment indicate that food insecurity significantly affects availability of different types of foods( Reference Darmon and Drewnowski 9 , Reference Drewnowski and Darmon 10 ). In particular, food insecurity has been significantly associated with lower availability of fruits and vegetables and higher availability of energy-dense or processed, packaged foods in samples of low-income mothers( Reference Nackers and Appelhans 11 , Reference Kaiser, Melgar-Quiñonez and Townsend 12 ). An earlier study by Kendall et al. found that low to very low food-secure or food-insecure households had lower mean availability of fruits compared with food-secure households (mean=7·1 v. 8·6, respectively; P<0·001)( Reference Kendall, Olson and Frongillo 7 ). In another similar study, it was found that food-insecure caregivers reported significantly more obesity-promoting foods in the home, more microwavable or quick-cook frozen foods and greater access to less healthful foods in the kitchen compared with food-secure caregivers( Reference Appelhans, Waring and Schneider 13 ). Concurrent to these studies, the home food environment model developed by Rosenkranz and Dzewaltowski proposes that meso or family-level factors, such as household food security status, affect food selection and purchases or the availability of types of foods at home( Reference Rosenkranz and Dzewaltowski 14 ). It is postulated that food-insecure households are more likely to purchase ‘high satiety value’ foods as one of the strategies in preventing very low food security or hunger. In a recent epidemiological study by Leung et al., it was found that consumption of highly palatable foods such as salty snacks and sugar-sweetened beverages was higher, while intake of fruits and vegetables was lower, among food-insecure adults compared with their food-secure counterparts. Food-insecure adults in that sample consumed 12 % fewer servings of vegetables than food-secure individuals (95 % CI 9, 15 %; P<0·0001)( Reference Leung, Epel and Ritchie 15 ).
In summary, it is seen that food insecurity is associated with a poor home food environment, including the availability of fruits and vegetables. Similarly, the current literature indicates that food insecurity is significantly associated with unhealthy dietary behaviours, including obesity and poor health. However, to the best of the authors’ knowledge, the interrelationship between food security status, home food environment and diet behaviours, especially for the recommended food group of fruits and vegetables, has not been investigated.
The present study focuses specifically on a high-risk group of low-income pregnant women, who are at increased risk of gaining excess gestational weight gain due to poor dietary habits. This is critical because excess weight gain during pregnancy is associated with obesity and high rates of chronic diseases later in life for both mother and child( Reference Rasmussen and Yaktine 16 ). Hence, the objectives of the present study are to: (i) determine the differences in the availability of variety of fruits and vegetables at home by food security status; and (ii) examine the inter-associations between food security status, availability of variety of fruits and vegetables at home and frequency of fruit and vegetable intake, among low-income pregnant women.
Methods
Study design and setting
In a cross-sectional study, pregnant women in their second trimester (13–27 weeks) were interviewed by trained research staff using a structured interview questionnaire. Recruitment and interviews were conducted in the Special Supplemental Nutrition Program for Women, Infants, and Children (WIC) clinic located in an urban county in the Southeast region of the USA. A convenience sample of pregnant women (n 198) was recruited from January 2014 to July 2014, during their WIC maternity certification appointment.
Recruitment and interviews
Pregnant women were recruited from the clinic while they attended their maternity certification appointment. A maternity certification appointment time for the study clinic ranged from 1 to 2 h, including the wait times between each portion of the appointment for height and weight measurements, blood draws, and meeting with nutrition and breast-feeding counsellors. Wait times between each portion ranged from 10 to 30 min and it was determined that women could participate in the study during these wait times rather than attend a separate appointment for the study, thereby reducing participant burden.
In a typical week, approximately ten maternity certification appointments were scheduled. As a first step, research staff reviewed daily maternity certification appointment folders at the beginning of the day to identify potentially eligible participants. Women were deemed eligible to participate in the study if they were: (i) ≥18 years of age; (ii) 13–27 weeks’ pregnant (second trimester); and (iii) able to speak either English or Spanish. The folders of women who met study criteria were flagged to alert WIC staff members. After initial paperwork and getting enrolled, WIC staff provided study information and introduced interested women to research staff to provide further information about the study and conduct recruitment. Upon provision of written consent, women participated in a structured closed-ended interview lasting 45 to 60 min. For most (80 %) of the participants, interviews were carried out in the wait times of the certification appointment. For the remaining participants, a separate day and time were scheduled to complete the interview at the WIC clinic. Those participants were given appointment cards and they were reminded the day before their appointment by text message or telephone call. At the end of each interview, the participant received a $US 25 grocery store gift card as an incentive.
Sample size
The average frequency of daily intake of fruits and vegetables among women in the USA was used to estimate the sample size( Reference Blanck, Gillespie and Kimmons 17 ). Results of the power analysis indicated that a sample size of 125 would be necessary to achieve a power of 0·8 to observe statistical significance (P<0·05) for a difference in frequency of fruit and vegetable intake of 5 % across food security levels. However, to ensure complete data for 125 participants, over-recruitment was carried out in the 6-month data collection period, resulting in total of 198 low-income pregnant women participating in the study.
Measures
Research staff utilized a structured interview questionnaire that included the following four main sections: (i) sociodemographics; (ii) household food security status; (iii) frequency of intake of fruits and vegetables; and (iv) home food environment by the availability of variety of fruits and vegetables.
Sociodemographics
Under this section, information regarding age, monthly household income, education, race/ethnicity, household size and participation in the Supplemental Nutrition Assistance Program (SNAP) was collected.
Household food security
Food security was measured using the USDA’s eighteen-item Household Food Security Survey Module( 18 ). This survey enquires about the self-reported occurrence of different situations related to food shortage and access over a set period of time. To capture food security status for the current pregnancy, the standard 30d or 1-year reference period used for the survey statements was changed to ‘Since you’ve become pregnant or in the past few months…’. Eight of the eighteen survey items are specific to households with children (individuals <18 years of age) and so were not asked if the participant was pregnant for the first time. A point was given for each affirmative response; hence the total raw score ranged from 0 to 10 for primiparous pregnant women, and from 0 to 18 for multiparous women. This total raw score was then used to categorize participants into one of four levels according to the standard scoring schema used by the USDA: (i) score=0, food secure; (ii) score=1 or 2, marginal food secure; (iii) score=3–7 (3–5 for primiparous women), low food secure; and (iv) score=8–18 (6–10 for primiparous women), very low food secure. Finally, for the purposes of the regression and mediation analyses, all raw scores on the 18-point and 10-point versions were scaled, per standard guidelines developed by the USDA, to be placed on the 10-point metric( Reference Bickel, Nord and Price 19 ).
Frequency of intake of fruits and vegetables
The 2013 Behavioral Risk Factor Surveillance System (BRFSS) Fruit and Vegetable FFQ was used to assess the frequency of (daily, weekly or monthly) consumption of: (i) fruits (excluding fruit juices); and (ii) vegetables (excluding fried potatoes)( 20 ). The BRFSS questionnaire has demonstrated moderate validity and reliability in assessing frequency of fruit and vegetable consumption at the population level( 21 ). To determine daily frequency of fruit and vegetable intake, a standard calculation method was used: weekly intake response was divided by 7 and for the monthly response the intake was divided into 30, to ultimately have daily intake value( 22 ). To avoid issues of false precision, these data were then grouped into standard intake frequencies of: fewer than one per day (0–<0·5), one per day (0·5–<1·5), two per day (1·5–<2·5), three per day (2·5–<3·5) and four or more per day (≥3·5).
Home food environment by the availability of variety of fruits and vegetables
The variety of available fruits and vegetables was measured using an inventory of commonly eaten fruits and vegetables in US households( Reference Marsh, Cullen and Baranowski 23 ). The inventory was divided into sub-categories based upon the fresh, dried, canned or frozen forms of these items (forty-four total items; twenty-one different varieties/types for fruits and twenty-three for vegetables): (i) fresh fruits (nine items); (ii) canned fruits (five items); (iii) dried fruits (four items); (iv) frozen fruits (three items); (v) fresh vegetables (thirteen items); (vi) canned vegetables (six items); and (vii) frozen vegetables (four items). A 7d reference period was used and a dichotomous option of ‘yes’ or ‘no’, was provided. Participants were then asked to list any other fruits and vegetables not presented in the inventory. For each response of ‘yes’, a score of 1 was given for the above recalled forty-four varieties and types of fruits and vegetables. In addition, a score was given to each additional, non-listed fruit and vegetable participants noted in the ‘other’ category. Hence, a score of 0 indicated no availability of fruits and vegetables in the past 7d; whereas, a total fruit score of 5 indicated that participants had five different kinds/types of fruits available at home in the past 7d. The resulting scores provided an index of the variety of available fruits (VAF) and variety of vegetables (VAV) in the household during the reference period. This inventory has been previously validated by Marsh et al. and found to have substantial agreement (75·9 %) between self-reported inventories and independent observations conducted by the researchers( Reference Marsh, Cullen and Baranowski 23 ).
Spanish-speaking participants
Validated Spanish versions of the USDA’s eighteen-item Household Food Security Survey Module and the 2013 BRFSS Fruit and Vegetable FFQ were used. The two remaining sections (sociodemographics and the inventory for home availability of fruits and vegetables) were translated from the original English version into Spanish using a basic online translation program (Google Translate). The translated version was reviewed and back-translated by the bilingual Hispanic community interviewer to assess content and concept accuracy against the English version. The community interviewer also reviewed the questionnaire for cultural appropriateness and relevance. Pilot-testing was carried out with the first five Spanish-speaking participants to ensure that the translation was accurate. These pilot surveys are not included in the main results.
Statistical methods
The data were entered and coded using the statistical software package IBM SPSS Statistics for Windows, version 23.0. Descriptive statistics and frequencies were computed to examine sociodemographic characteristics of the study participants. To maintain consistency, continuous variables such as age and income were categorized into tertile or quartile categories, using the normal distribution range. Pearson’s χ 2 test of independence was used to test for associations between sociodemographics and food security status categories. One-way ANOVA was used to test for differences in VAF and VAV by food security levels. Bonferroni post hoc tests were used to control for family-wise type I error when making pairwise comparisons.
As a first step, to examine the inter-associations between food security, VAF/VAV and daily intake of fruits/vegetables, multivariate ordinary least-squares regression analyses were carried out. Using the Rosenkranz and Dzewaltowski model on role of the home food environment as a guide, three separate models were estimated both for fruit and vegetable measures (six models in total). For instance, for fruits, three models tested were: (i) food security status → daily intake of fruits; (ii) food security status → VAF; (iii) VAF → daily intake of fruits. Similarly, three models were tested for vegetables using food security status, VAV and frequency of daily intake of vegetables. The scaled food security scores were used in this set of analyses (10-point metric). To identify and control for any relevant sociodemographic variables that might be associated with frequency of daily intake of fruits or vegetables, bivariate correlation analyses – Pearson product moment (r) and point-biserial (r pb) – were conducted (results not shown here). Both correlation coefficient magnitude and P value were taken into account when considering which variables should be included as covariates in the regression models( Reference Maldonado and Greenland 24 , Reference Mickey and Greenland 25 ). Based on these analyses, age (r=0·16, P=0·023) and the race/ethnicity ‘other’ categorization (r pb=−0·12, P=0·086) were included as covariates in fruit intake models; whereas SNAP participation (yes/no; r pb=−0·12, P=0·083) and household income (r=0·10, P=0·145) were included as covariates in vegetable intake models. Bonferroni corrections, based on the number of predictors included in each regression model, were applied to critical values for significance to guard against inflation of type I error (three predictors: P<0·017).
Based on the above first-step regression analyses results, the indirect association of food security with daily intake of fruits or vegetables, through its home availability, was carried out using regression-based mediation techniques described by Hayes and Rockwood( Reference Hayes and Rockwood 26 ), using the PROCESS macro for SPSS( Reference Hayes 27 ). Mediation analysis is most appropriate for a randomized intervention study to estimate the effect of ‘exposure’ on the outcome. However, mediation analysis has been used in cross-sectional studies to identify potential temporal mediators. The Academy of Nutrition and Dietetics paper describing the use of mediation analysis in nutrition research indicates that the use of this analysis technique is feasible in cross-sectional studies to explain transmission of effects between variables( Reference Lockwood, DeFrancesco and Elliot 28 ).
As in the initial regression analyses, mediation testing was carried out separately for fruit and vegetable measures. The sociodemographic covariates that were included in the first step of regression were also included in the mediation analyses to control for any confounding inter-associations between the proposed antecedent, mediator and outcome variables. Additionally, prior to conducting the mediation analyses, external regression models were estimated to test for an antecedent-by-mediator interaction: no significant interactions were observed (P=0·311–0·979). Mediation analyses was carried out both: (i) as a single mediator model for the total VAF or total VAV; and (ii) for multiple mediator models separating fruits and vegetables by types (i.e. fresh, canned, dried and frozen). Confidence interval coverage was set at 95 % CI, and the number of bootstrap samples was set at 10 000. Indirect effect (IE) estimates for which the 95 % CI did not contain zero were interpreted as statistically significant and considered evidence of potential mediation.
Results
Sociodemographics
The average age of the participants was 26 years and 38 % of participants were pregnant for the first time. On average monthly household income of the participants was $US 1126, with 13 % reporting zero household income. Approximately half of the participants (54 %) were receiving SNAP. More than one-third of the participants (34 %) did not have a car and 61 % reported being unemployed. About half of the participants identified as African American and 17 % identified as Hispanic. The ‘other’ ethnic group represented mainly refugees and immigrants from different countries in South-East Asia and Africa. Slightly more than half of the participants (51 %) reported having high school or less education, and 59 % reported as single, divorced or separated.
Food security
The sample mean for the scaled food security score was 2·18 (sd 2·21), with higher scores reflecting more severe levels of food insecurity. Based on the four standard categories, 38 % reported as fully food secure and 19 % reported marginal food security. Among the remaining participants, 24 % reported low and 19 % reported very low food security. No significant associations were found between sociodemographic characteristics (age, income, employment, education, marital status, race/ethnicity, SNAP participation, parity and transportation) and food security levels (data not shown).
Daily intake of fruits and vegetables
Mean daily intake of fruit and vegetables was 1·76 (sd 1·23) and 1·88 (sd 1·22), respectively. Based on the ordered categorization, the median frequency of both daily fruit intake (excluding 100 % fruit juices) and daily vegetable intake was 2, with an interquartile range of 1–3. Of the total participants, 16 % reported daily fruit intake of less than one per day, while for vegetables, 9 % reported daily vegetable intake of less than one per day.
Variety of available fruits and vegetables at home by food security level
On average, eight different types of fruits and twelve different types of vegetables were available in participants’ households. For VAF, the score ranged from 0 to 21; while for VAV, the maximum score was 23. Results from the one-way ANOVA indicated significant differences in VAF scores (F (3,197)=3·11, P=0·028) and marginally significant differences in VAV scores (F (3,197)=2·53, P=0·058) by food security status (Fig. 1). The Bonferroni post hoc test indicated that the lone significant difference existed between the two extreme levels of food security, i.e. participants with very low food security had a significantly lower VAF (mean 6·41 (sd 3·96)) compared with fully food-secure participants (mean 8·64 (sd 3·82)). Although marginally significant, a similar pattern was observed for the VAV: home availability of different types of vegetables was lower among very low food-secure women (mean 10·25 (sd 4·91)) compared with their food-secure counterparts (mean 12·54 (sd 4·62)).
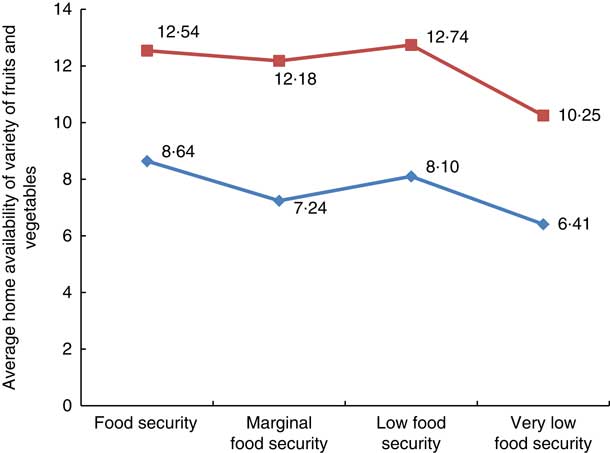
Fig. 1 (colour online) Average availability of variety of fruits(![]() )and vegetables(
)and vegetables(![]() )in the home of low-income pregnant women by food security level (n 198), Southeast USA, January–July 2014. One-way ANOVA was used to test for differences in availability of variety of fruits and vegetables by food security level; a significant difference was seen between food security and very low food security status for total variety of available fruits (F
(3,197)=3·11, P=0·028, post hoc Bonferroni’s P=0·009)
)in the home of low-income pregnant women by food security level (n 198), Southeast USA, January–July 2014. One-way ANOVA was used to test for differences in availability of variety of fruits and vegetables by food security level; a significant difference was seen between food security and very low food security status for total variety of available fruits (F
(3,197)=3·11, P=0·028, post hoc Bonferroni’s P=0·009)
Associations between food security status, variety of fruits and vegetables available at home, and daily intake of fruits and vegetables
First-step: multivariate ordinary least-squares regression analyses results
Fruits
In the three models tested for fruits (food security status → daily intake of fruits; food security status →VAF; VAF → daily intake of fruits), as shown in Table 1, it was found that food security status did not predict daily fruit intake (β=−0·026 (se 0·040), P=0·515), even after controlling for covariates of age and race/ethnicity. However, a significant inverse relationship was seen between food security and total VAF, i.e. with increase in food insecurity, the VAF at home decreased (Table 1). Third, total VAF score significantly predicted the intake of fruits. With a one-unit increase in VAF there was an associated increase of 0·086 in daily fruit intake (Table 1).
Table 1 Multivariate regression results representing associations between food security level, availability of fruits or vegetables at home and daily intake of fruits or vegetables, among low-income pregnant women (n 198), Southeast USA, January–July 2014
DV, dependent variable; SNAP, Supplemental Nutrition Assistance Program.
For fruits: n 198; for vegetables: n 197, since income information was missing for one participant.
Vegetables
Consistent with the above results related to fruit measures, as shown in Table 1, food security did not significantly predict daily vegetable intake (β=−0·033 (se 0·040), P=0·412) after controlling for covariates associated with vegetable intake (SNAP participation and income). But, food security level significantly predicted VAV (β=−0·353 (se 0·151), P=0·021) and the total VAV score was positively associated with daily vegetable intake (β=0·085 (se 0·017), P<0·001).
Second step: mediation analyses results
Full results of the mediation analyses are depicted in Fig. 2(a)–(d). As indicated in Fig. 2(a), food security level was significantly negatively associated with the total VAF at home (β=−0·30 (se 0·13), P=0·017); and, when controlling for food security, total VAF was significantly associated with daily fruit intake (β=0·09 (se 0·02), P<0·001). Estimation of the indirect effect, via bootstrapping, suggested that food security score was significantly associated with daily fruit intake through total VAF (IE=−0·026 (se 0·012), 95 % CI −0·055, −0·005). In terms of direction, the results indicated that greater food insecurity was associated with lower VAF scores, which in turn were associated with lower daily fruit intake. When the VAF was separated by types, i.e. fresh, canned, dried and frozen, in a multiple mediator framework (Fig. 2(b)), it was found that food security was specifically associated with the availability of fresh fruits (β=−0·25 (se 0·09), P=0·004). Ultimately, estimation of the indirect effect indicated that food security was significantly associated with daily fruit intake specifically through the availability of variety of fresh fruits (IEfreshfruit=−0·039 (se 0·015), 95 % CI −0·074, −0·013).
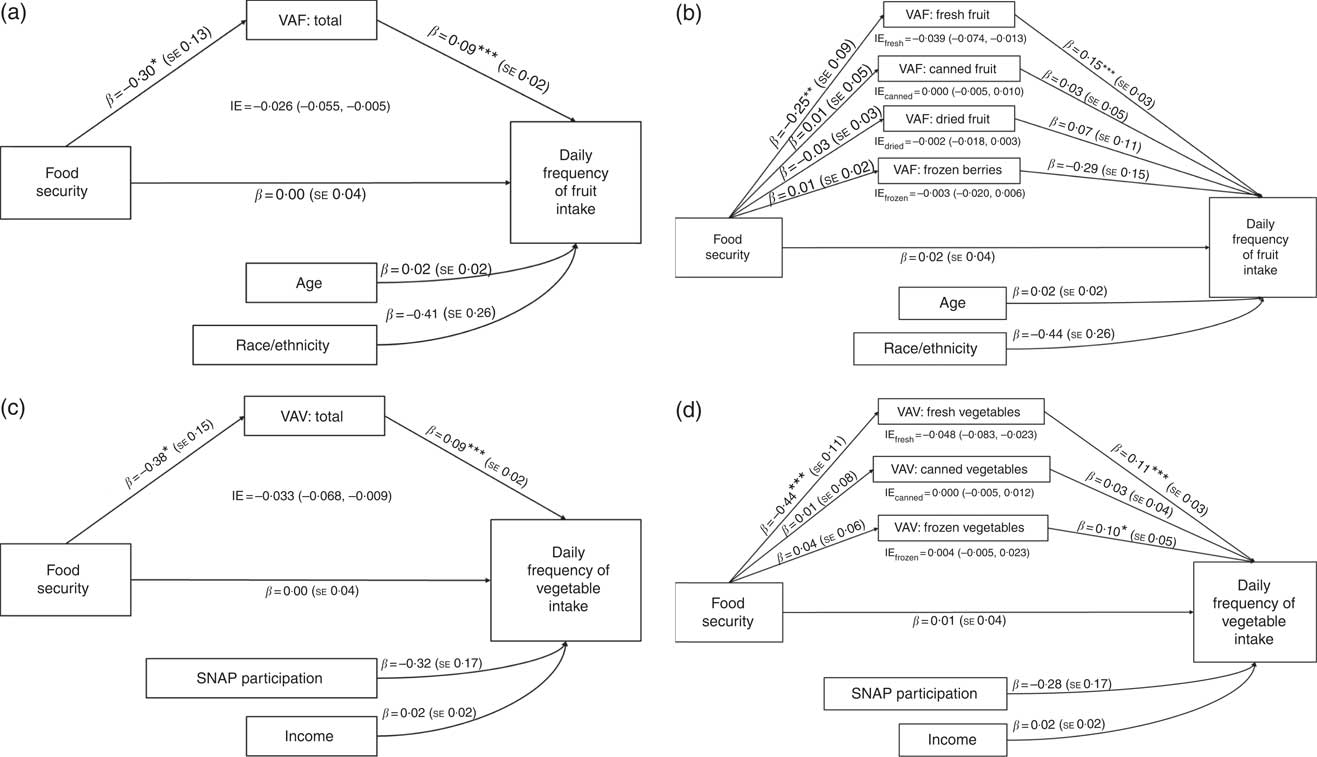
Fig. 2 Mediation analysis to estimate the interrelationship between food security, variety of fruits or vegetables at home and the frequency of daily fruit or vegetable intake, among low-income pregnant women, Southeast USA, January–July 2014: (a) food security, variety of fruits available at home (VAF) and the frequency of daily fruit intake, (b) separated by variety of available fruits (sample size for fruits is n 198); (c) food security, variety of vegetables available at home (VAV) and the frequency of daily vegetable intake, (d) separated by variety of available vegetables (sample size for vegetables is n 197 since income information was missing for one participant). Direct effects are path coefficients (β) and se; indirect effects (IE) are presented with 95 % CI. All coefficients and IE estimates are unstandardized. *P<0·05, **P<0·01, ***P<0·001 (SNAP, Supplemental Nutrition Assistance Program)
In the case of vegetables (Fig. 2(c)), like fruits, food security was negatively associated with the total VAV score (β=−0·38 (se 0·15), P=0·014); and, when controlling for food security, total VAV was significantly associated with daily vegetable intake (β=0·09 (se 0·02), P<0·001). Similar to the results for fruits, estimation of the indirect effect suggested that as food security worsened, represented as increase in its score, this was negatively associated with daily vegetable intake through low levels of VAV at home (IE=−0·033 (se 0·015), 95 % CI −0·068, −0·009). When VAV was separated by types, i.e. fresh, canned and frozen, in a multiple mediator framework (Fig. 2(d)), it was found that food security scores were specifically associated with the variety of available fresh vegetables (β=−0·44 (se 0·11), P<0·001). Estimation of the indirect effect indicated that food security was significantly associated with daily vegetable intake through the availability of variety of fresh vegetables at home (IEfreshveg=−0·048 (se 0·015), 95 % CI −0·083, −0·023). In other words, as food insecurity increased, the availability of fresh variety of vegetables decreased, which in turn was associated with its daily intake.
Discussion
The results of the present study indicate that low to very low levels of food security (food insecurity) are common (43 %) among low-income pregnant women. Previous studies on women participating in WIC have reported food insecurity rates from 27 % to as high as 42 %( Reference Anding, Osborn and Gorman 29 , Reference Mathews, Morris and Schneider 30 ). Prior food security research in the general population has shown that minority women and single-women households are at higher risk of experiencing low to very low food security( Reference McCurdy and Metallinos-Katsaras 31 – Reference Herman, Harrison and Afifi 33 ). However, we did not see any difference in food security status by ethnicity or marital status. This may be attributable to the fact that all the participants were low-income (≤185 % poverty level), hence ethnic differences in food security status due to general high rates of poverty among minority families might not be evident in this homogeneous group of WIC or limited-income women. No difference in food security status by marital status in our study population might be due to higher social and family support generally experienced during pregnancy.
Overall average intake of fruits and vegetables among adults in the USA is 1·3 times daily( 21 ). In our study, women reported consuming fruits and vegetables on average 1·8 times daily; a little higher than a national trend. This may be due to our study population being specifically pregnant women, a life stage where women are more likely to eat healthily for normal growth and development of their babies. In a recent study with WIC women, similar higher intake pattern for fruits and vegetables was seen. Among 744 WIC women, the daily intake of fruits and vegetables was approximately 2 cups/d. However, it was seen that social desirability was very common among the study population and it was positively associated with vegetable intake: with a 1-unit increase in the social desirability score, there was an increase of 0·12 times/d that vegetables were reported to have been consumed( Reference Di Noia, Cullen and Monica 34 , Reference Di Noia, Monica and Gray 35 ). Considering this, the self-report of fruit and vegetable intake among our population group of WIC pregnant women might also be biased by the social desirability of reporting healthy eating behaviours during pregnancy.
Studies on the role of the home food environment indicate that it represents the proximal access to food and is a critical predictor of daily dietary intake habits( Reference Kegler, Alcantara and Haardörfer 8 , Reference Fulkerson, Nelson and Lytle 36 , Reference French, Shimotsu and Wall 37 ). In our study, the availability of different varieties and types of fruits was significantly lower among very low food-secure women. Similarly, Kendall et al. also found that food-insecure households had significantly lower mean availability of fruits compared with food-secure households( Reference Kendall, Olson and Frongillo 7 ). In explanation of this pattern, Drewnowski analysed the price per unit of energy and indicated that energy-dense foods such as fats and oils, sugar, refined grains and potatoes provide dietary energy at minimum cost compared with fish, dairy products or fresh produce. High preference for refined-grain and added-sugar items compared with fruits and vegetables may represent a deliberate strategy for low-income households to purchase high-return-value foods, i.e. getting more energy per dollar spent( Reference Drewnowski 38 ). Especially, in a situation of limited food budget, food-insecure families may focus more on purchasing non-perishable, energy-dense foods that may be cheaper compared with low-satiety-value foods such as fruits and vegetables.
The findings of the mediation analyses indicate that the relationship between food insecurity and daily intake of fruits and vegetables is associated with its availability at home. Specifically, the lower availability of the fresh variety of fruits and vegetables was associated with the intake. This can be due to insignificant difference in availability of canned or frozen variety of vegetables and fruits between food-secure and -insecure households. Unlike expected, the post analysis indicated that home availability of canned or frozen (economical versions) variety of vegetables and fruits was not higher among low or very low food-secure participants (data not shown). Through the federal and state nutrition education programmes, canned and frozen varieties of fruits and vegetables are promoted as a cost-effective option to increase daily intake of this food group among low-income women. However, several studies have shown that factors such as poor cooking skills and misconception of nutritional quality have been barriers in improving the use of frozen and canned varieties of fruits and vegetables among low-income families( Reference Kegler, Alcantara and Haardörfer 8 , Reference Nackers and Appelhans 11 , Reference Hartline-Grafton 39 ). Additionally, it is found that food insecurity or living in the ‘scarce’ environment might trigger preference for high-energy, highly palatable foods, reducing further the likelihood of finding ways to use cheaper versions of nutrient-dense options of canned and frozen fruits and vegetables in the daily diet( Reference Laraia, Leak and Tester 40 ). Results of the present study suggest that assessing household food security and providing additional educational and social support to improve use of cheaper options of canned and frozen fruits and vegetables could improve the home food environment and dietary habits among low-income pregnant women.
A limitation of the present study is the use of a convenience sampling technique whereby there is a risk of either over- or under-representation of certain population groups. However, the demographic characteristics of our sample were closely representative of the county and state demographics regarding low-income women. For fruits and vegetables, information on frequency of its daily intake was collected, which is a limitation, as it does not reflect quantity of intake. Similarly, measuring only availability of variety of fruits and vegetables, without measuring their specific amounts and at what frequency they are available, limits the specificity of the study results. Finally, restricting recruitment to WIC pregnant women may reduce generalizability of the results among other low-income pregnant women not receiving WIC or any food assistance.
Conclusions and implications
To the best of the authors’ knowledge, the present study is the first to investigate the interrelationship between food security, availability of variety fruits and vegetables at home and frequency of their intake. Further research should seek to examine the home food environment in terms of availability of healthy v. unhealthy foods and its relationship to food security status and overall diet quality. WIC clinics and other food assistance programmes could use this information to tailor nutrition counselling and education towards preparation, storage and maximizing food dollars, to improve the availability of fruits and vegetables at home and ultimately the diet quality of low-income women. Results of the study also highlight the importance of the home food environment and the need for interventions to improve the availability of healthy options at home to improve nutritional outcomes among low-income families.
Acknowledgements
Acknowledgements: The authors would like to thank their Spanish interpreter and graduate and undergraduate research assistants for their time and effort in helping complete this study. They would also like to thank the staff at the Guilford County Department of Public Health and its WIC clinic for their collaboration in this endeavour. Financial support: The project described was supported by the National Center for Advancing Translational Sciences (NCATS), National Institutes of Health (NIH), through Grant Award Number UL1TR001111. The content is solely the responsibility of the authors and does not necessarily represent the official views of the NIH. The funders had no role in the design, analysis or writing of this article. Conflicts of interest: No authors on this manuscript have any conflicts of interest to disclose, financial, personal or otherwise. Authorship: D.L.N. participated in development of the study materials, on-site day-to-day study coordination, institutional review board (IRB) documentation, community partner outreach, collection of data through interviews and management of research assistants to collect interviews, coordination of data entry and analysis, interpretation of analyses, and manuscript drafting and revision. J.D.L. served as the consultant for statistical analyses related to mediation model testing and participated in drafting and revising the statistical and analytical portions of the manuscript for journal submission. J.M.D. designed and drafted the proposal for this research and procured funding, as well as participated in directing day-to-day study coordination, IRB documentation, community partner outreach, collection of data through interviews, coordination and organization of data entry and analysis, interpretation of analyses, and manuscript drafting and revision. Ethics of human subject participation: This study was conducted according to the guidelines laid down in the Declaration of Helsinki and all procedures involving human subjects/patients were approved by IRB of The University of North Carolina at Greensboro and The University of North Carolina at Chapel Hill. Written informed consent was obtained from all subjects.


