


Undernutrition is a common condition among children living in the developing world(Reference de Onis, Frongillo and Blossner1). In Brazil, the majority of undernourished children live in shantytowns within urban areas, where the prevalence of undernutrition among pre-school children can reach 20 %(Reference Florencio, Ferreira and de Franca2). Stunting, defined as height-for-age more than two standard deviations below the median of the National Center for Health Statistics (NCHS) reference population(3), is the most frequent form of undernutrition(Reference Stephenson, Latham and Ottesen4). In general, it has been found that stunting is associated with poor sanitation, inadequate housing condition and lack of tap water(Reference Sawaya, Martins and Hoffman5). Thus, treatment of the chronically undernourished child is necessary and perhaps is best done away from the daily living conditions, giving rise to ‘daily care’, but non-residential, treatment centres. However, the effectiveness of such centres on growth and maturation has rarely been reported(Reference Colecraft, Marquis and Bartolucci6, Reference do Monte, Ashworth and Sa7).
Generally, national policies to fight undernutrition have consisted of food distribution to high-risk groups (e.g. children below 2 years of age, pregnant and lactating women). However, these programmes have shown only a small impact as they are frequently interrupted due to shifts in political priorities and resources and owing to the fact that such programmes are not associated with tangible effects on health(8).
The Federal University of São Paulo established CREN (Center for Nutritional Recovery and Education) to develop nutritional rehabilitation methodologies in both scientific and social contexts. One of the most important areas of consideration, in terms of the physiological effects of nutritional rehabilitation, is the acute and chronic effects on height and weight(Reference Schroeder, Martorell and Flores9, Reference Schroeder and Martorell10). Strategies to more effectively reduce child undernutrition, especially in terms of promoting linear growth, are especially important in light of the growing evidence of the long-term deleterious effects of intra-uterine and early childhood growth retardation(Reference Victora, Barros and Horta11). The aim of the present study was to evaluate the patterns of nutritional recovery of undernourished children during five years of nutritional rehabilitation at CREN.
Methods
Sample population
Children who attended CREN were identified through anthropometric surveys within the shantytown in the greater Sao Paulo metropolitan area. All children treated between January 1995 and December 1999 were included in the study. Children between 0 and 72 months of age who are identified as undernourished (i.e. weight-for-height Z-score (WHZ) or height-for-age Z-score (HAZ) <−1·65) are further evaluated by the health staff(Reference Frisancho12). At CREN, children receive up to five meals each day with the goal of providing 100 % of the daily energy recommendations(13) for the specific age group. In addition, each child receives iron supplementation and prophylactic doses of vitamins C, A, D and B complex. In the case of infectious diseases, paediatricians evaluate the children and provide adequate treatment. None of the children studied had oedema and none died during the study period.
All children follow the same routine from Monday to Friday, 07.30 to 17.30 hours:
• 07.30 to 08.20 hours – arrival and breakfast;
• 08.30 to 09.30 hours – sleeping time (nursery)/activities for the older children;
• 09.30 to 10.00 hours – break for juice or fruit;
• 10.00 to 11.00 hours – activities/hygiene/consultations;
• 11.00 to 12.00 hours – lunch;
• 12.00 to 12.30 hours – washing up (brushing teeth);
• 12.30 to 14.30 hours – sleeping time;
• 14.30 to 14.45 hours – washing up for snack;
• 14.45 to 15.00 hours – snack;
• 15.00 to 16.15 hours – activities/washing up/consultations;
• 16.15 to 17.15 hours – dinner;
• 17.15 to 17.30 hours – discharge.
Anthropometric measurements
Standard anthropometric measures obtained for each child were weight (kg), length or height (cm), age (months) and gender, according to the protocols described by Lohman et al.(Reference Lohman, Roche and Martorell14). Children were weighed without clothes using a digital scale (maximum capacity of 15 kg, precision of ±5 g; Kratos, Embu, SP, Brazil) for children lighter than 15 kg or a platform scale (maximum capacity of 150 kg, precision of ±100 g; Filizola, Sao Paulo, SP, Brazil) for those heavier than 15 kg. Length (for infants) was measured using a horizontal ruler on a plane surface, while height (for children older than 24 months) was measured using a fixed vertical rule with 0·1 cm increments.
Indices for evaluating nutritional status included weight-for-age Z-score (WAZ), height-for-age Z-score (HAZ) and weight-for-height Z-score (WHZ) according to the NCHS standards(3) and calculated using the Epi-Info software version 6·0 (Centers for Disease Control and Prevention (CDC), Atlanta, GA, USA)(Reference Dean, Dean and Columbier15).
Nutritional recovery was defined as the change in WAZ, HAZ and WHZ from admission to discharge. From these constructs, the following four categories were formed: (i) no or negative change; (ii) an increase in Z-score of 0·01 to 0·50; (iii) an increase in Z-score of 0·51 to 1·00; and (iv) an increase in Z-score greater than 1·00. The discharge criterion was HAZ or WAZ greater than or equal to –1·645(Reference Frisancho12).
Data on fetal maturity and birth weight were obtained from the newborn’s health card, from the maternity hospital or, if the family no longer had the health card, from the mother. Children with birth weight less than 2500 g were classified as low birth weight (LBW) and those who were born at term and with LBW were classified as small for gestational age (SGA).
Morbidity for each child was assessed through the rate of disease, identified through clinical and laboratory evaluations. The socio-economic status of each family was assessed using available data on the level of maternal education and family income. Ethnicity was not evaluated because many of the children were of mixed backgrounds.
Statistical analyses
Multiple linear regression analysis was used to determine those factors contributing to gains or losses of weight and height. Only those variables for which the P value was <0·20 in the univariate analyses were allowed to remain in the multiple linear regression models. Outcome variables included WAZ and HAZ and the independent variables included in the models were age, gender, maternal education and the presence of SGA, as these factors are plausible confounding factors.
The four constructed groups were compared according to some explanatory variables: by ANOVA for those variables which had a continuous normal distribution (such as duration of treatment, severity of malnutrition, maternal education, birth weight); by the χ 2 test for categorical variables (gender, fetal development, presence of SGA); or by the Kruskal–Wallis test for those variables with a continuous non-parametric distribution (morbidity indices, age at admission). All data analyses were conducted using Epi-Info 6·0 (CDC) or the STATA statistical software package version 8·0 (Stata Corporation, College Station, TX, USA).
The protocol of the study was approved by the Ethics Committee of the Universidade Federal de São Paulo and a signed informed consent was obtained from the mother of each child enrolled in the study.
Results
Data on baseline characteristics and changes in height and weight of all children are presented in Table 1. Among the 106 children studied, ninety-eight (92·5 %) recovered at least one anthropometric index and seventy-two (67·9 %) recovered in both weight and height. Almost half of the children presented a nutritional recovery (increase in Z-score) of more than 0·50 in HAZ (46·2 %) and almost 40 % in WAZ (38·7 %). Mean change in WAZ, HAZ and WHZ of all children studied from admission to discharge was 0·476, 0·508 and 0·193, respectively (Fig. 1).
Table 1 Distribution of children (n 106) aged 0 to 72 months living in southern Sao Paulo, Brazil, according to their nutritional recovery after treatment in a daily care service
WAZ, weight-for-age Z-score; HAZ, height-for-age Z-score.
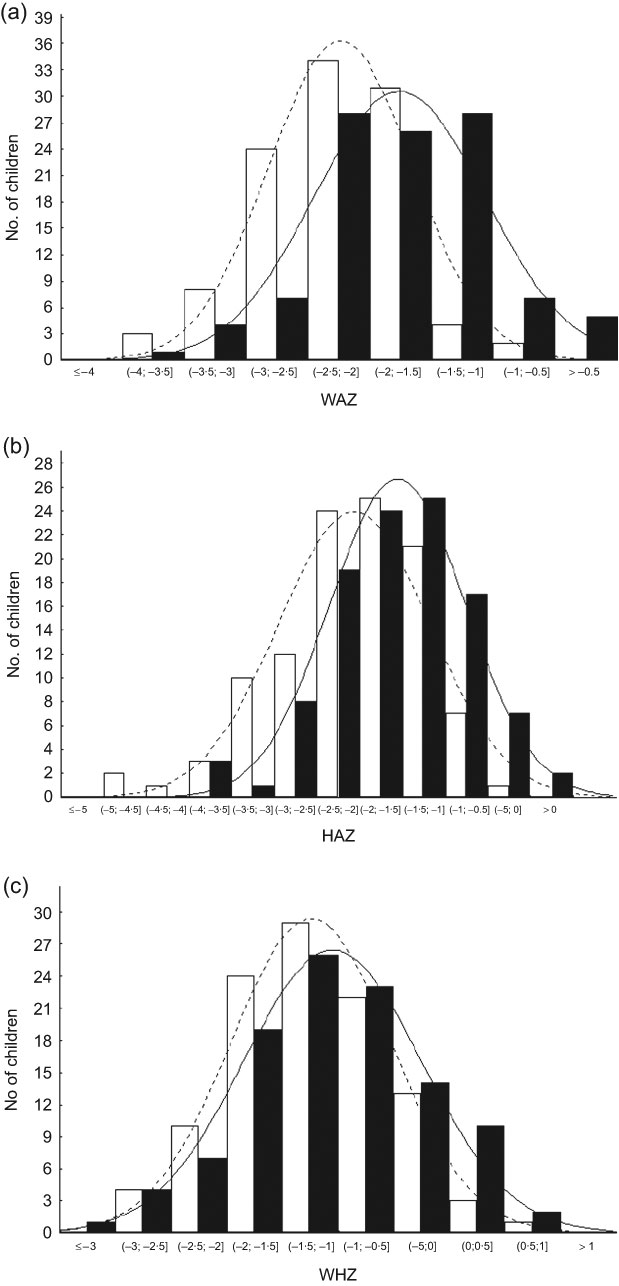
Fig. 1 Evolution of (a) weight-for-age Z-score (WAZ), (b) height-for-age Z-score (HAZ) and (c) weight-for-height Z-score (WHZ) from admission (![]() ) to discharge (
) to discharge (![]() ) in children (n 106) aged 0 to 72 months living in southern Sao Paulo, Brazil, who attended a daily care service. Average increment in WAZ, HAZ and WHZ was 0·476, 0·508 and 0·193, respectively
) in children (n 106) aged 0 to 72 months living in southern Sao Paulo, Brazil, who attended a daily care service. Average increment in WAZ, HAZ and WHZ was 0·476, 0·508 and 0·193, respectively
The characteristics of children who experienced a gain in weight and height are summarized in Table 2. The average age of the children at admission was 23·7 months with an equal proportion of boys and girls. Neither age nor gender was associated with the nutritional recovery pattern. The average duration of treatment was 16·4 months for all children and longer treatment was associated greater gain in both WAZ and HAZ.
Table 2 Characteristics of weight and height gain according to the studied variables among children (n 106) aged 0 to 72 months living in southern Sao Paulo, Brazil, who attended a daily care service

WAZ, weight-for-age Z-score; HAZ, height-for-age Z-score; URTI, upper respiratory tract infection; LRTI, lower respiratory tract infection.
*Kruskal–Wallis test.
†χ 2 test.
‡One-way ANOVA test for linear trend.
§χ 2 test for linear trend.
The mean birth weight of all children was 2563 g and approximately 40 % of the children were classified as LBW. The height gain was statistically different according to birth weight, being greater among those who were born smaller. The same was not found for weight gain. The frequency of SGA was significantly greater among children who presented greater height gains.
Considering nutritional status at admission, only WAZ was significantly associated with weight gain. However, height gain was associated with both WAZ and HAZ at admission.
The most prevalent diseases during treatment were upper respiratory tract infection (URTI), which 82 % of the children developed at least once, 44 % experienced diarrhoea and 18 % had lower respiratory tract infection. The monthly frequency of URTI was associated with weight gain but not height gain. None of the acute diseases was associated with nutritional recovery. In addition, maternal education was not associated with the pattern of nutritional recovery.
Using multivariate analysis, duration of treatment and WAZ at admission were significant contributors to the increment in WAZ after adjustment for confounders, explaining 25 % of the variance in weight gain. For HAZ, duration of the treatment, HAZ at admission and WAZ increment were significantly associated with HAZ increment, explaining 62 % of the variance in height gain (Table 3).
Table 3 Linear regression for gain in HAZ among children (n 106) aged 0 to 72 months living in southern Sao Paulo, Brazil, who attended a daily care service

HAZ, height-for-age Z-score.
Birth weight, sex, maternal education (P > 0·2) were excluded from the model.
Discussion
Recovery process
The prevalence of undernutrition remains relatively high throughout many developing regions of the world(Reference de Onis, Frongillo and Blossner1), suggesting that it is important and necessary to improve our understanding of factors that promote recovery in weight or height. There have been very few studies that have addressed the changes in height or weight for children who attend ambulatory treatment centres. However, improving our understanding of such changes will not only improve our knowledge in this area, but also contribute greatly to the treatment processes involved in combating undernutrition. Briefly, based on our data, we found that almost all of the children who attended CREN recovered height or weight and 70 % recovered both height and weight.
Currently, the literature demonstrates that the earlier one starts the nutritional recovery process the better outcomes one gets(Reference Prader16). It is normally reported that the average age at admission in centres for nutritional recovery is 12 months or less(Reference Colecraft, Marquis and Bartolucci6, Reference Pizarro, Rodriguez and Atalah17). In the present study, no difference was found among groups of patterns of recovery and the average age at admission was 24 months, twice that reported in other studies. Given these data, it would appear that age becomes less important in terms of nutritional recovery, but other studies on younger age groups are needed to validate this.
Duration of treatment
Apart from age, we found that a longer duration of treatment improved gain in WAZ and HAZ. Previous studies have reported that treatment duration can vary from 21 days to 12 months(Reference Pecoul, Soutif and Hounkpevi18), and outcomes such as weight gain, stabilization of WHZ and height recovery vary as well(Reference Pizarro, Rodriguez and Atalah17, Reference Massa, Lopez de Romana and Kanashiro19, Reference Perra and Costello20). Yet treatment duration is among the factors that contribute to the success of nutritional interventions since it may modulate the velocity of recovery, an important factor for current, as well as future, health.
Abundant evidence exists to support the association between growth patterns and adult chronic diseases, suggesting that rapid growth during some life periods increases the risk for these diseases(Reference Barker, Osmond and Forsen21). In fact, rapid nutritional recovery among malnourished children was described in the literature in several countries. For example, in Chile, where in the 1980s many nutritional recovery centres were created, rapid gains in weight and height were reported(Reference Monckeberg22). However, this recovery pattern is questionable, since in premature or intra-uterine growth retarded infants impairment in the quality of synthesis of tissues during the recovery period may occur(Reference Weisstaub and Araya23). In our study, the recovery pattern was of simultaneous gain in weight and height, with duration of treatment superior than other studies.
According to Prader(Reference Prader16), there is a system that regulates the velocity of linear growth depending on the distance between current height and expected height. In a retrospective study with 369 malnourished children followed in a university hospital, for height recovery it was necessary first to have WHZ close to 85 % of the adequate one, allowing a catch-up in linear growth(Reference Walker and Golden24). As we reported, the gains in weight and height in the children studied occurred concomitantly. This observation may be explained by the fact that the average WHZ at admission among the studied population that was –1·22, i.e. more than the 85 % of the median of the NCHS reference.
Nutritional status at admission
We found that children with worse nutritional status at the beginning of treatment presented a greater gain in HAZ. Furthermore, it was found that deficits in HAZ at admission were significantly associated with gains in HAZ during the nutritional recovery process. Similar findings were described by Walker and Golden(Reference Walker and Golden24). Also, catch-up growth may be a compensatory phenomenon that occurs in young children after periods of retardation, but the mechanisms remain unclear(Reference Prader16). In addition, the recovery process appears to be highly dependent on the severity and duration of the nutritional impairment(Reference Walker and Golden24–Reference Golden26). Similar to these studies, we found that the children with lower birth weights were more likely to have a greater rate of recovery; in particular, gain in HAZ was greater when birth weight was lower. Birth weight is an important health marker. It reflects intra-uterine life and is a prognostic factor of nutritional and health conditions. This hypothesis is further confirmed by our data showing a greater gain in height for children born SGA.
In summary, our findings show that nutritional recovery among children who attended the CREN was influenced primarily by the degree of nutritional deficit at admission. Moreover, our results demonstrate that malnourished children may have a recovery pattern that is balanced in terms of gains in weight and height, which may be protective against development of adult chronic diseases. It has also been shown that biological variables are more important than socio-economic status in determining the rate of nutritional recovery. However, the lack of association may due to the homogeneity of the socio-economic conditions of the families who participated in the study.
A limitation of the study is that it lacked a comparison group. However, when undernourished children were identified and recruited to participate in the study, they were immediately sent to receive treatment. It would have been unethical to identify undernourished children without providing treatment.
In conclusion, based on our data, we found that providing a normal diet in an outpatient or daily care service, such as CREN, promotes a process of balanced nutritional recovery with simultaneous increments in WAZ and HAZ. Nevertheless, further research is warranted to determine if balanced nutritional recovery decreases the risk chronic diseases in adulthood, especially as the prevalence of such diseases continues to increase in developing and transitional countries.
Acknowledgements
Sources of funding: The study was supported by a project grant from the FAPESP (Fundação de Amparo à Pesquisa do Estado de São Paulo). Conflict of interest declaration: None of the authors had a conflict of interest. Authorship responsibilities: M.F.A.V. was responsible for conducting all of the fieldwork, manuscript preparation and participated in all phases of this study. M.T.B.F. and M.H.N.S. took a lead role in the data collection. A.A.F. helped in statistical analysis of the data and preparing the manuscript. A.L.S. contributed to the design of the original study and revision of the final manuscript. Acknowledgements: The authors thank all CREN staff and participants and their families for their important contributions.


