


The number of cases of type 2 diabetes (T2D) in the USA increases each year across all ages and nationalities. A total of 1·6 million new cases were diagnosed in 2007 alone(1–3). Individuals with T2D are at increased risk for developing CVD. Men and women with T2D have a two to three and three to four times greater risk, respectively, of developing CVD than do those without T2D(Reference Goff, Gerstein and Ginsberg4, Reference Grundy, Benjamin and Burke5). CVD is also the leading cause of T2D-related deaths, contributing $US 3·8 billion to hospital costs for diabetes-related complications(6).
Various health organizations have created specific dietary guidelines for the growing population of adults living with T2D. The aim of these guidelines is to decrease the severity of diabetes-related complications by controlling blood glucose and lipid levels; they do not focus on the elements specifically associated with reduced risk of CVD(7–9). Further, specific recommendations made by the American Diabetes Association (ADA) to reduce the risk of CHD are brief, and there have been no studies indicating that following these recommendations will decrease an individual's CVD risk(Reference Bantle, Wylie-Rosett and Albright10).
Historically, diets developed to reduce the risk of disease have been studied one nutrient at a time, focusing on associations between a specific nutrient intake and a specific health outcome. It is widely accepted, however, that overall diet is of greater importance than just one nutrient alone; as a result, the diet index was developed to measure an individual's overall compliance with an entire diet(Reference Kant and Graubard11). A given index includes the most important dietary components of a particular diet and then scores compliance with those components on the basis of a rubric developed for that index. Because different dietary indices measure adherence to the nutritional criteria on which the index is based, choosing an appropriate index is important(Reference Haines, Siega-Riz and Popkin12). Indices can also be used to determine which guidelines are most associated with positive health outcomes(Reference Kant and Graubard11).
The Healthy Eating Index (HEI) is used to measure overall diet quality in accordance with the federal dietary guidelines that were established to promote health and reduce the risk of chronic diseases(Reference Basiotis, Carlson and Gerrior13). Nevertheless, there is little evidence of an association between the use of the HEI dietary pattern and reduced risk of chronic diseases. However, use of the Alternate Healthy Eating Index (AHEI) to measure dietary patterns has been associated with a decrease in the risk for CVD in healthy populations(Reference McCullough, Feskanich and Stampfer14–Reference McCullough, Feskanich and Rimm16). The AHEI takes into consideration components of the Dietary Guidelines for Americans (i.e. increased fruit and vegetable intakes), as well as the quality within each food group. For instance, the AHEI distinguishes between whole grains and refined flour. Evidence suggests that whole grains have a protective effect on CVD, whereas refined flour does not(Reference Panagiotakos, Pitsavos and Chrysohoou17). In addition, the AHEI considers the proportions of white meat (fish and poultry) and red meat in the diet. White meat has been shown to decrease the risk of CVD, whereas red meat has been associated with increased risk for CVD(Reference Mellen, Walsh and Herrington18). The AHEI also includes a component for non-meat proteins (i.e. nuts, seeds, soya), whereas the HEI does not. The scoring of fats is another area of difference between the dietary patterns. Higher consumption of mono- and polyunsaturated fats and lower consumption of trans fats show a higher score in the AHEI as compared with the HEI. Moderate alcohol consumption is also scored in the AHEI(Reference McCullough and Willett19).
The prevalence of diabetes among three major Hispanic subgroups living in the USA was estimated by the Hispanic Health and Nutrition Survey (HHANES) from 1982 to 1984(Reference Flegal, Ezzati and Harris20). Cuban Americans aged 45–75 years had the lowest combined prevalence of undiagnosed and diagnosed diabetes (9·9 % and 5·9 %) compared with Mexican Americans (9·6 % and 14·3 %) and Puerto Ricans (11·8 % and 14·3 %)(Reference Flegal, Ezzati and Harris20). Over the past 25 years, however, the prevalence of diabetes has increased among Hispanics, in particular among Cuban Americans, who have a higher incidence of diabetes (8·2 %) as compared with non-Hispanic whites (6·6 %). In addition, the death rates of Cuban Americans from complications arising from diabetes are twice as high as those of non-Hispanic whites(21). A recent secondary data analysis from HHANES showed significant differences in diabetes- and CVD-related risk factors across Hispanics(Reference Aponte22). Cuban Americans had higher cholesterol, TAG, SBP (systolic blood pressure), DBP (diastolic blood pressure) and blood urea nitrogen compared with Puerto Ricans and Mexican Americans. They also had a higher proportion of diabetes as the underlying cause of death compared with their US Hispanic counterparts (Puerto Ricans and Mexican Americans)(Reference Smith and Barnett23). Puerto Ricans, however, had a higher BMI compared with Mexican and Cuban Americans(Reference Aponte22).
Although previous studies have shown differences in food choices and macronutrient intakes among Hispanics as a group, further investigations targeting individual Hispanic subgroups are limited(Reference Loria, Bush and Carroll24, Reference Kant and Graubard25). The latest available data on the dietary habits of Hispanics were collected using HHANES. Compared with other Hispanics, Cuban Americans had the highest mean intake of protein and the lowest mean intake of total fat. Further, older Cuban Americans and Puerto Ricans had a higher percentage of energy from carbohydrates compared with Mexican Americans and non-Hispanics(Reference Loria, Bush and Carroll24). It was documented that Hispanics were not in compliance with the recommendations of the Food Guide Pyramid. Fruit and vegetables were reported to be the least consumed food group among Hispanics(Reference Kant and Graubard25).
The rising incidence of T2D, combined with a lack of research on health outcomes of persons with T2D following a CHD-specific diet, suggests that further investigation of this topic would be beneficial. Further, no studies have investigated the relationship between dietary patterns and chronic diseases in the Cuban-American population exclusively. Therefore, we hypothesized that high scores on the HEI or AHEI (corresponding to healthy eating) would be negatively associated with the 10-year predicted CHD risk in Cuban Americans. It was further hypothesized that this association would be stronger for persons with T2D. One implication is that an association between higher HEI or AHEI scores may reduce the risk of CVD and may lead to changes in dietary guidelines. Therefore, the objectives of the present study were to examine the relationship between dietary patterns as measured using HEI and AHEI and 10-year predicted CHD risk in Cuban Americans, and determine whether this association varies by T2D status while controlling lifestyle factors.
Design and methods
Participants
The present cross-sectional study was conducted in Cuban Americans with and without T2D. Recruitment was conducted by alternating between selecting potential participants with T2D and those without T2D, matching participants by age group (Fig. 1). The participants were initially recruited by random selection (every tenth address) from two randomly generated mailing lists. The lists of addresses were purchased from Knowledge Base Marketing Inc. (Richardson, TX, USA). This company provided two mailing lists generated from multiple databases of Cuban Americans, identified as having or not having T2D, from Miami Dade and Broward Counties, FL, USA. During a 1-year period, approximately 10 000 letters in English and Spanish explaining the study and containing contact information with an invitation flyer were mailed to participants with and without T2D who were aged ≥30 years. In all, 3 % (n 300) of the letters were returned because of unknown addresses. From the remaining delivered letters, 4 % (n 388) responded. Interested participants were initially interviewed over the phone, at which time the study purpose was explained and the age and gender of the respondents were determined. To ascertain T2D status, each participant who self-reported having T2D was asked for the age at diagnosis and for initial treatment modalities. Individuals who did not qualify for the study (n 18) were those aged <30 years (n 9), those who were not Cuban Americans (n 2) and those who had other chronic diseases or illnesses (n 7). If an individual was determined to be eligible, then his or her participation was requested at the Human Nutrition Laboratory at Florida International University (FIU). Participants were instructed to refrain from smoking, from consuming any food or beverage except water and from engaging in any unusual exercise for at least 8 h before collection of their blood sample. The present study was approved by the Institutional Review Board at FIU. The purpose and protocol of the study were explained to the participants and their written consent, either in Spanish or English, was obtained before the commencement of the study. Laboratory results showed that seven participants who reported not having T2D were reclassified as having T2D according to ADA standards. These participants were given their laboratory results and referred to their physicians. For data analysis, participants with missing values (n 9) or who had an energy intake >20 920 kJ (5000 kcal; n 3) were excluded. A total of 358 participants with (n 184) and without (n 174) T2D who were ≥30 years of age were included in the data analysis.

Fig. 1 Recruitment procedure (T2D, type 2 diabetes)
Blood sample collection
In all, 20 ml of venous blood was collected from each participant after an overnight fast (at least 8 h) by a certified phlebotomist using standard laboratory techniques. Blood samples were collected in two tubes: a Vaccutainer serum separator tube (SST) for analysis of lipids and glucose and another tube containing EDTA to analyse glycosylated Hb (A1c). After complete coagulation (30–45 min), the SST was centrifuged at 2500 rpm for 30 min. The serum was transferred from the spun SST into two labelled plastic tubes: the first tube was used for glucose analysis and the second tube was used for a lipid panel. Glucose levels were measured using hexokinase enzymatic methods and the lipid panel was assayed using enzymatic methods. A1c percentages were measured from whole-blood samples using the Roche Tina Quant method by the Laboratory Corporation of America (LabCorp®, Miami, FL, USA).
Anthropometric measurement
Waist circumference (WC) to the nearest 0·1 cm was measured horizontally with a non-stretchable measuring tape placed midway between the twelfth rib and the iliac crest at minimal respiration to determine central obesity.
Physical activity
Levels of leisure and occupational physical activities were assessed using the Modifiable Activity Questionnaire (MAQ)(Reference Kriska26). The validity of this questionnaire has been measured among participants at risk for T2D(Reference Kriska, Pereira and Hanson27). In addition, the MAQ assesses both current and over-the-past-year leisure and occupational activities. From a list of popular activities (i.e. jogging, bicycling, basketball), participants indicated all leisure activities performed at least ten times over the past year and estimated the number of months, frequency per month and duration of each activity. For occupational activity, participants reported all jobs held over the past year. Information was collected on number of hours the participant remained in a sitting position at work, usual mode of transportation to work and average job schedule for each job reported. Total physical activity (PA) was calculated, summing all leisure and occupational activity hours per week. Thereafter, these values were multiplied by the estimated metabolic cost of each activity to obtain metabolic equivalents (MET) per hour per week.
Assessment of dietary intake and diet-quality scores
Dietary intake was measured using the semi-quantitative FFQ (97GP 2006 version copyrighted at Harvard University, Boston, MA, USA) developed by Walter C Willett, which has been extensively validated and standardized in several multiethnic population-based prospective and cross-sectional studies(Reference Willett, Sampson and Stampfer28, Reference Caan, Slattery and Potter29). Willett's FFQ has also been validated exclusively for the Cuban-American population(Reference Nath and Huffman30). On this FFQ, participants self-report average consumption of specified amounts of various foods over the past year, choosing from frequency responses ranging from ‘never’ to ‘six or more servings per day’. In addition to food items, Willett's FFQ includes questions about the type and duration of vitamin/mineral supplement use, alcohol consumption and specific details about fat, salt and sugar used in cooking and as condiments. Daily servings of food groups were calculated by summing frequency factors (which corresponded to reported consumption frequency) for all related food items. Macro- and micronutrient intakes were calculated by multiplying frequency of consumption by the nutrient value of the food item obtained from the Harvard University Food Composition Database. Each of the completed Willett's FFQ was reviewed for incomplete answers or blank responses before completion of the interview.
The HEI score was calculated from Willett's FFQ in a manner similar to that used by McCollough et al.(Reference McCullough, Feskanich and Stampfer15, Reference McCullough, Feskanich and Rimm16). The first five components were related to food groups: meat (meat, poultry, nuts, dry beans, eggs and legumes), milk, fruit, vegetables and grains. The next five items were related to nutrient intake: total fat consumption, saturated fat, cholesterol, Na and a variety of food choices. Each component was scored on a scale of 1–10 on the basis of the participants’ consumption level, with 10 being a perfect score. The recommended serving size varied on the basis of age and gender. The scores for all components were calculated on the basis of the original HEI rubric, except for the last component ‘variety’. The score for the component ‘variety’ was calculated using the number of different foods, of at least one-half of a serving in a food group, consumed daily (scores ranged from 22 to 61). The total of these ten components provided the HEI score, with 0 being the worst possible score and 100 being the best score.
The AHEI score was calculated using the AHEI developed by McCullough et al.(Reference McCullough, Feskanich and Stampfer14); scoring details and the rationale have been reported in detail elsewhere. On the basis of the responses from Willett's FFQ, a score between 1 and 10 was assigned for nine different components: vegetables, fruit, nuts and soya protein, alcohol (all in servings/d), ratio of white to red meat, cereal fibre, ratio of PUFA to SFA (all in g/d) and trans fat (%E). Each of these components contributed a maximum of 10 points; scores were continuous and based on how fully the recommended amount of each food item was met. The only food component scored dichotomously was multivitamin use, for which participants were assigned either 2·5 points for multivitamin use of <5 years or 7·5 points for multivitamin use of ≥5 years. Consequently, the lowest possible AHEI score was 2·5 points and the highest was 87·5 (Table 1).
Table 1 Criterion used to score AHEI and HEI

AHEI, Alternate Healthy Eating Index; HEI, Healthy Eating Index; %E, percentage of energy; P:S, ratio of polyunsaturated to saturated fat; SF, saturated fat; M, men; W, women.
†Scores were calculated proportionally between 0 and 10 according to intakes.
‡Except potatoes.
§The number of recommended servings varies by age and gender.
∥Number of different foods consumed daily, at least one-half a serving in a food group (score range: 22–61), to calculate scores from 0 to 10.
Predicted 10-year CHD risk outcome measurement
The predicted 10-year CHD risk was calculated using the five-step method of the online Adult Treatment Panel III (ATP III), which was created by the National Cholesterol Education Program(31). The risk factors that were included in the calculation of the 10-year CHD risk were age, gender, total cholesterol, HDL cholesterol (HDL-C), SBP, smoking and hypertension medication(s). Demographic data, medical history, family history of diabetes and medication use were all collected using a questionnaire at the time of data collection at the Human Nutrition Laboratory.
Statistical analyses
All statistical analyses were performed using the Statistical Package for the Social Sciences statistical software package version 17·0 (SPSS Inc., Chicago, IL, USA). Descriptive statistics were generated for all variables. Differences in mean values between participants with and without T2D were assessed using Student's t test for numerical values and the χ 2 test for categorical variables. Pearson's correlations were used to determine the relationships of HEI and AHEI scores with 10-year CHD risk and other covariates. Hierarchical linear regression (HLR) models were used to determine whether HEI or AHEI could predict 10-year CHD risk. In the first HLR step, covariates (energy intake, WC and PA) were entered. In the second HLR step, AHEI (or HEI) was entered, followed by diabetes status in the third step. Finally, in the last step, the interaction term of diabetes status by AHEI or diabetes status by HEI was tested. Age, gender, total cholesterol, HDL-C, SBP, hypertension medication(s) and smoking were not included as covariates because these were risk factors used to calculate the 10-year CHD risk score. The significance level for all analyses was set at P < 0·05.
Results
The characteristics of participants with (n 184) and without (n 174) T2D are presented in Table 2. Participants with T2D were significantly older (P = 0·030) and had a higher WC (P = 0·001) compared with those without T2D. Participants without T2D included a higher proportion of women (P = 0·009) and had a higher energy intake (P = 0·034), total blood cholesterol (P = 0·007), HDL-C (P = 0·001) and HEI score (P = 0·006) compared with participants with T2D.
Table 2 Characteristics of participants by diabetes status
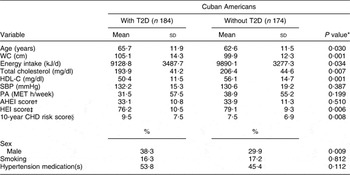
T2D, type 2 diabetes; WC, waist circumference; HDL-C, HDL cholesterol; SBP, systolic blood pressure; PA, physical activity; MET, metabolic equivalents; AHEI, Alternate Healthy Eating Index; HEI, Healthy Eating Index.
*P is considered significant at <0·05.
†AHEI score ranging from 2·5 (worst) to 87·5 (best).
‡HEI score ranging from 0 (worst) to 100 (best).
§Risk factors included to calculate the 10-year CHD risk were: age, gender, total cholesterol, HDL-C, SBP, smoking and hypertension medication(s).
Pearson's correlations indicated that the AHEI score was significantly and negatively correlated with the 10-year CHD risk score (r = −0·227, P < 0·01) for participants with T2D (Table 3). Among participants without T2D, WC and energy intake were significantly and positively correlated with the 10-year CHD risk score (r = 0·258, P < 0·01; and r = 0·154, P < 0·05, respectively).
Table 3 Pearson's correlations of 10-year CHD risk with study variables

T2D, type 2 diabetes; AHEI, Alternate Healthy Eating Index; HEI, Healthy Eating Index; WC, waist circumference; PA, physical activity; MET, metabolic equivalents.
Correlations (two-tailed) are significant at *P < 0·05 and **P < 0·01.
†Risk factors included to calculate the 10-year CHD risk were: age, gender, total cholesterol, HDL cholesterol, systolic blood pressure, smoking and hypertension medication(s).
HLR indicated that, after controlling for confounding variables, AHEI explained 1·7 % of the variation in 10-year CHD risk (F (1,353) = 6·24, P = 0·013). Diabetes status explained an additional 1·4 % of the variability (F (1,352) = 5·30, P = 0·020). Finally, diabetes status moderated the association between AHEI and 10-year CHD risk (F (1,351) = 4·44, P = 0·036, R 2 = 1·2 %). For participants with T2D, there was a significant relationship between AHEI and 10-year CHD risk (β = −0·244, se = 0·049, P = 0·001), whereas for participants without T2D (β = −0·025, se = 0·048, P = 0·737) the relationship was not significant. The model predicted that, on average, for every unit increase in the AHEI score, there would be a 0·24 reduction in the 10-year CHD risk score among participants with T2D. In the present study, a sample size of n 358 yielded 95 % power, determining an R 2 value of 0·057 for the 10-year CHD risk score as predicted by the AHEI or HEI score, diabetes status, energy intake, WC, PA and interaction of diabetes status with diet indices at α = 0·05 (Table 4).
Table 4 Coefficients for AHEI and HEI predicting 10-year CHD risk by diabetes status

AHEI, Alternate Healthy Eating Index; HEI, Healthy Eating Index; B, unstandardized coefficients; β, standardized coefficients; T2D, type 2 diabetes; WC, waist circumference; PA, physical activity; MET, metabolic equivalents; HLR, hierarchical linear regression.
*P is considered significant at <0·05.
†HLR: model F (6,351) = 3·56, P = 0·002, R 2 = 5·7 %.
‡HLR: model F (6,351) = 2·29, P = 0·035, R 2 = 3·8 %.
§Covariates included in the HLR are energy intake (kJ), WC and PA.
Discussion
The findings of the present study indicated that, in individuals with T2D, a higher AHEI score was predictive of, and correlated with, a lower 10-year risk for CHD. Because T2D is an independent risk factor for CHD, this condition alone may increase 10-year CHD risk among participants with T2D compared with those without T2D. Although a previous study of AHEI scores of participants with T2D did not examine CVD or CHD as outcomes, it found a negative relationship between AHEI scores and changes in body weight(Reference Turner-McGrievy, Barnard and Cohen32).
Other research on individuals without T2D has shown that AHEI scores were inversely associated with symptoms of depression among Latinos(Reference Pagoto, Ma and Bodenlos33), with biomarkers of inflammation and endothelial dysfunction(Reference Fung, McCullough and Newby34) and with CVD(Reference McCullough, Feskanich and Stampfer14). The lack of a significant association between the AHEI score and CHD risk in participants without T2D in our study may have been due to the relatively small sample size, which resulted in a smaller range of AHEI scores. It is possible that, in our more homogeneous Cuban-American population, there were fewer high AHEI scores to capture the association with chronic disease risk. Further, categories in the AHEI with the lowest scores in our sample were vegetables, fruit, nuts and soya and ratio of white to red meat (data not shown). This is consistent with data from the HHANES which revealed that Cuban Americans consume no more than one serving of fruit and vegetables per day and frequently consume pork and beef(Reference Nath35). In our study, WC and energy intake were significantly correlated with CHD risk, suggesting that there are factors other than dietary quality that influence CHD risk in individuals without T2D.
The present study did not show an association between HEI score and risk of CHD among Cuban Americans, regardless of diabetes status. This finding is consistent with those of two other studies conducted with representative samples from the USA, which found either no relationship (women) or only a very weak inverse association (men) between HEI score and CVD(Reference McCullough, Feskanich and Stampfer15, Reference McCullough, Feskanich and Rimm16). The main factor contributing to the lack of association is the fact that the components used to calculate the HEI were not specific to CHD prevention. Meat was not separated into red and white; importantly, red meat has been shown to elevate the risk of CHD, whereas white meat has been shown to decrease it(Reference Mellen, Walsh and Herrington18). In addition, it is well established that whole grains and cereal fibre decrease the risk of CHD, whereas increased consumption of refined flour can increase CHD risk; grains were also measured as a single component(Reference Panagiotakos, Pitsavos and Chrysohoou17).
Inconsistent findings from the present study suggested that eating indices designed for the US population may need to be modified for use in the Cuban-American population. For example, nut consumption and multivitamin use were chosen as AHEI components on the basis of results from the Nurses’ Health and Men's Health Professional Studies(Reference McCullough, Feskanich and Stampfer14, Reference Hu, Stampfer and Manson36), which included only a small sample of Hispanics. One trial assessed nut consumption and CVD biomarkers in five ethnicities and found them to be protective of CVD in a Caucasian population but not in a Hispanic population(Reference Jiang, Jacobs and Mayer-Davis37). Multivitamin use in reducing chronic disease has not been analysed in an exclusively Hispanic group, although the benefits of its use are still inconclusive in any population(38). Nevertheless, to our knowledge, ours is the first study that has examined the relationship between dietary indices and 10-year predicted CHD risk in the Cuban-American population exclusively. Previous research has shown differences in lifestyle factors and diet, as well as in predictors for diabetes and CHD, among Hispanics. As such, by investigating a specific Hispanic group, the present study contributed to much-needed information on the association between dietary patterns and CHD risk for a minority with health disparities.
Limitations of the present study include a relatively small sample size of Cuban Americans, especially when the sample was stratified by diabetes status. Nevertheless, a sample size of n 358 achieved 95 % power, determining an R 2 value of 0·057 for the 10-year CHD risk score predicted by the AHEI or HEI score, diabetes status, energy intake, WC, PA and interaction of diabetes status with diet indices at α = 0·05. Further, the cross-sectional design could not establish a causal relationship between eating indices scores and CHD risk. Another possible limitation was non-response bias; participants who responded and participated might differ from those who did not with regard to variables included in the analysis. The low response rate (4 %) indicates that our sample may not be representative of the general Cuban-American population of Miami Dade and Broward Counties. This low response rate was expected because of their political history; many Cuban Americans are concerned about government control and therefore are less likely to share information with any organization(39).
Knowledge Base Marketing Inc. received data from multiple original sources, including telephone directories, public records, US census data, consumer surveys and purchase transactions, and cross-matched information among these sources to confirm data. Because a combination of multiple databases was used, sample bias might have been minimized. However, we cannot guarantee that the data were bias free and that these were the best data on which to base the recruitment of our target population. Capturing an accurate measure of the diet while using Willett's FFQ depends on the participants’ recall ability (over- or under-reporting biases) and the food list included in Willett's FFQ, which could affect the scores from the HEI and AHEI. Nevertheless, Willett's FFQ (97GP 2004 version copyrighted at Harvard University) was validated in a sample of Cuban Americans with regard to their 3 d food records(Reference Nath and Huffman30). The HEI, but not the AHEI, was previously used to assess the diet of a Cuban-American population(Reference Marks, Garcia and Solis40); however, dietary patterns measured by the AHEI were reported among Latinos(Reference Pagoto, Ma and Bodenlos33).
Finally, the outcome of the study was based on a probability model of a 10-year predicted CHD risk and not on evidence of a diagnosis of CHD, and no confidence intervals could be provided for the risk estimated. However, a predicted CHD risk score provides a convenient way for physicians to assess and prevent CHD or CVD among patients.
Conclusions
The lack of association between HEI scores and CHD risk among this Cuban-American population supports the argument that the HEI cannot adequately predict chronic disease risk. The AHEI considers the components of dietary guidelines for Americans (i.e. increased fruit and vegetable intakes) and also differentiates quality within each food group. The idea that manipulating its components may improve AHEI as a tool to predict CHD risk is supported by the results of the present study, as higher AHEI scores predicted decreased CHD risk among Cuban Americans with T2D. The fact that results were replicated in a high-risk minority population suggests that the specific aspects of the dietary pattern may have value in other high-risk populations. Although further research needs to be conducted to fully understand why the results did not apply to Cuban Americans without T2D, this research recommends the use of AHEI as an assessment tool to identify and modify dietary patterns as a means of decreasing CHD risk among individuals with T2D.
Acknowledgements
The present research was funded by a grant sponsored by NIH/MBRS/SCOREAC124401529/42. The authors did not declare any direct or indirect conflict of interest with respect to the funding of this research. All co-authors take responsibility for and participated in the intellectual content, study design and/or data analysis, as well as in revisions and final approval. F.G.H. obtained the funding, contributed to acquisition, analysis and interpretation of data and to the conception and design of the manuscript; G.G.Z. contributed to the acquisition, analysis and interpretation of data and to the conception and design of the manuscript; A.N. and E.M. contributed to the analysis and interpretation of data and to the conception and design of the manuscript. We thank Sharon L. Bear for her editorial services.


