


Malnutrition is a frequent syndrome in the elderly. It refers to faulty or inadequate nutritional status, undernourishment characterized by insufficient dietary intake, poor appetite, muscle wasting and weight loss( Reference Chen, Schilling and Lyder 1 ).
Malnutrition prevalence varies from 10 % to 85 % in different older age groups around the world due to the different assessment methods used( Reference Margetts, Thompson and Elia 2 ). A combined database( Reference Kaiser, Bauer and Rämsch 3 ) from all five continents including 4507 people reported a mean prevalence of 22·8 %, with considerable differences among settings (rehabilitation, 50·5 %; hospital, 38·7 %; nursing home, 13·8 %; community, 5·8 %). In this combined database, the ‘at risk’ group had a mean prevalence of 46·2 %. In Spain, a prevalence of malnutrition among the elderly living at home of 12·5 % was reported and 57·5 % for those who were at risk( Reference De La Montana and Miguez 4 ).
Nutritional status or nutritional risk screening should be incorporated in comprehensive assessments of the elderly population( Reference Salvà and Pera 5 ). Age-associated physiological and psychological alterations, functional or cognitive impairment and socio-economic aspects are considered among the main determinants of malnutrition( Reference Valls and Mach 6 ), being associated with multiple risk factors( Reference Ferdous, Kabir and Wahlin 7 – Reference Boulos, Salameh and Barberger-Gateau 9 ): female sex, age more than 85 years, low socio-economic level and health status (higher number of co-morbidities or polypharmacy). Regarding co-morbidity, the presence of chronic diseases, such as depression or cognitive impairment, has been related to increased risk of malnutrition( Reference Ferdous, Kabir and Wahlin 7 , Reference Rodríguez-Tadeo, Wall-Medrano and Gaytan-Vidaña 10 ). Additionally, a loss of weight was observed among hospitalized depressed elderly people( Reference German, Feldblum and Bilenko 11 ). Furthermore, the effects of drug therapy may have physical manifestations such as anorexia or malabsorption of nutrients( Reference Cowan, Roberts and Fitzpatrick 12 ). Most of the studies on polypharmacy and nutritional status concluded that use of a high number of prescription medications was associated with worse outcomes in the Mini Nutritional Assessment (MNA)( Reference Jyrkkä, Mursu and Enlund 13 ).
Nutritional deficit, with a significant effect on quality of life, is also a clear determinant of frailty in the elderly. Frail institutionalized or hospitalized elders( Reference Dorner, Luger and Tschinderle 14 ), as well as frail people living in the community( Reference Jürschik, Botigué and Nuin 15 ), have a greater risk of malnutrition.
This health problem is linked to a high risk of morbidity/mortality, longer hospitalizations, along with more frequent readmissions, premature nursing home placements and decreased survival time( Reference Chen, Schilling and Lyder 1 , Reference Schilp, Wijnhoven and Deeg 16 ). Therefore, early screening aimed to identify potential risk factors for conducting a preventive intervention is necessary.
To our knowledge, although the determinants of malnutrition have been previously investigated, research has not considered multiple health factors with a possible joint effect providing a joint likelihood for poor nutritional status in a large population study. Besides, most previous studies have involved frail or institutionalized elderly, but not healthy elders as main targets for early screening and prevention.
Based on the above, the aim of the present study was to determine the prevalence of malnutrition or risk of malnutrition in a representative community-dwelling elderly population and to examine the association between nutritional status and variables referred to the person, specifically sociodemographic and health factors (co-morbidity, cognitive or affective problems, prescription medication use, frailty status and self-rated health) that affect their quality of life.
Materials and methods
Selection and description of participants
Data used were from baseline assessments of the VERISAÚDE (Effectiveness of the Comprehensive Gerontological Assessment and longitudinal follow-up in the healthy ageing promotion) project, which is a large longitudinal study (in the present study, we are using the cross-sectional data) covering a sample of 749 community-dwelling elderly people representative of the Galician population (north-western Spain), aged ≥65 years, living at their home and attending senior centres. Older adults were recruited from forty-three local senior centres. They were invited to participate in the project in different ways and through multiple sources. Associations for the elderly in Galicia were asked to issue an announcement of the study in their centres, by using flyers and word of mouth, so that people who were interested in participating could register. The participants were involved on a voluntary basis and were recruited by representatives of the associations involved in the project. The distribution of the sample by age and sex was similar to that of the entire Galician elderly population, according to the municipal register of the 2011 National Health Survey( 17 ). The level of confidence was 95 %, accuracy ±4 % and estimation of data losses 20 %. From October 2013 through March 2014, a comprehensive gerontological assessment was conducted.
The inclusion criteria for the participants were as follows: (i) being ≥65 years of age; (ii) be actively enrolled in a Galician association or senior centre; and (iii) willingness to sign the informed consent form. The exclusion criterion for the sample was inability to perform the comprehensive gerontological assessment.
Variables and instruments
The instruments were administered by a multidisciplinary team of professionals with experience in gerontological assessment (clinical psychologists, nurses, occupational therapists, social workers) and were trained to unify criteria.
Sociodemographic factors
Information on age, sex and educational level was self-reported. Educational level was categorized into three levels according to years of formal education: ≤8 years, 9–17 years and ≥18 years.
Health aspects
Nutritional status
The Mini-Nutritional Assessment–Short Form (MNA-SF)( Reference Kaiser, Bauer and Ramsch 18 ) is made up of six questions extracted from the full MNA questionnaire( Reference Guigoz, Vellas and Garry 19 ): (i) appetite loss or eating problem; (ii) recent weight loss; (iii) mobility; (iv) acute disease or psychological stress; (v) neuropsychological problems (dementia or depression); and (vi) BMI. The MNA-SF has been identified, in a study including 22 007 elders, as a suitable screening tool to detect malnourished elders and those at risk for malnutrition, correlating strongly with the full MNA version (r=0·85)( Reference Cuervo, García and Ansorena 20 ). The Spanish version of the MNA-SF downloaded from the MNA website was used in the present study( 21 ). The total score of the MNA-SF screening test ranges from 0 to a maximum score of 14 points. Those receiving ≤11 points were classified as malnourished or at risk of malnutrition, whereas well-nourished individuals had a score of ≥12 points. Two comparison groups were established in the present study: low MNA-SF score (≤11 points) v. normal MNA-SF score (≥12 points), following the dichotomization made by other authors with the MNA (normal nutritional status v. malnutrition/risk)( Reference Gil-Montoya, Ponce and Sánchez Lara 22 , Reference Saka, Kaya and Ozturk 23 ).
BMI categorization
The research staff measured weight and height according to standardized protocols. BMI was estimated by dividing weight (kilograms) by the square of height (in metres). A clothing adjustment of approximately 0·8 kg for women and 1·2 kg for men was made( Reference Whigham, Schoeller and Johnson 24 ). According to the WHO criteria( 25 ), patients were categorized as not overweight if BMI<25·0 kg/m2 and as overweight or obese if BMI≥25·0 kg/m2.
Co-morbidity
For all patients, we calculated the value of the Charlson Comorbidity Index (CCI)( Reference Charlson, Pompei and Ales 26 ). All nineteen chronic conditions assessed in the survey were given a CCI weight (from 1 to 6) taking into account both the number and seriousness of the co-morbid disease, which ranged from 0 to 37 points. For each patient, a CCI-aged adjusted score was computed, coding co-morbid diseases as 0=absent and 1=present.
Cognitive and affective assessment
Global cognitive status was assessed by qualified clinical psychologists using the Spanish version of the Mini-Mental State Examination (MMSE)( Reference Folstein, Folstein and McHugh 27 ), which examines five areas of cognitive function: (i) orientation to time and place; (ii) short-term memory; (iii) attention; (iv) visual spatial skills; and (v) language and praxis. MMSE scores, ranging from 0 to 30, were adjusted for age and level of education, and participants were considered as cognitively impaired if they scored ≤24 points( Reference Blesa, Pujol and Aguilar 28 ).
Depressive symptoms were also assessed by a psychologist, using the short form of the Geriatric Depression Scale (GDS-SF)( Reference Sheikh and Yesavage 29 ), a fifteen-item scale specifically developed for screening depressive symptoms in elderly populations. We specifically administered a Spanish-validated version of the test adapted for patients aged ≥65 years( Reference Martínez de la Iglesia, Onís Vilches and Dueñas Herrero 30 ), which recommends using a cut-off of ≥5 points to consider the existence of probable clinical depression.
Prescription medication use
The participants were asked to present their drug history (prescribed medications by their general practitioner). Each medication name and current clinical diagnosis were noted. Anatomical Therapeutic Chemical (ATC) classification was used to categorize medications( 31 ). Polypharmacy has been defined as the concomitant use of five or more different prescription medications( Reference Gnjidic, Hilmer and Blyth 32 ).
Frailty status
The frailty status of each participant was determined according to the five criteria proposed by Fried et al.( Reference Fried, Tangen and Walston 33 ). In brief, these criteria are the following. (i) Unintentional weight loss (i.e. not due to dieting or exercise): at least 4·5 kg in the past year. (ii) Self-reported exhaustion: identified by two questions from the modified ten-item Center for Epidemiological Studies-Depression (CES-D) scale( Reference Radloff 34 ) in its Spanish version( Reference Ruiz-Grosso, Loret de Mola and Vega-Dienstmaier 35 ). (iii) Weakness: grip strength in the lowest 20 % at baseline, adjusted for sex and BMI. (iv) Slow walking speed: the slowest 20 % at baseline, based on time to walk 4·57 m (15 ft), adjusting for sex and standing height. (v) Low physical activity: the lowest 20 % at baseline, based on a weighted score of kilocalories expended per week, calculated according to the Spanish validation of the Minnesota Leisure Time Activity (MLTA) questionnaire( Reference Ruiz Comellas, Pera and Baena Díez 36 ), according to each participant’s report, and adjusting for sex. Participants with ≥3 positive criteria were defined as frail, with 1–2 positive criteria as pre-frail, and participants without positive criteria as non-frail.
Self-rated health
Self-rated health was assessed with a single question: ‘In general, would you say your health is excellent, good, fair, or poor?’( Reference Kanagae, Abe and Honda 37 ).
Statistical analysis
Characteristics of the sample were analysed where the quantitative variables were expressed as mean and standard deviation and the qualitative variables as an absolute value and percentage. The normality of the data was tested using the Kolmogorov–Smirnov test, which rejected the assumption of normality. Between-group comparisons were made using the Mann–Whitney U test. The χ 2 test was used to test categorical variables and the correlation among quantitative or ordinal variables and the MNA-SF score by the calculation of Spearman’s r. In order to determine which variables modified a dichotomous dependent variable (MNA-SF categories: well-nourished (normal score, ≥12 points) v. malnourished/at risk of malnutrition (≤11 points)), a multiple logistic regression analysis (forward stepwise likelihood ratio) was conducted using that dichotomous variable as dependent variable and all the other variables introduced in the model as covariables (sex, age categories, educational level, BMI≥25 kg/m2, co-morbidity, presence of cognitive impairment, depressive symptoms, frailty status, self-rated health). Categorical variables with more than two values were converted to dummy variables for inclusion in the multivariate models. Odds ratios and 95 % confidence intervals were calculated for each covariate included in the model. The percentage correctly predicted (with a cut-off value of 0·5 for the estimated probability) in the classification table was calculated to evaluate the fit of the final regression model. A P value of <0·05 was taken to define statistical significance. The data analysis was conducted using the statistical software package IBM SPSS Statistics Version 21·0.
The manuscript was written according to the STrengthening the Reporting of OBservational studies in Epidemiology (STROBE) statement( Reference von Elm, Altman and Egger 38 , Reference Vandenbroucke, von Elm and Altman 39 ).
Results
The mean age of the sample was 75·76 (sd 7·2) years. Significant differences (P=0·010) by sex (Table 1) were found, but no statistical differences between both groups (well-nourished (normal score, ≥12 points) v. malnourished/at risk of malnutrition (low score, ≤11 points)) in the mean age or educational level. For nutritional status, 642 participants (85·7 %) were well-nourished, 101 participants (13·5 %) were at risk of malnutrition and six (0·8 %) were malnourished. The combined prevalence for the malnourished/at risk of malnutrition group was 14·3 %.
Table 1 Characteristics according to nutritional status (MNA-SF), well-nourished (normal score, ≥12 points) v. malnourished/at risk of malnutrition (low score, ≤11 points), of community-dwelling elderly people (n 749) aged ≥65 years, Galicia, north-western Spain, October 2013–March 2014 (VERISAÚDE study)

MNA-SF, Mini-Nutritional Assessment–Short Form; CCI, Charlson Comorbidity Index; MMSE, Mini-Mental State Examination; GDS-SF, Global Deterioration Scale–Short Form.
*P<0·05, **P<0·01.
† χ 2 test.
‡ Mann–Whitney U test.
GDS-SF scores were significantly different between groups (well-nourished: 1·32 (sd 1·84); malnourished/at risk of malnutrition: 2·64 (sd 2·91); only 8·1 % of participants showed depressive symptomatology). Additionally, well-nourished individuals used a significantly lower number of prescription medications than those who were malnourished/at risk of malnutrition (4·52 (sd 3·17) v. 6·51 (sd 3·52)). Statistically significant differences were found in the different categories of the frailty phenotype (P<0·001) and self-rated health (P<0·001) between groups.
In search of the relationship between MNA-SF score and the different sociodemographic aspects and indicators of health (Table 2), a correlation between MNA-SF score and age (r=−0·088; P=0·016) and BMI (r=0·100; P=0·006) was found. Older individuals with higher BMI had lower MNA-SF scores (higher presence of malnourishment/risk of malnutrition).
Table 2 Associations between all quantitative or ordinal variables listed in Table 1 and the MNA-SF score among community-dwelling elderly people (n 749) aged ≥65 years, Galicia, north-western Spain, October 2013–March 2014 (VERISAÚDE study)
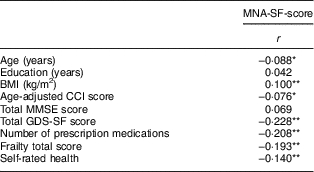
MNA-SF, Mini-Nutritional Assessment–Short Form; r, Spearman’s rho; CCI, Charlson Comorbidity Index; MMSE, Mini-Mental State Examination; GDS-SF, Global Deterioration Scale–Short Form.
*P<0·05, **P<0·01.
Significant negative correlations were also observed with age-adjusted CCI score (r=−0·076; P=0·038), GDS-SF score (r=−0·228; P<0·001), number of prescription medications (r=−0·208; P<0·001), frailty score (r=−0·193; P<0·001) and self-rated health (r=−0·140; P<0·001). Frailty or pre-frailty, presence of higher co-morbidity, depressive symptoms, use of a higher number of prescription medications and poor self-rated health presented lower MNA-SF scores (higher presence of malnourished/risk of malnutrition).
Finally, Table 3 shows the results of a logistic regression model, where five determinants significantly associated with malnutrition/risk of malnutrition are presented. For the total population, the five main determinants were BMI (≥25·0 kg/m2, presence of overweight or obesity), presence of depressive symptoms, number of prescription medications (five or more, polypharmacy), frailty level (pre-frail or frail) and poor self-rated health. The combination of having all the factors increased the risk of reporting malnutrition/risk of malnutrition, with a correct prediction of 86·0 %. Moreover, the regression model identified different determinants according to sex. The best determinants for women were also polypharmacy and poor self-rated health, reaching a correct prediction of 82·8 % of those malnourished/risk of malnutrition. In men, the main determinants of malnutrition/risk of malnutrition were overweight or obesity, presence of depressive symptoms and polypharmacy; when considered together, the correct classification of the cases reporting malnutrition/risk of malnutrition was 89·8 %.
Table 3 Logistic regression of five major determinants and malnourished/risk of malnutrition status according to the MNA-SF (≤11 points) among community-dwelling elderly people (n 749) aged ≥65 years, Galicia, north-western Spain, October 2013–March 2014 (VERISAÚDE study)

MNA-SF, Mini-Nutritional Assessment–Short Form; B, regression coefficient; NI, not included in the model.
*P<0·05, **P<0·01.
Discussion
A low prevalence of malnutrition or risk of malnutrition was observed in the present study according to MNA-SF score, but we must consider that we conducted our study in healthy elders, living at home independently and with a potentially good health status. Other studies( Reference Iizaka, Tadaka and Sanada 40 , Reference Salvà, Bolibar and Bleda 41 ) involving community-dwelling healthy elderly people have also found similar data for malnutrition (0 % and 0·5 %, respectively) and risk of malnutrition (12·6 % and 9·5 %, respectively). Research done in a rural population of India( Reference Vedantam, Subramanian and Rao 42 ) showed higher prevalences of malnutrition (14 %) and risk of malnutrition (49 %) among free-living elderly than those observed in our study. This difference may be explained by the different place of living. The present study included elderly people residing in both rural and urban areas, and a previous large study done in Iran( Reference Alibadi, Kimiagar and Ghayour-Mobarhan 43 ) showed higher malnutrition rates in rural than in urban participants.
Among the sociodemographic aspects investigated in the current study, sex was significantly related to malnourishment/risk of malnutrition in bivariate analysis, with lower MNA-SF scores being observed in women, although sex did not enter the multivariate model. Numerous studies have pointed out that female sex is associated with malnutrition and malnutrition risk( Reference Cankurtaran, Saka and Sahin 44 – Reference Boulos, Salameh and Barberger-Gateau 47 ). In our study, there was a significant although very weak negative correlation between age and MNA-SF score (older participants had poorer nutritional status) that was not reported in bivariate and regression analyses among the well-nourished as compared with those who were malnourished or at risk of malnutrition. These findings are in accordance with data reported in a Spanish cross-sectional study including 22007 elders, where lower scores were obtained in the oldest subjects( Reference Cuervo, García and Ansorena 20 ). The fact that age determines malnutrition was also found in older Chinese adults( Reference Ham, Li and Zheng 48 ), although some previous researchers did not find such a correlation or association( Reference Vedantam, Subramanian and Rao 42 , Reference Ahmadi, Mohammadi and Mostafavi 49 ). Most individuals in our study (60·2 %) had a very low educational level; however, education was not related to poor nutritional status. Contrary to our results, other authors have mentioned that lower levels of education are associated with malnutrition( Reference Kabir, Ferdous and Cederholm 46 , Reference Ham, Li and Zheng 48 , Reference Donini, Scardella and Piombo 50 , Reference Timpini, Facchi and Cossi 51 ). These data are considering an association between poverty, low levels of education and malnutrition; in fact, lower levels of education are very frequent in low-income people, with greater difficulties in covering nutritional needs.
After the comprehensive gerontological assessment and the multivariate regression model analysis carried out in the present study, associated factors for malnutrition or the risk of malnutrition were a low BMI, depressive symptoms, polypharmacy, presence of pre-frailty or frailty status and poor self-rated health. Other authors( Reference Boulos, Salameh and Barberger-Gateau 9 ) who investigated the relationship between socio-economic indicators as well as physical and mental health characteristics and nutritional status found that community-dwelling elderly people suffering from poor financial condition, those with multiple chronic diseases, those reporting chronic pain or presenting mental disorders were at high risk of malnutrition. Unfortunately, no information about the combined effect of all these factors to predict the likelihood of malnutrition/risk of malnutrition was provided.
The association of health factors and poor nutritional status found in our study is in concordance with other researchers. BMI correlated positively with MNA-SF score (as expected; since BMI is also a part of the MNA-SF it is not advisable to use it as the only parameter to detect malnutrition( Reference Rodríguez-Tadeo, Wall-Medrano and Gaytan-Vidaña 10 )) but bivariate and logistic regression analyses showed that malnourishment/risk of malnutrition was not associated with BMI. Low MNA score was associated with low BMI and increased weight loss( Reference Cuervo, García and Ansorena 20 , Reference Saka, Kaya and Ozturk 23 ).
Age-adjusted CCI scores correlated negatively with MNA-SF scores but bivariate and logistic regression analyses showed that malnutrition was not associated with co-morbidity, as described earlier( Reference Malara, Sgrò and Caruso 52 ); thus, nutritional status is closely related to the accumulation of geriatric conditions, at least in dependant elderly people without acute illness( Reference Hirose, Hasegawa and Izawa 53 ). On the other hand, the number of chronic medical conditions has been found to be one of the best predictors of nutritional status( Reference Ham, Li and Zheng 48 ). Among these geriatric conditions, dementia is itself a risk factor for malnutrition( Reference Malara, Sgrò and Caruso 52 ). In the present study, however, no association was found between MMSE score and malnutrition or risk of malnutrition. It could be that most of the people attending senior centres are healthy elders without cognitive impairment (only 6·5 % of the participants were found to have cognitive impairment). Nevertheless, the majority of studies have shown that patients affected by cognitive impairment (lower MMSE scores) are characterized by a poor nutritional status( Reference El Zoghbi, Boulos and Amal 54 – Reference Roque, Salvà and Vellas 57 ). Generally, these studies involved elderly patients with dementia and/or were carried out in an institutionalized setting.
Further, in the ageing population, depression is a frequent syndrome that has shown association with nutritional status in several settings( Reference Ahmadi, Mohammadi and Mostafavi 49 , Reference Feldblum, German and Castel 58 – Reference Johansson, Bachrach-Lindström and Carstensen 63 ). The current study found the same significant association. Various researchers have demonstrated a positive association between depression and loss of appetite or weight loss; therefore, poor nutritional status could be a factor contributing to depression and apathy in elders( Reference Ahmadi, Mohammadi and Mostafavi 49 , Reference Feldblum, German and Castel 58 – Reference Johansson, Bachrach-Lindström and Carstensen 63 ). Nevertheless, new research is needed to determine whether malnourishment or risk of malnutrition is regarded as a consequence of depressive symptomatology or, inversely, if malnourished people have a greater risk of being depressed.
Polypharmacy (five or more prescription medications) was also identified as a marker of poor nutritional status in our study. Other findings indicate that polypharmacy is strongly associated with low MNA scores and a higher number of prescription medications determines the decline in MNA scores( Reference Jyrkkä, Mursu and Enlund 13 , Reference Schilp, Wijnhoven and Deeg 16 , Reference Jyrkkä, Enlund and Lavikainen 64 , Reference Zadak, Hyspler and Ticha 65 ). The effects of polypharmacy on nutritional status are estimated from the fact that problems with nutrition occur mainly in elderly patients, who are also more frequently subject to polypharmacy. However, it is unclear if a worsened nutritional status may influence the process of a pharmacological treatment or, inversely, if polypharmacy may influence a limited food intake that would increase malnutrition( Reference Zadak, Hyspler and Ticha 65 ).
Frailty was also found more often in our study participants who were malnourished or at risk of malnutrition. Frailty is a geriatric condition determined by Fried et al.’s five criteria that assess, among other factors, unintentional weight loss and weakness adjusted by BMI, items that are already implying an existing close association with malnutrition. Our result may be compared with a previous Spanish study which found a significant association between the five frailty criteria and the categories of MNA, and that the largest proportion of frail subjects were at risk of malnutrition( Reference Jürschik, Botigué and Nuin 15 ). Additionally, 90 % of malnourished elderly patients were either pre-frail or frail, and about 36 % or 57 % of the frail people were malnourished or at risk of malnutrition( Reference Dorner, Luger and Tschinderle 14 , Reference Bollwein, Volkert and Diekmann 66 ). These authors also found that the prevalence of malnutrition was six times higher in frail older adults compared with robust individuals.
Lastly, self-perceived health provides a measurement for monitoring the health status of the elderly and its effect on their quality of life and well-being. In our representative sample, only 2·8 % perceived poor health. This can be compared with other studies which found that being at nutritional risk had a negative impact on older people’s perceived health( Reference Margetts, Thompson and Elia 2 , Reference Johansson, Bachrach-Lindström and Carstensen 63 , Reference Söderhamn, Flateland and Jessen 67 ). Lower risk of undernutrition using MNA-SF scores could predict perceived good health( Reference Söderhamn, Flateland and Jessen 67 ).
Strengths and limitations
An important strength of the present study is the multiple assessment set of potential determinants (both sociodemographic and health ones) that are included in the analysis to examine their association with the presence of malnourishment or risk of malnutrition in a large representative sample. However, there are several limitations to be mentioned such as the selection of our sample study from senior centres and the inclusion of healthy elders that could reduce the prevalence rates of malnutrition or risk of malnutrition.
Likewise, several studies( Reference Serra-Prat, Palomera and Gomez 68 , Reference Takeuchi, Aida and Ito 69 ) have reported higher prevalence rates for malnutrition in the presence of dysphagia. Although dysphagia is a geriatric syndrome and a predictor of malnutrition, it was not considered in our gerontological assessment. Besides, cross-sectional designs do not allow establishing causality, so that future longitudinal data are needed.
Conclusions
The present research provides insight into the factors that could be associated with the presence of malnutrition or risk of malnutrition. We conclude that sex was the only sociodemographic factor associated with nutritional status in our community-dwelling older people. Health factors that demonstrated association were depressive symptomatology, polypharmacy, frailty and poor self-rated health. Our study revealed, in a multivariate analysis, that low BMI, depressive symptoms, polypharmacy (five or more prescription medications), presence of pre-frailty or frailty status and poor self-rated health remained as determinants of malnourishment and risk of malnutrition. Screening for nutritional status and these determinant factors should be included as part of comprehensive assessments to ensure an early screening of malnutrition and to propose possible intervention strategies that would be important for both elderly people and the health-care system.
Acknowledgements
Acknowledgements: The authors sincerely thank the staff and elderly users of the forty-three senior centres who contributed to this study. Financial support: This work was supported by the Xunta de Galicia project EM 2012/100: ‘VERISAÚDE project: Effectiveness of the Comprehensive Gerontological Assessment and longitudinal follow-up in the healthy ageing promotion’. Xunta de Galicia had no role in the design, analysis or writing of this article. Conflict of interest: None. Authorship: A.M., S.G.-C. and J.C.M.-C. contributed with the conception and design of the study along with the critical revision of the manuscript before the final submission. S.G.-C., L.L.-L., R.L.-L., V.S-.M. and C.D.-D. contributed with the acquisition of data. A.M. contributed with the analysis and interpretation of data along with the drafting of the manuscript. All the authors revised the final version of the manuscript and approved it to be submitted. Ethics of human subject participation: This study was conducted according to the guidelines laid down in the Declaration of Helsinki and all procedure involving human subjects/patients were approved by the Ethics Committee of the University of A Coruña. Written informed consent was obtained for all subjects.


