


Food insecurity is a socio-economic inability to purchase uncontaminated, nutritionally healthy food in sufficient amounts( Reference Vijayaraghavan, Jacobs and Seligman 1 ). Worldwide, 10·9 % of the population lacks food security( 2 ). In 2014–2016, 5·5, 12·1 and 20·0 % of individuals residing in Latin America, Asia and Africa were food insecure, respectively( 2 ). In Europe, a recent report indicated that food insecurity was 0·7 % in the Commonwealth of Independent States, 1·7 % in the European Union and 5·2 % in South-East Europe( 3 ). In North America, the current rate of food insecurity varies considerably according to region. In Canada, it is as low as 10 % in British Columbia or high as 51 % in Nunavut( 4 ). In the USA, the rate of food insecurity has varied slightly in the past decade: ~12 % in 2001, ~17 % in 2009( Reference Gundersen, Kreider and Pepper 5 ) and 13·4 % in 2015( Reference Coleman-Jensen, Rabbitt and Gregory 6 ). These data suggest that food insecurity is a global nutritional issue that affects both developed and developing countries.
Food insecurity exists in all ethnic and age groups. In the USA, a national survey by Coleman-Jensen et al. reported that food insecurity was more prevalent among African Americans (21·6 %) and Hispanics (20·5 %) than Caucasians (10·2 %) and Asians (10·4 %)( Reference Coleman-Jensen, Rabbitt and Gregory 6 ). Food insecurity also has been found in all ages, including children and the elderly( Reference Metallinos-Katsaras, Must and Gorman 7 ). A cross-sectional study in the Southwest USA investigated food insecurity in fifty Mexican mother–child dyads who resided in homes in colonies on the Texas border. A lack of food security was observed in the majority of the mothers (80 %) and two-thirds of the children( Reference Nalty, Sharkey and Dean 8 ). Clearly, solutions to minimize the incidence of this societal issue in the USA are warranted.
The US Government has launched a variety of emergency programmes that have been successful in providing food to the low-income population. These include the Supplemental Nutrition Assistance Program (SNAP; formerly Food Stamps), the Special Supplemental Nutrition Program for Women, Infants, and Children, Meals on Wheels and the School Breakfast/Lunch Program( 9 ). SNAP has been particularly effective. For example, Mabli and Worthington reported that food insecurity diminished by 12·5 % in 3000 families who were enrolled in SNAP for 6 months( Reference Mabli and Worthington 10 ). Yet not everyone can enrol in SNAP, such as those with a criminal record or without citizenship. Thus, another alternative to reduce food insecurity in the low-income population is to provide food donations, wherein surplus food is collected from retail stores and vendors and redistributed to those in need. Numerous organizations are involved in food redistribution at the global level. Examples are: Banco de Alimentos de Buenos Aires in Argentina( 11 ), Food Angel Program in Hong Kong( 12 ), Food from the Heart in Singapore( 13 ), Leket Food Bank of Israel( 14 ), Wa’hab in Qatar( 15 ), Food Bank Namibia( 16 ), Trussell Trust in England( 17 ), Instock in the Netherlands( 18 ), CulinARy MiSfiTS in Germany( Reference Bendix 19 ), Zero Desperdicio in Portugal( Reference Bendix 19 ), SecondBite in Australia( 20 ) and Second Harvest in Canada( 21 ).
In the USA, examples of charitable agencies that annually reallocate large quantities of food include Feeding America (~181 million tons)( 22 ), Donate Don’t Dump (~295 tons)( 23 ) and, at the state level, Capital Area Food Bank of Texas (20 711 tons)( 24 , 25 ). Other effective organizations are found in Florida( Reference Will and Milligan 26 ), New Jersey( Reference Kempson, Keenan and Sadani 27 ), Washington( Reference Hoisington, Shultz and Butkus 28 ), Alabama( Reference Duffy, Hallmark and Molnar 29 ), North Carolina( Reference Ahluwalia, Dodds and Baligh 30 ) and New York( Reference Bowering, Clancy and Poppendieck 31 , Reference Clancy, Bowering and Poppendieck 32 ). Collectively, these non-government programmes are critical for reducing food insecurity in the USA.
Various factors are associated with lack of food security; these include low socio-economic status( Reference Morrissey, Jacknowitz and Vinopal 33 ), lack of employment( Reference Nichols-Casebolt and Morris 34 ) and high prices of healthy foods such as fruits and vegetables( Reference Shanks, Ahmed and Smith 35 , 36 ). A cross-sectional study of forty-one caregivers for children reported that 46 % were food insecure, even though 34 % received food assistance. The households that lacked food security consumed foods of low nutritional value such as convenience and fast foods. The risk of food insecurity increased by onefold in families who had insufficient resources and limited food preparation supplies to buy and cook the food (P<0·05)( Reference Nackers and Appelhans 37 ).
To date, the role that food donations from pantries and soup kitchens play in improving the food security of their clients has not been explored fully. Thus, the objective of the present study was to discern the impact of food donations on food security.
Materials and methods
Design
A total of 317 individuals (aged ≥18 years) who receive free food benefits were recruited from a food pantry and soup kitchen in Central Texas, USA, to participate in a cross-sectional study. A demographic questionnaire, nutrition knowledge scale, Core Food Security Module (CFSM), FFQ and a list of food donations were administered to the participants. The CFSM measured the degree of food security in participants over the past 30 d. The FFQ estimated energy and dietary intake of the total diet for the previous month. The list of food donations concerned characteristics of the food benefits (type, amount and frequency). Diet quality was estimated for the base diet and total diet (base diet plus food donations) via the Healthy Eating Index-2010 (HEI-2010). Serving sizes of food groups were determined using MyPlate. Reported descriptions of the food donations were validated by taking photographs via use of a smart phone.
Participants
A total of 317 food recipients were recruited and 222 adults agreed to participate. Of these, 112 were from a food pantry that offered free foods and 110 from a soup kitchen that provided a free meal. None of the participants used both food services; thus, the clients of the food pantries and soup kitchen did not overlap. The nature of the research was explained and a signed consent form was obtained. Participants completed the questionnaires and received a compensation of $US 10.
Tools of assessment
The demographic questionnaire is a self-reported instrument developed and tested by the authors( Reference Klohe-Lehman, Freeland-Graves and Anderson 38 ). It consists of twenty-five items regarding information about age, sex, ethnicity, weight, height, educational level, marital status, occupation and socio-economic status.
The nutrition knowledge scale was developed and validated by the authors to evaluate knowledge regarding weight loss, healthy food intake, fast foods, dietary guidelines and macro- and micronutrients( Reference Tabbakh and Freeland-Graves 39 ). This scale consists of twenty multiple-choice and true/false questions and its score ranges from 0 to 20, with a higher score indicating a better level of nutrition knowledge (Cronbach’s α=0·7)( Reference Klohe-Lehman, Freeland-Graves and Anderson 38 , Reference Tabbakh and Freeland-Graves 39 ).
The CFSM is a questionnaire established and validated by the US Department of Agriculture to evaluate the status of household food security. It consists of eighteen questions about the availability of food at home and money to purchase food( Reference Bickel, Nord and Price 40 ). The overall score of this instrument ranges between 0 and 10 for households without children, and from 0 to 18 for those with children( Reference Bickel, Nord and Price 40 ). A higher score reflects lower food security status( Reference Bickel, Nord and Price 40 ). Total household score was compared with a scaled value that reflected the level of food security (0–3). A value of 0 designates lack of food insecurity; scales of 1, 2 and 3 indicate food insecurity without hunger, food insecurity with moderate hunger and food insecurity with severe hunger, respectively( Reference Bickel, Nord and Price 40 ).
The FFQ is a 195-item tool developed and tested by the authors in low-income, tri-ethnic women (Cronbach’s α=0·69)( Reference George, Milani and Hanss-Nuss 41 ). This tool assesses the frequency and portions of food intake over the past 30 d. The consumption frequency ranges from ‘never or <1 per month’ to ‘2+ times per day’. The size of servings consumed ranges between ‘small’ and ‘extra large’.
The list of food donations requires food recipients to describe the type (packaged, canned and/or fresh) and quantity and/or portion size of the donated food/meal, and the frequency of attending the food pantry or soup kitchen. Validity of the food donations received was evaluated by comparing the collected data with photographs of the foods.
Dietary intake of food was tabulated for total (daily base diet plus food donations) and base diets (diet prior to donations) and food donations received by clients. Nutrients and energy were estimated by the software FoodWorks 8 Professional( 42 ) which is based on the US Department of Agriculture database.
Choose MyPlate is a tool developed to guide individuals to live a healthy lifestyle based on one’s age, sex, height, weight and physical activity. This tool was used to measure portion size equivalents for each food group based on daily recommended intakes( 43 ). Furthermore, the 2015–2020 Dietary Guidelines for Americans( 44 ) were used to estimate the number of servings of vegetables, fruits, refined and whole grains, dairy products, beans and meat, and empty calories. Choose MyPlate was utilized to quantify the serving size of each food group eaten by each client on a daily basis. Then the amount consumed was compared with the 2015–2020 US dietary guidelines( 44 ) to assess the nutritional status of the participants.
The Healthy Eating Index-2010 (HEI-2000) was used to estimate diet quality for the base and total daily food consumption of the clients( Reference Guenther, Casavale and Reedy 45 ). This index evaluates adequate and moderate intake of foods and nutrients based on their compliance with the US dietary guidelines( 44 ). This scale has a range of 0 to 100 points; a higher score indicates greater adherence to the guidelines. The HEI-2010 is composed of twelve groups: nine categories that measure adequacy (total fruit; whole fruit; total vegetables; greens and beans; whole grains; dairy; total protein foods; seafood and plant proteins; fatty acids) and three groups that estimate moderation (refined grains; sodium; empty calories) (Cronbach’s α=0·68)( Reference Guenther, Kirkpatrick and Reedy 46 ).
Statistical analyses
All analyses were conducted via the statistical software package IBM SPSS Statistics for Windows version 19·0 (Graduate Pack, 2010). Descriptive statistics were performed and are presented as means with their se and frequency distributions. Differences in independent variables (age, sex, ethnicity, marital status, education, occupation, housing, annual income, BMI, language, health status, smoking, drinking alcohol, nutrition knowledge, client type, diet quality of base and total diets) between food-secure and food-insecure participants were assessed using ANOVA. The Bonferoni post hoc test was used to compare two or more independent samples of equal or different sample sizes. Regression models were used to establish associations between food security and demographics, food groups, and diet quality of both base and total diets. Data were reported as OR with 95 % CI. Data were considered significant at P<0·05.
Results
Approximately 73 % of clients in our sample demonstrated a lack of food security. Characteristics of the participants according to food security status are presented in Table 1. Mean age of the food-secure and food-insecure clients did not differ significantly (47 v. 49 years). Food-insecure clients had lived a shorter duration in the USA and were overweight, compared with the food secure. Food-secure clients had higher annual income and diet quality than did the food insecure (P<0·02).
Table 1 Participant characteristics, according to food security status, of adult clients (n 222) from a food pantry and soup kitchen in Central Texas, USA, in September and October 2015
a,bMean values within a row with unlike superscript letters were significantly different (P≤0·05).
* Core Food security Module (CFSM) score ranges between 0 and 10 for a household without children, and from 0 to 18 for a home with children. A higher score reflects greater food insecurity( Reference Kempson, Keenan and Sadani 27 ).
† Total Healthy Eating Index-2010 (HEI-2010) score range is 0–100. A higher score reflects greater diet quality( Reference Clancy, Bowering and Poppendieck 32 ).
Table 2 indicates the OR of food groups and diet quality (HEI-2010 scores) for food-secure and food-insecure clients. The status of food security was improved if the clients consumed a daily diet (base diet) that contained large amounts of total vegetables, grains, dairy or protein foods (P<0·05). Moreover, the probability of food insecurity was reduced by ≥1·17-fold when the total dietary intake included the food donations, which were rich in fruits, total vegetables and grains, dairy and protein foods (P<0·05). Thus, consumption of food donations had a greater effect on improving food security status of the clients, particularly due to the intake of fruits, vegetables and protein foods, than when eating the base diet (without the donations) as reflected by the OR values (P<0·05).
Table 2 Effect of food groups and diet quality, as reflected by HEI-2010 scoresFootnote *, on food-secure and food-insecureFootnote † adult clients (n 222) from a food pantry and soup kitchen in Central Texas, USA, in September and October 2015Footnote ‡
The OR increases multiplicatively by exp(β) for every unit increase in the predictor. The reference group is food secure (OR=1).
* Total Healthy Eating Index-2010 (HEI-2010) score range is 0–100. A higher score reflects greater diet quality( Reference Clancy, Bowering and Poppendieck 32 ).
† Food security evaluated with the Core Food Security Module (CFSM). CFSM score ranges between 0 and 10 for a household without children, and from 0 to 18 for a home with children. A lower score represents greater food security( Reference Kempson, Keenan and Sadani 27 ).
‡ Statistical significance is at P<0·05.
§ OR measures the association between CFSM total score and the predictors (food groups and HEI-2010 scores of the base and total diets), where food secure is the reference. A positive OR indicates greater CFSM score, and thus lower food security. A negative OR reflects lower CFSM score, and thus better food security.
║ Controlling for all food groups.
¶ Controlling for all HEI-2010 groups.
** Fatty acids=(PUFA+MUFA)/SFA.
Table 2 also shows that the risk of food insecurity was decreased after eating a base diet of high nutritional quality, specifically containing large proportions of total vegetables, whole grains, dairy or protein foods; but with lesser amounts of sodium (P<0·05). When the total diet (that included the food donations) was of high nutritional quality, the likelihood of food insecurity was minimized due to consuming total vegetables, whole and refined grains, and dairy products abundantly, as well as eating fatty acids sparingly (P<0·05). Thus, the improved diet quality of the total diet (after the addition of the food donations) had a positive influence on food security of the participants (P<0·05).
Both groups encountered barriers that prevented their enrolment in government food assistance programmes. These programmes were well known, as only 2 % of the participants lacked knowledge about programmes such as SNAP. Yet 98 % had been denied approval for enrolment due to being convicted of a crime or not being a citizen (eligibility criteria). Furthermore, 17 % of the total population sample was marginally food secure and only 10 % were fully secure (P<0·001). About 40 and 43 % of food pantry and soup kitchen users, respectively, had enough to eat, but it was not always the type of food that they wanted to consume (P=0·04). Participants attributed lack of food to a shortage in resources; inability to commute to a store that contained good-quality foods or the type needed; absence of a kitchen and/or defective cooking/storage facilities (a stove/refrigerator); or experiencing a health issue. Moreover, the majority (88·1 %) of soup kitchen clients had low or very low food security status, compared with 58·1 % of the food pantry recipients (P<0·001).
Of the food-insecure clients, 61 % were men; 42 % Caucasians; 56 % single; 15 % divorced, 11 % widowed; and 67 % were homeless. Also, 64 % had annual income <$US 1000, 29 % were eligible to receive Supplemental Security monthly income (SSI) and 60 % went to a soup kitchen (P<0·01). In contrast, two-thirds of the food secure were women and had an annual income >$US 1000. Only 10 % were eligible to receive SSI benefits (P<0·01). Of the food secure, 22 % were Blacks and 47 % were Hispanics; 42 % were married; 78 % lived in a residence; and 42 % received free food donations from the food pantry (P<0·01). More than 80 % of the food-secure and food-insecure clients were unemployed.
According to mean CFSM scores, food insecurity was significantly higher among clients who had a health condition (7·9 (sd 0·3)) and smoked cigarettes (8·0 (sd 0·3)) than among those who were healthy (6·1 (sd 0·4)) or did not smoke (6·8 (sd 0·3); P<0·05). In addition, English speakers (7·7 (sd 0·2)) and participants who had low nutrition knowledge (7·9 (sd 0·3)) and utilized a soup kitchen (7·9 (sd 0·2)) exhibited lower food security status than did individuals who spoke Spanish (5·8 (sd 0·7)), had good nutrition knowledge (6·9 (sd 0·3)) or attended a food pantry (6·8 (sd 0·4); P<0·05; Fig. 1). Furthermore, Table 3 shows the effect of demographic and socio-economic characteristics on food security status of clients. The sample who was food insecure was primarily women, had a larger family and/or children and low income, was below the poverty threshold or not eligible to receive SSI benefits (P<0·01). The probability of becoming food insecure increased if the clients smoked, had a health condition or drank alcohol (P<0·05).
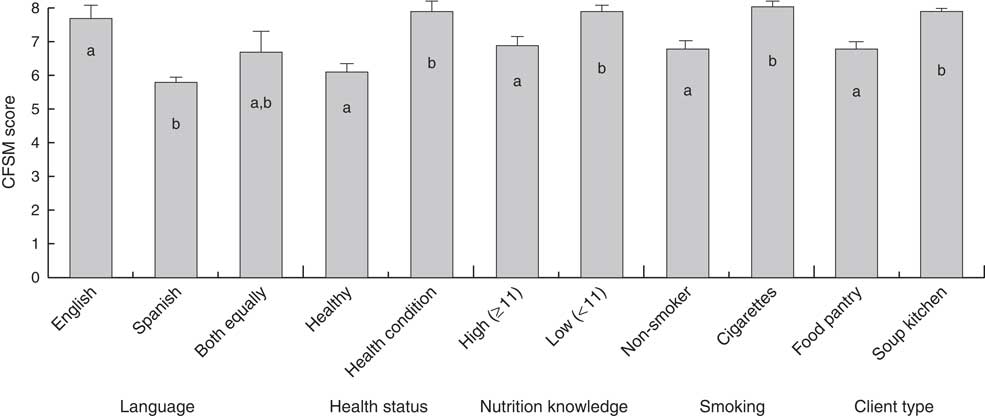
Fig. 1 Food security, evaluated as mean Core Food Security Module (CFSM) scores* with their standard errors represented by vertical bars, according to language, health status, nutrition knowledge, smoking and client type, of adult clients (n 222) from a food pantry and soup kitchen in Central Texas, USA, in September and October 2015. a,bMean values within a category with unlike superscript letters were significantly different (P≤0·05). *CFSM score ranges between 0 and 10 for a household without children, and from 0 to 18 for a home with children. A higher score reflects greater food insecurity( Reference Kempson, Keenan and Sadani 27 )
Table 3 Effect of demographic and socio-economic characteristics on food security statusFootnote * of adult clients (n 222) from a food pantry and soup kitchen in Central Texas, USA, in September and October 2015Footnote †
The OR increases multiplicatively by exp(β) for every unit increase in the predictor. Reference group is food secure (OR=1).
* Food security evaluated with the Core Food Security Module (CFSM). CFSM score ranges between 0 and 10 for a household without children, and from 0 to 18 for a home with children. A lower score represents greater food security( Reference Kempson, Keenan and Sadani 27 ).
† Statistical significance is at P<0·05.
‡ OR measures the association between CFSM total score and the predictors (demographic and socio-economic characteristics), with food secure as the reference. A positive OR indicates greater CFSM score, and thus lower food security.
§ Controlling for all demographic and socio-economic characteristics.
║ Smoking and health status were included in the model.
Discussion
These results suggest that the level of food insecurity of the present sample (73 %) is higher than that reported for Texas by the Economic Research Service (14·3 %)( Reference Coleman-Jensen, Rabbitt and Gregory 47 ) or by the study in West Texas by Murimi et al. (63 %)( Reference Murimi, Kanyi and Mupfudze 48 ). Furthermore, numerous studies in other regions in the USA have reported the incidence of food insecurity to be lower than our findings. These included 7·8 % of 230 elderly in Alabama( Reference Locher, Ritchie and Robinson 49 ), 30 % of 435 adults in Massachusetts( Reference Webb, Schiff and Currivan 50 ), 42·7 % of 16 651 poor households in Boston( Reference Kushel, Gupta and Gee 51 ) and 55·9 % of 220 low-income and homeless families in Washington, DC( Reference Gundersen, Weinreb and Wehler 52 ). One might think that it could be related to the large border of Texas with Mexico, but even higher levels have been observed in Rhode Island in which 94 % of 252 homeless men and women had low levels of food security in 2015. Of these, 55 % used SNAP benefits, shelters, food pantries and/or soup kitchens for sources of food( Reference Martins, Gorman and Miller 53 ).
Additionally, figures similar to our findings have been reported in Connecticut in which 76 % of 200 Hispanic immigrants were food insecure. Of these, 37 % used food pantries and/or soup kitchens( Reference Dhokarh, Himmelgreen and Peng 54 ). Lower levels of food insecurity prevalence have been observed in Canada, with a prevalence of 4 % in 81 581 households( Reference Vozoris and Tarasuk 55 ), increasing to 16·9 % in seventy-seven Columbian immigrants( Reference Rush, Irwin and Stitt 56 ). In contrast, other surveys in Canadians have indicated even higher rate of low food security. For instance, 70 % of 120 000 users of food assistance programmes aged ≥12 years( Reference Tarasuk, Dachner and Loopstra 57 ) and 75 % of 317 low-income houses( Reference Loopstra and Tarasuk 58 ) were reported to be food insecure in 2014 and 2012, respectively.
The current research found that consumption of food donations improved the food security status of the clients; this is due primarily to the greater intake of fruits, vegetables and protein foods (P<0·05). A study conducted by Miewald et al. supports our results, in which food-secure individuals participating in the Food Box programme (distributes fruits and vegetables) in Ohio had greater intakes of fruits and vegetables than food-insecure individuals (5·0 v. 3·6 servings, P<0·001)( Reference Miewald, Holben and Hall 59 ). In addition, Robaina and Martin documented that the food secure who obtained food benefits from government and non-government agencies were more likely to consume fruits and vegetables by twofold, compared with the insecure( Reference Robaina and Martin 60 ). Others have found that the availability of fruits and vegetables in food pantries increased their clients’ intake by one serving per day( Reference Martin, Wu and Wolff 61 , Reference Keller-Olaman, Edwards and Elliott 62 ). These outcomes are supported by the present results, in which inclusion of vegetables in the food donation improved diet quality by 1·6-fold (P=0·001).
Our findings also indicate that food-secure clients consumed a diet with a higher nutrition quality than did the food insecure. Food security was increased by receiving food donations and this extra food improved the quality of their total diet. Comparable outcomes were reported by the 2003–2010 National Health and Nutrition Examination Survey (NHANES)( Reference Nguyen, Shuval and Bertmann 63 ) in which diet quality was higher in the 4645 food-secure than the 3688 food-insecure adults receiving SNAP benefits (HEI-2010 score 47 v. 44, P=0·001). Yet their HEI-2010 score was lower for both food-secure and food-insecure adults when compared with our sample (67 v. 63, P<0·001)( Reference Nguyen, Shuval and Bertmann 63 ). Huet et al. ( Reference Huet, Rosol and Egeland 64 ) found similar findings in a study that assessed food security and nutrition quality of 1901 Inuit families in Canada. Two-thirds of the participants lacked food security, and they had lower diet quality than the food secure (52·6 v. 55·3, P<0·001).
Moreover, a stratified sample from the Delta Nutrition Intervention Research Initiative explored dietary patterns and food security in 1607 American households( Reference Champagne, Casey and Connell 65 ). The mean HEI was higher among food-secure than food-insecure men and women (60·6 v. 57·4, P<0·001). Compared with the food secure, food-insecure participants had lower mean scores for dairy foods (4·2 v. 3·2), vegetables (5·6 v. 4·4), cholesterol (7·4 v. 6·8) and lack of sodium intake (7·1 v. 6·3; P<0·05)( Reference Champagne, Casey and Connell 65 ). Results of Champagne et al. ( Reference Champagne, Casey and Connell 65 ) and other studies support our conclusion( Reference Rush, Irwin and Stitt 56 , Reference Nnakwe 66 – Reference McIntyre, Glanville and Raine 68 ) that food security is improved when consuming a diet of high nutritional quality that is rich in fruits, vegetables, whole grains, dairy and protein foods, and low in fats and sodium.
Possible reasons for food insecurity in our participants were lack of resources and good-quality and/or preferred foods in the grocery store, and inadequate storage and/or cooking facilities (such as living in a shelter or being homeless). Moreover, individuals without homes may not use food pantries since they lack storage/cooking locations and may depend solely on attending soup kitchens to obtain food. In a survey that assessed characteristics of twenty-two food-insecure users of a soup kitchen aged 28–80 years, one-quarter did not have a kitchen and/or a storage facility such as a refrigerator. Those authors suggested that the inability to store or cook food contributed to the negative eating behaviours observed (consumption of fast and convenience foods)( Reference Wicks, Trevena and Quine 69 ). In addition, Nord( Reference Nord 70 ) observed that 4 % of food-insecure 13 078 elderly and 59 203 adult persons lacked availability of food at home. The absence of food was attributed to inability to cook, shop or go to the grocery store; lack of having a working stove; and being sick or on a special diet( Reference Nord 70 ). Results of Wicks et al.( Reference Wicks, Trevena and Quine 69 ) and Nord( Reference Nord 70 ) support our findings that lack of housing, storage and/or cooking facilities were factors that increased food insecurity and reduced the ability to prepare a homemade meal.
The majority of our clients did not lack knowledge about the availability of public food assistance programmes such as SNAP but could not enrol in them due to conviction of a crime or lack of citizenship (eligibility criteria). In 2015, Iglesias-Rios et al. reported that Hispanics who did not hold citizenship were 1·3 times more likely to become food insecure than those with citizenship (P<0·05), primarily due to their inability to obtain benefits from charitable networks( Reference Iglesias-Rios, Bromberg and Moser 71 ). Some organizations also require food recipients to acquire identification cards and proof of income or residence at the time of donation( Reference Gany, Bari and Crist 72 ). Other barriers to utilizing food assistance programmes may be inconvenient times of donation and long lines to obtain the food( Reference Loopstra and Tarasuk 58 ). Solving these logistical issues might increase the probability of improving food insecurity in the poverty stricken.
The present study found that the food-insecure clients had very low incomes (P<0·05). This finding is in agreement with that of Kushel et al., who reported that an annual income lower than 100 % of the poverty level was found among 27·2 % of 7659 households who were food insecure( Reference Kushel, Gupta and Gee 51 ). Our data indicate that food security was increased by two-, three- and fourfold by being low-income, below the poverty level ($US 11 880/year) and/or ineligible to obtain SSI benefits, respectively (P<0·01). Hernandez observed that living below 200 % of the federal poverty threshold increased probability of food insecurity by onefold (P<0·05)( Reference Hernandez 73 ). In addition, Vozoris and Tarasuk found that individuals who lacked financial resources and/or did not own a house were at higher risk for becoming food insecure by about one- and twofold, respectively (P<0·05)( Reference Vozoris and Tarasuk 55 ). Other investigations( Reference Huet, Rosol and Egeland 64 , Reference Wicks, Trevena and Quine 69 , Reference Lee, Johnson and Brown 74 – Reference Reschovsky 79 ) have published similar findings that limited resources are a major contributor to food insecurity in the low-income population.
In the current research, women had increased risk for food insecurity by threefold more than men (P<0·001). Also, the level of food security was lower in Caucasians and divorced, widowed or single clients than in Hispanic or married participants. A national survey supports the present findings in which lack of food security was higher in women than men (10·4 v. 9·9 %), as well as in those who were single (12·9 %) and divorced or separated (21·3 %) compared with those married (6·5 %; P<0·05)( Reference Che and Chen 80 ). Similar results were observed in low-income, tri-ethnic Americans( Reference Kushel, Gupta and Gee 51 ), American immigrants from Mexico( Reference Nalty, Sharkey and Dean 8 ) and Puerto Rico( Reference Dhokarh, Himmelgreen and Peng 54 ), and Canadians who had migrated from Columbia( Reference Rush, Irwin and Stitt 56 ).
In our study, the presence of two or more family members and/or children in the household increased the probability of food insecurity by 1·4- and 1·5-fold, respectively (P<0·001). A cross-sectional study( Reference Nalty, Sharkey and Dean 8 ) in 2013 showed that 80 % of fifty Hispanic mothers who had an average of three children were food insecure. McIntyre et al. ( Reference McIntyre, Glanville and Raine 68 ) also reported that 58·3 % of 141 low-income mothers in Canada lacked food security; however their children were considered food secure. It is believed that the mothers saved the food for the children at the expense of themselves( Reference McIntyre, Glanville and Raine 68 ). These reports agree with our research that the presence of adults and other members in the household reduces food security.
In the present investigation, clients who smoked, drank alcohol and had a health problem were more likely to have low food security status than did non-smokers, non-drinkers and healthy individuals by three-, four- and twofold, respectively (P<0·05). The 1999–2008 NHANES( Reference Iglesias-Rios, Bromberg and Moser 71 ) reported that 61 % of 6681 Latinos lived below 185 % of the poverty line, 36·7 % lacked food security and 22 % smoked cigarettes. About 26 % of the food insecure were smokers( Reference Iglesias-Rios, Bromberg and Moser 71 ). Dixon et al. ( Reference Dixon, Winkleby and Radimer 81 ) also observed that 40·0 and 37·9 % of 599 food-insecure men and women smoked cigarettes and drank alcohol, respectively. Furthermore, the 1999–2004 NHANES( Reference Seligman, Laraia and Kushel 82 ) showed that 22·4 and 21·7 % of 5094 low-income men and women had hypertension and hyperlipidaemia, respectively. These health problems significantly increased the risk of food insecurity by onefold (P<0·05)( Reference Seligman, Laraia and Kushel 82 ). Mojtabai( Reference Mojtabai 83 ), Rosenblum et al. ( Reference Rosenblum, Magura and Kayman 84 ) and Starkey et al. ( Reference Rosenblum, Magura and Kayman 85 ) observed comparable results. Thus, drinking alcohol, smoking and having a health problem appear to be prevalent in the food insecure.
The current research determined that food-insecure clients had lower nutrition knowledge level than did those with food security (P<0·05). In 2012, Wang and Chen reported that men and women who had greater nutrition knowledge purchased healthier foods, and were more likely to meet the dietary recommendations for fruits, vegetables and whole grains, than those who had low levels( Reference Wang and Chen 86 ). The lack of nutrition knowledge in low-income individuals may negatively affect their eating behaviours( Reference Appelhans, Waring and Schneider 87 ), leading to an increase in food insecurity.
The current study observed that the clients who spoke English had better food security status than did those who spoke Spanish only. As Hispanics become more acculturated, they may transition to eating more Westernized diets that are rich in fast and processed foods. In contrast, Dhokarh et al. observed that low food security was more prevalent among low-income Puerto-Rican immigrant women who spoke both English and Spanish than in Spanish-only speakers (68 v. 32 %, P<0·05)( Reference Dhokarh, Himmelgreen and Peng 54 ). Nevertheless, findings of Iglesias-Rios et al. ( Reference Iglesias-Rios, Bromberg and Moser 71 ) provide support to our results in which Hispanic adults, who were fluent primarily in Spanish, were more likely to become food insecure by odds of 1·24 compared with those who conversed in English. These authors proposed that a language barrier might reduce the opportunity of obtaining an occupation and accessing government food assistance programmes such as SNAP or WIC( Reference Iglesias-Rios, Bromberg and Moser 71 ). Other studies( Reference Ayala, Baquero and Klinger 88 – Reference Satia-Abouta 91 ) are in agreement with the current outcomes.
Conclusions
Low food security was prevalent in about three-quarters of the clients using food pantries and soup kitchens surveyed in Central Texas, USA. Major reasons cited were lack of financial resources, poor-quality foods in the store, and limited or absent storage and/or cooking facilities. Women or participants who were below the poverty threshold and/or ineligible to receive SSI benefits were at the greatest risk of food insecurity. As expected, food-secure clients’ diet quality was higher than that of the food insecure. The addition of food donations to the base diet resulted in consumption of a total diet that was rich in fruits, total vegetables and grains, dairy and protein foods. Consequently, the improved quality of the total diet (after the addition of the food donations) had a positive influence on food security of the participants.
Policy makers should develop strategies to ensure better accessibility of low-income individuals to public food assistance. Organizations in the community should collaborate to support food emergency programmes by offering resources such as money and food donations to sustain the stability of operations of food rescue nutrition. In addition, food assistance programmes should strive to offer a variety of healthy and tasty foods in adequate quantities to provide optimum diet quality.
Acknowledgements
Financial support: This research was supported by Bess Heflin Centennial Professorship from the Department of Human Ecology, The University of Texas at Austin. The funder had no role in the design, analysis or writing of this article. Conflict of interest: There is no conflict of interest. Authorship: T.Y.M. was a PhD student under the supervision of J.H.F.-G. T.Y.M. and J.H.F.-G. designed the study and formulated the questions. T.Y.M. carried out the research (data collection) and analysed the data. Both authors wrote the article which was supervised by J.H.F.-G. Ethics of human subject participation: This study was conducted according to the guidelines laid down in the Declaration of Helsinki and all procedures involving human subjects were approved by the Institutional Review Board at the University of Texas at Austin. Written informed consent was obtained from all subjects.


