


Indigenous Australians who live in remote settings experience a disproportionately high burden of preventable chronic disease( Reference Vos, Barker and Begg 1 ), with much of this attributable to poor dietary intake( Reference Popkin, Adair and Ng 2 ). In remote Indigenous communities relatively high food prices( Reference Ferguson, O’Dea and Chatfield 3 ) combined with low average incomes( 4 , 5 ) mean food affordability is substantially reduced. In Western countries, reduced food affordability tends to be associated with a diet that has an increased energy density and provides energy cheaply( Reference Drewnowski and Darmon 6 ). This type of diet is usually of poor nutritional quality (high in refined carbohydrates and low in protein and micronutrients)( Reference Drewnowski and Darmon 6 , Reference Brimblecombe and O’Dea 7 ). Indeed, this is consistent with the overall average diet quality that has been previously reported for remote Indigenous Australians( 8 , Reference Brimblecombe, Ferguson and Liberato 9 ). Potentially exacerbating the issue of reduced food affordability in remote Indigenous communities are structural factors such as limited functioning food storage facilities and preparation resources that impact the duration and types of food that can be stored and subsequently the ability to make economical food purchases (e.g. bulk buying). Such structural factors, together with the typically close proximity of the store to households, may underpin the occurrence of frequent (i.e. daily) shopping trips. Social factors, such as complex food-sharing networks within the community, can also drive food choice in this setting( 10 – Reference Brimblecombe, Maypilama and Colles 12 ). When reduced food affordability is combined with factors such as these, there is a real risk that people will run out of money to buy food towards the end of an income cycle( 13 ). There is an inherent assumption within the method of most dietary intake evaluations for remote Indigenous Australians that food and beverage intake is relatively evenly distributed over the evaluation (or an income cycle) period. However, evidence obtained from national survey data( 8 , 14 ) has confirmed that it is relatively common for a remote Indigenous Australian household to experience a period within an income cycle (typically two weeks) where the food budget is low or exhausted, and this is likely to alter food intake patterns. In 2002, approximately one-third of remote Indigenous households nationally reported days without money in the previous two weeks( 14 ). More recently, a 2012–2013 survey found 31 % of remote Aboriginal and Torres Strait Islander people were living in a household that had ‘run out of food in the previous 12 months and couldn’t afford to buy more’; of these, 9 % reported they went without food on at least one of the occasions( 8 ). These statistics are concerning as in addition to the acute effect of people going hungry when food money runs out, there is a well-established link between food insecurity, feast/famine cycles and chronic disease( Reference Burns 15 , Reference Seligman, Laraia and Kushel 16 ).
Although the concept of feast and famine periods occurring within an income cycle in remote Indigenous Australian communities has been well documented( Reference Lee, O’Dea and Mathews 17 – Reference Gracey 19 ), there is very little published research on the relationship between income cycles and fluctuations in dietary intake quality in this setting. One study has investigated food purchasing behaviour over two weeks in a remote Indigenous Australian community( Reference Rowse, Scrimgeour and Knight 20 ); it found increases in daily food and beverage expenditure on the days of, and immediately following, major welfare/income payments and reductions in expenditure on the days prior to the major payments. However, as the study did not investigate the specific food types that were purchased, changes in actual diet quality could not be assessed. Hence, the extent to which the diet quality of remote Indigenous Australians varies in response to income cycle fluctuations in money availability remains unclear.
We hypothesised that for remote Indigenous Australians, a period of low money availability towards the end of an income cycle that causes changes in food choices would reduce diet quality during that period, which in turn would reduce the overall (longer-term) average diet quality. Therefore, the aim of the current study was to consider the plausible nutritional impacts of fluctuations in money availability within an income cycle for Indigenous Australians living in remote communities. The results of the study will inform the design of future strategies, and help identify the potential shortcomings of current strategies, that target improving diet quality in remote Indigenous communities.
Methods
Overview
Dietary intake estimates for Indigenous Australians who live remotely (Accessibility/Remoteness Index of Australia>5·92) are typically derived from either a single short time period (e.g. from a 24 h diet recall during a survey)( 8 ) or an average intake from a sustained period (e.g. from monthly food and beverage provider turnover)( Reference Brimblecombe, Ferguson and Liberato 9 ). Although both of these approaches can provide valuable information about overall diet quality, they do not identify how it may fluctuate over short periods of extremes; for example, during an acute period (day/s) of reduced money availability. Hence, there is limited evidence available to assess whether some strategies to improve dietary quality would be more effective if they were to target specific periods within an income cycle.
The data utilised in the present study were monthly food and beverage turnover figures for one year (including nutritional information) derived from electronic transaction data from all food providers in three very remote Indigenous communities in the Northern Territory, Australia( Reference Brimblecombe, Ferguson and Liberato 9 ). A thorough description of the quality of the overall average intake derived from these data has been previously reported and discussed by Brimblecombe et al.( Reference Brimblecombe, Ferguson and Liberato 9 ).
Changes in food selection in response to fluctuations in income were modelled by identifying through an expert panel food and beverage items that are more likely to be consumed when money availability is relatively low during an income cycle (‘low money period (LMP) foods’). We then simulated the consequences of these food and beverage selections on nutritional quality in two periods: (i) at the beginning of the income cycle (‘early income cycle period’ (EICP)) when money was more likely to be available; and (ii) when money was more likely to be limited at the end of an income cycle (‘LMP’). The modelling worked within the parameters of the actual annual average food and beverage quantities and expenditure values that were observed in the collected data( Reference Brimblecombe, Ferguson and Liberato 9 ).
Average dietary intake and expenditure
Community-level dietary intake (energy, food type, quantity, micronutrients and macronutrients) and expenditure (on foods and beverages) were estimated for three remote Indigenous communities (two desert and one coastal) as previously described( Reference Brimblecombe, Ferguson and Liberato 9 ). In brief, food and beverage transaction data (Universal Product Code or store-derived product code sales data) from each provider within each community (remote Indigenous communities typically have a very limited number of food providers) were recorded for all purchases made over twelve consecutive months (July 2010 to June 2011). To derive nutrition information, all individual food and beverage item product codes, along with their monthly turnover quantities, were linked with their corresponding Food Identification (Food ID) label from the Food Standards Australia New Zealand databases: Australian Food and Nutrient Survey (AUSNUT 2007), reference (NUTTAB 2006 and 2010) or Nutrition Panel Calculator (NPC)( 21 , 22 ). Hence, a single Food ID could include multiple brands of a general food/beverage product.Footnote * Food ID costs per 100 g edible portion varied across providers and months depending on provider product pricing, brand and portion size. The single value for individual ‘Food ID cost per 100 g’ that was applied in the modelling was an average of the monthly values for each Food ID of all individual providers (i.e. combined communities).
Data modelling
Data modelling was conducted using the scenario manager function of Microsoft® Excel 2010. The process modelled possible patterns of food and beverage consumption which vary over an income cycle but were consistent with actual average fortnightly dietary intake and expenditure estimates collected over a one-year duration( Reference Brimblecombe, Ferguson and Liberato 9 ). Average daily dietary intake and expenditure were calculated for each Food ID using aggregated annual turnover values (of all months from all food providers). Average daily per capita values were determined based on an estimated combined community’s population of 2644( Reference Brimblecombe, Ferguson and Liberato 9 ).
Diet quality assessment
The primary markers of diet quality were macronutrient profile (protein, carbohydrate and fat), sugar, fibre, total long-chain n-3 fatty acids and micronutrients that were found to be <100 % of population-weighted Estimated Average Requirements/Adequate Intakes (K, Ca and Mg) or >200 % of population-weighted Estimated Average Requirements/Adequate Intakes (vitamin C, Fe, folate, niacin and Na) based on complete turnover( Reference Brimblecombe, Ferguson and Liberato 9 ). Secondary markers were total energy, energy density (kJ/g) and energy cost ($AU/MJ).
Dietary intake during low money periods
LMP foods were identified from a review of the literature( Reference Brimblecombe and O’Dea 7 , 10 , Reference Burns 15 , Reference Lee, Smith and Bryce 23 ), a review of monthly Food ID purchasing patterns of the included communities( Reference Brimblecombe, Ferguson and Liberato 9 ) and consultation with an expert panel of researchers. LMP foods mainly comprised relatively cheap (e.g. tinned spaghetti) or highly preferred energy-dense processed foods (e.g. canned corned beef) and basic foodstuffs including refined grains (e.g. flour and bread) and sugar. A number of food/beverage items were also identified that were likely to be consumed consistently irrespective of money availability (‘consistent foods’); for example, school lunch programme foods and cooking oil. A summary list of LMP foods and consistent foods is provided in Table 1. Of the 1164 individual Food ID listed in the original three communities’ turnover data, the total number of Food ID classified as LMP foods and consistent foods was forty-five and forty-one, respectively.
Table 1 Summary of low money period and consistent foods
Model structure
The objective of the modelling was to simulate the nutritional outcomes of a range of feasible scenarios about potential food choice responses by individuals to an LMP. The modelling used the actual price of food and beverage items (derived from the one-year data set) and the predetermined LMP and consistent food lists. Each scenario was defined by the following two characteristics: (i) the number of LMP days experienced within an income cycle; and (ii) the proportion of the fortnightly food and beverage budget that was available for the LMP.
In the modelling the LMP foods were set to be consumed in the same proportions relative to each other as they were consumed on average over the one-year data collection period; however, the combined amount of LMP foods could change depending on the allocated budget (percentage of total income cycle period food and beverage money) for the scenario. The total quantity of foods/beverages consumed in the LMP was determined by the LMP scenario budget and the actual price of the LMP food items. Consistent foods were programmed to be consumed in equal amounts on all days in the income cycle; however, the cost of purchasing these foods was deducted solely from the EICP.Footnote *
The remaining (non-LMP or consistent foods; termed ‘EICP foods’) were considered to be foods that would be purchased and consumed only when money was more readily available. The EICP diet contained the entire quantity of the EICP foods, consistent foods at a fixed daily rate, and the remainder of LMP foods that were not allocated in the LMP (derived by calculating the residual after removing the scenario-specific LMP food purchases from total purchases).Footnote † The total sum of food and beverage intake and expenditure for the entire income cycle (i.e. EICP+LMP) was consistent with the average dietary intake and expenditure estimates for that period that were collected over a one-year period( Reference Brimblecombe, Ferguson and Liberato 9 ). A summary table of when various foods were assumed to be consumed and purchased is provided in the online supplementary material, Supplemental Table 1.
Although the period of limited money is colloquially referred to in remote Indigenous communities as a ‘week’ (e.g. low money week), qualitative reports suggest that money availability may be limited within just days of an income payment, since available money is typically spent immediately (i.e. resulting in a low money ‘week’ that is greater than seven days)( Reference Saethre 18 , Reference Gracey 19 ). Alternatively, this period could be lessened by a shift in the number individuals within a household receiving their income payments on different nominated days of the week (i.e. resulting in a low money ‘week’ that is less than seven days). Hence on a variable basis the ‘low week’ could feasibly range in duration from the majority of an income cycle to just a few days. Hence, the scenarios selected for the present study were designed to cover a range of feasible situations that considered both long- and short-duration possibilities for low money availability. Therefore, the following LMP scenarios (expenditure and duration) were modelled:
-
1. During a fortnightly period (a typical income cycle) on ten days (71 % of the time) an individual would have limited money to purchase food (i.e. be experiencing an LMP). During this LMP only 25 % ($AU 45·54 total ($AU 4·55/d)) of the person’s total fortnightly food budget ($AU 182·15) would be spent and only LMP foods would be purchased.
-
2. … on seven days (50 % of the time) … 20 % ($AU 36·43 total ($AU 5·20/d)) would be spent …
-
3. … on four days (29 % of the time) … 10 % ($AU 18·22 total ($AU 4·54/d)) would be spent …
-
4. …on two days (14 % of the time) … 3 % ($AU 5·46 total ($AU 2·73/d)) would be spent …
Ethics approval
Ethics approval to conduct the data modelling was provided by the Human Research Ethics Committee of the Northern Territory Department of Health and Menzies School of Health Research, and the Central Australian Human Research Ethics Committee. All participating communities, food providers and food services gave written consent for the data collection process of the original study.
Results
Remote Indigenous diet composition
Overall average estimated daily dietary intake over one year for the three remote Indigenous communities has been previously reported and discussed in detail( Reference Brimblecombe, Ferguson and Liberato 9 ). For quick reference, the overall average (combined communities) diet composition and expenditure values are summarised in Table 2.
Table 2 Scenario modelling of nutrition expenditure and quality in response to income period fluctuations in money availability; data derived from electronic transaction data on food and beverage purchases from all food providers in three very remote Indigenous communities in the Northern Territory, Australia, July 2010 to June 2011
EAR, Estimated Average Requirement; AI, Adequate Intake; EICP, early income cycle period; LMP, low money period; %E, percentage of energy; DFE, dietary folate equivalents.
* Nutrient requirements derived using Estimated Average Requirements, population-weighted for age, gender, pregnant and breast-feeding.
† The number of days within a fortnight (income cycle) in which money availability was considered as low.
‡ The percentage of total fortnightly food and beverage expenditure spent during the LMP.
Scenario modelling
All scenarios resulted in a lower diet quality during the LMP compared with the overall average diet values. A detailed summary of results is provided in Table 2. For the LMP food list, the EICP food list and the overall average diet, the major foods contributing to energy, quantity, macronutrients and expenditure are provided in Table 3. The daily LMP dietary intake estimate was the same for the 10 d/25 % and 4 d/10 % scenarios due to them having the same ratio of days to income percentage (daily LMP foods expenditure) and the same LMP food set. However, due to the different durations of the LMP in these scenarios, the daily EICP dietary intake estimates were different.
Table 3 The five food categories providing the highest contribution to energy, macronutrients and expenditure for each scenario period; data derived from electronic transaction data on food and beverage purchases from all food providers in three very remote Indigenous communities in the Northern Territory, Australia, July 2010 to June 2011
LMP, low money period; EICP, early income cycle period.
The LMP foods had a reduced energy cost ($AU/MJ) that mitigated declines in energy for the 10 d/25 %, 7 d/20 % and, to a lesser extent, the 4 d/10 % LMP scenarios. Nevertheless, during the 2 d/3 % LMP scenario energy intake was reduced to only 51 % of the overall average diet (Fig. 1). Relative to the overall average diet values, the LMP diet, for all scenarios, had lower protein (Fig. 2) and fat energy percentages and increased carbohydrate energy percentage.
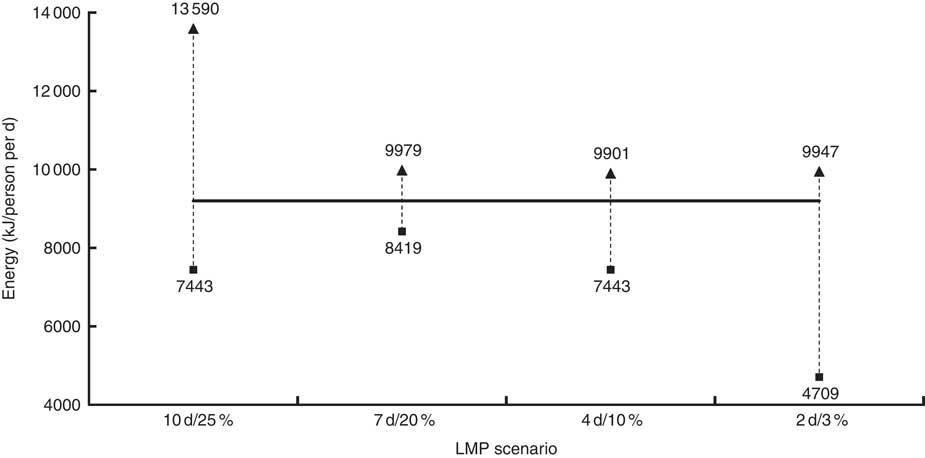
Fig. 1 Scenario modelling of dietary energy in response to income period fluctuations in money availability (———, overall average diet; ▲, EICP; ■, LMP); data derived from electronic transaction data on food and beverage purchases from all food providers in three very remote Indigenous communities in the Northern Territory, Australia, July 2010 to June 2011 (EICP, early income cycle period; LMP, low money period)
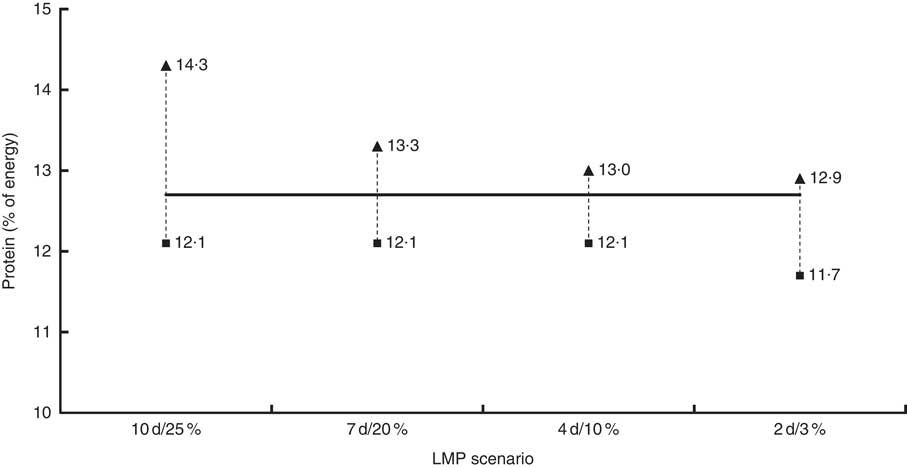
Fig. 2 Scenario modelling of dietary protein in response to income period fluctuations in money availability (———, overall average diet; ▲, EICP; ■, LMP); data derived from electronic transaction data on food and beverage purchases from all food providers in three very remote Indigenous communities in the Northern Territory, Australia, July 2010 to June 2011 (EICP, early income cycle period; LMP, low money period)
The income cycle period did not appear to substantially affect Na intake, which was similarly high in both the EICP and LMP relative to energy intake. In all scenarios except for the 10 d LMP scenario, K was below the population-weighted Adequate Intake for both the EICP and LMP( 24 ), although it was notably lower in the LMP. The ratio of Na to K was superior (lower) in the EICP. Vitamin C and Fe intakes during the LMP were less than the population-weighted Estimated Average Requirements, which reflects a low intake of key food sources (fruit, vegetables and/or meat) in this period. Ca was also below the population-weighted Estimated Average Requirement, although values were similar in both income periods.
The theoretical cost of maintaining the EICP diet for the entire duration of the income period (fortnight) was $AU 273·01 (an additional 149·9 %) in the 10 d/25 % scenario, $AU 100·09 (an additional 55·0 %) in the 7 d/20 % scenario, $AU 43·68 (24·0 %) in the 4 d/10 % scenario and $AU 22·45 (12·3 %) in the 2 d/3 % scenario.
Discussion
The scenario modelling undertaken in the present study suggests that the food selection choices made during even a relatively short period of low money at the end of an income cycle negatively impact overall diet quality relative to a situation where the diet quality achieved in the EICP is maintained. When these results are considered in conjunction with microeconomic theory relating to consumer behaviour( Reference Mas-Colell, Whinston and Green 25 ), they suggest that there is case for using differentiated diet improvement strategies in different periods within the income cycle (i.e. early income cycle and low money periods).
The LMP diet had considerably lower energy costs ($AU/MJ) compared with the overall average diet that buffered against declines in energy intake with reduced food expenditure. The lower energy cost and reduced nutritional quality in the LMP diet are consistent with economics of food choice theory, whereby consumers with limited resources preference energy-dense, nutrient-poor diets( Reference Brimblecombe and O’Dea 7 , Reference Drewnowski and Darmon 26 ). It has been suggested that this dietary pattern may, over time, promote overconsumption of energy and subsequently lead to obesity and its related co-morbidities( Reference Drewnowski and Darmon 6 ). However, the observed large reduction in energy during the 2 d/3 % LMP scenario suggests that if money is severely limited (e.g. a scenario budget of only $AU 2·73 or less per day), it is unlikely that people can feasibly maintain even close to their daily estimated energy requirements on those days; at least with the currently available foods and prices. Although remote Indigenous Australians experience a high prevalence of overweight/obesity( 27 ), the lower energy intake in the LMP must be considered in the context of the low diet quality and the flux in dietary energy intake across the two-week income cycle period. There is a link between periodic food deprivation (i.e. the feast and famine cycle) and obesity( Reference Burns 15 , Reference Seligman, Laraia and Kushel 16 ), which may relate to an adaptive physiological response to periods of reduced food money availability leading to binge eating when food money is relatively more available (i.e. the EICP)( Reference Dinour, Bergen and Yeh 28 ).
In the current analysis, protein intake was relatively lower in the LMP for all scenarios (range 11·7–12·1 %). The lower protein intake during an LMP is consistent with research findings by Brooks et al.( Reference Brooks, Simpson and Raubenheimer 29 ) that showed a higher cost of deriving energy from protein compared with carbohydrate or fat. These LMP protein values, as well as the overall average (12·7 %) and EICP values (range 12·9–14·3 %), all sit below the Australian estimated Acceptable Macronutrient Distribution Range for protein (15–25 % of energy)( 30 ). Preliminary evidence suggests that over a sustained period a dietary pattern low in protein may promote excess energy intake, leading to obesity through what has been deemed the ‘protein leverage hypothesis’( Reference Raubenheimer, Machovsky-Capuska and Gosby 31 ). In the LMP the protein energy was typically replaced by carbohydrate energy, much of which was derived from highly processed foods. An overconsumption of rapidly absorbed carbohydrates (e.g. refined flour and added sugar) can also contribute independently to the risk of developing type 2 diabetes and CVD( Reference Malik, Popkin and Bray 32 – Reference Schulze, Liu and Rimm 34 ). Total and saturated fat intakes were slightly reduced in the LMP, due primarily to a relative increase in refined carbohydrate-based foods. Nevertheless, the quality of fat that was consumed in the LMP was poorer, such that total long-chain n-3 fatty acids were below population-weighted Adequate Intake levels in this period for all scenarios.
Despite all scenarios showing an overall lower diet quality in the LMP relative to the EICP, there are a number of occasions where individual nutrients that are typically associated with enhanced diet quality were higher in the LMP; for example, folate in all scenarios other than the 2 d/3 %, and fibre, Fe and Ca in the 7 d/20 % scenario. This result may reflect nutrient fortification in foods such as bread, which contributes heavily in the LMP (Table 3). The observed absence of alcohol intake reflects that most remote Indigenous communities (and all three included in the present study) prohibit alcohol.
In all scenario EICP and the LMP scenarios where energy intake was reasonable (i.e. the 10 d/25 %, 7 d/20 % and 4 d/10 % scenarios), the absolute Na intake was typically high. However, Na:K was more favourable during the EICP. A high Na intake in conjunction with a low K intake is consistent with an excessive intake of processed foods and low intake of minimally processed whole foods, including fresh fruit and vegetables and meat. This is reflective of the food categories that provide the greatest contribution in the EICP and LMP (Table 3). The results of our modelling are consistent with previous research that found diets that are more rich in K to be associated with higher costs( Reference Drewnowski, Rehm and Maillot 35 ). There are several low-cost sources of K available (including canned beans, milk, bananas and carrots( Reference Drewnowski, Rehm and Maillot 35 )) that could be promoted during LMP in conjunction with implementing strategies to reduce Na in both periods (particularly at the food supply level)( Reference Brimblecombe, Ferguson and Liberato 36 ).
Irrespective of the income cycle period, total sugar was extremely high, contributing one-third of total energy overall( Reference Brimblecombe, Ferguson and Liberato 9 ). The main sources of sugar in the LMP and EICP were sugar per se and sugar-sweetened beverages (SSB), respectively. The overall average per capita SSB intake was equivalent to ~1·5 cans/d and contributed ~18 % of total food and beverage expenditure. In the modelling scenarios SSB were classified as an EICP food (due primarily to their relatively high item cost), whereas sugar per se was classified as an LMP food as it is relatively cheap and generally considered to be a basic foodstuff (e.g. added to tea)( Reference Brimblecombe, Maypilama and Colles 12 ). A number of high-impact-factor reviews, observational studies and meta-analyses have shown that increased SSB intake is associated with excess energy intake, weight gain and an increased risk of type 2 diabetes and CVD( Reference Malik, Popkin and Bray 32 , Reference Malik, Popkin and Bray 33 , Reference Hu 37 , Reference Te Morenga, Mallard and Mann 38 ). Furthermore, as we have previously reported, the substantial expenditure on SSB displaces funds that could otherwise be used to purchase healthier food options and improve overall diet quality( Reference Brimblecombe, Ferguson and Liberato 9 ). Hence, developing strategies to reduce SSB intake in the EICP should represent a key focus of future approaches to improve diet quality.
A recognised limitation of the store turnover data method for estimating nutritional intake is that it does not account for traditional foods( Reference Brimblecombe, Ferguson and Liberato 36 , Reference Brimblecombe, Liddle and O’Dea 39 ). Although traditional foods are culturally very important to remote Indigenous Australians, their contribution to day-to-day energy intake is likely to be, on average, relatively low( 8 , Reference Lee, Bonson and Powers 40 ). The recent National Aboriginal and Torres Strait Islander Nutrition and Physical Activity Survey, which used a face-to-face 24 h dietary recall to obtain dietary intake estimates for remote Indigenous Australians, found that less than 2 % of energy was derived from traditional foods( 8 ). This finding was consistent with a relatively low contribution of <5 % of total energy previously estimated by Lee et al.( Reference Lee, Bonson and Powers 40 ). Nevertheless, since many traditional foods are rich sources of protein and a number of key micronutrients( Reference O’Dea 41 ), even a relatively modest intake that is weighted to a specific income cycle period could affect the modelled disparity in diet quality between the LMP and EICP. The contribution of traditional foods to the diet of remote Indigenous Australians and whether they are more likely to be consumed within a particular phase of the income cycle require further investigation.
The diet quality of the EICP could in theory be achieved throughout the entire income cycle with increases in the total food budget of between 12·3 and 149·9 % (i.e. depending on the scenario). However, increasing food expenditure is not a feasible option and, more importantly, the diet of the EICP is objectively still of poor quality. Hence, sustaining the EICP diet does not represent a viable strategy to effectively improve diet quality. Alternatively, there are several options available to improve nutritional intake without increasing personal expenditure on foods and beverages. Indeed, previous research conducted by our group has demonstrated that it is possible to achieve a diet that meets most nutrient targets with the reported food budget and available foods; however, large shifts in diet are required( Reference Brimblecombe, Ferguson and Liberato 36 ). Our group has also previously identified several options for addressing food affordability( Reference Ferguson, O’Dea and Chatfield 3 ). One approach to improve diet quality is to change the relative price of the healthier compared with less healthy foods via an ongoing third-party financial commitment( Reference Ferguson, O’Dea and Chatfield 3 ) or a price premium (tax) on unhealthy foods to subsidise healthier foods( Reference Magnus, Moodie and Ferguson 42 ). A number of remote Indigenous community stores are already using cross-subsidisation to mitigate the remote location price mark-up on healthy foods( Reference Ferguson, O’Dea and Chatfield 3 ). However, taxation or cross-subsidisation of food products must be carefully considered for acceptability and feasibility by decision makers (including community leaders and retailers) and evaluated to ensure there are no unintended consequences. For example, although SSB taxation is generally effective for improving population weight status irrespective of socio-economic status( Reference Backholer, Sarink and Beauchamp 43 ), if consumers of SSB are highly price inelastic, cross-subsidising healthier foods by raising the price of SSB could result in some people within the community maintaining the unhealthy diet at a higher cost and subsidising the people who already consume a healthier diet.
Other potential approaches in remote Indigenous communities are to provide behaviour change communication programmes about what to purchase during LMP to improve diet quality and/or to introduce or promote minimally processed, nutritious and culturally acceptable pre-prepared foods that are low in cost to produce or to provide in the community (e.g. boiled eggs). Hence, these foods could be priced to be competitive with the current food expenditure during LMP. This approach could substantially improve the overall diet quality without increasing personal expenditure or requiring any additional ongoing funding or subsidisation. However, in some cases there may some initial financial input required to obtain equipment (e.g. combi ovens as an alternative to deep fryers) and employ/train staff in food preparation. In addition to improving food affordability, it is also important for initiatives to consider how individual food preferences, attitudes and behaviours may regulate nutritional intake. For example, for a consumer with a limited budget to adopt a healthier diet she/he may need to adopt unfamiliar eating habits, reduce convenience, consume foods considered less palatable and/or depart from social norms( Reference Drewnowski and Darmon 6 ). Further research is required to establish the feasibility and investigate the effectiveness of pre-prepared food initiatives, community food preparation/cooking lessons, price subsidies, modified in-store environments and behaviour change programmes which utilise knowledge of fluctuations in money availability, to improve diet quality in remote Indigenous communities. Irrespective, it is evident that strategies to improve nutritional intake in remote Indigenous communities must do so with consideration of the complex factors that constrain food budgets and negatively impact one’s capacity to make economical food choices. As an important side note, the Australian Government has invested heavily in recent years to improve food security in remote Indigenous communities. Since the store is typically the main provider of foods and beverages in this setting( Reference Wycherley, Ferguson and O’Dea 44 ), it has been a major focus of government-implemented strategies and initiatives to ensure a stable and consistent food supply. Subsequently remote Indigenous stores typically have a relatively stable food supply throughout the year and systems are in place for emergency food deliveries etc. should extenuating circumstances arise that would compromise food security (e.g. air drops should wet-season flooding close off ground transportation access to a community)( 45 ).
Strengths of the present study include that the data set was derived from a long period (12 months) of comprehensive food and beverage provider turnover from three relatively homogeneous remote Indigenous communities and that it was the first study to investigate how money availability fluctuations may impact diet quality in remote Indigenous communities. Limitations of the study were that individual-level data were not available so we were unable to specifically model how intake may vary in particular at-risk population groups (e.g. children or women of childbearing age). Although population estimates derived from the census represented the most appropriate data to derive the per capita denominator for the current analysis, it is important to consider that population surveys are susceptible to errors such as survey non-response bias and interpretation of terminology, and that in turn this could potentially affect per capita dietary intake estimates for our study. Government welfare pensions/allowances (the primary source of income in remote Indigenous communities( Reference Seligman, Laraia and Kushel 16 , Reference Lee, O’Dea and Mathews 17 )) are no longer paid to everyone on the same day of the week each fortnight. This change reduces the capacity to observe actual community-level fluctuations in overall food and beverage expenditure that have been previously reported( Reference Rowse, Scrimgeour and Knight 20 ). However, it is evident from national survey data( 8 , 14 ) that on an individual and household level people are still experiencing fluctuations in money availability and expenditure over the course of an income cycle, and hence fluctuations in diet quality that are likely to be consistent with the results of the modelling undertaken herein.
In summary, the results of the modelling conducted in the present study suggest that plausible food choice responses to even a short period of low money within an income cycle may noticeably contribute to the reduced diet quality of remote Indigenous Australians and exacerbate lifestyle disease risk. Therefore, rather than using conventional strategies to attempt to improve diet intake quality, irrespective of consideration of when major income payments occur, implementing dietary strategies that are designed to respond to diets and expenditure during different income cycle periods (i.e. early income cycle and low money periods) may have greater impact for improving the nutritional intake of remote Indigenous Australians. In turn this will assist in reducing the disproportionate prevalence of, and morbidity from, lifestyle-related disease. Further research should attempt to obtain information about food preferences of remote Indigenous Australians by investigating what people eat during both the EICP and LMP, including traditional food consumption. Enhancing food knowledge and skills and addressing the higher price (compared with urban settings) of many healthy foods, the limited availability of low-cost healthy convenience foods, the disproportionate availability and promotion of unhealthy foods, high preference for SSB and issues that negatively impact on making economical food choices also remain important considerations for future diet improvement strategies for remote Indigenous Australians.
Acknowledgements
Acknowledgements: The authors would like to thank Anthony Gunther, Claire Georga, Clare Brown, Emma McMahon and Rachael Jaenke for assisting with composing the study food lists. They also thank Terry Jones for providing administrative support for the project. Funding: The Cost of Dietary Improvement project was funded by the National Aboriginal and Torres Strait Islander Health Equity Council. This work was supported by National Health and Medical Research Council (NHMRC) (programme grant numbers 631947 and 320860). T.P.W. was funded by an NHMRC Early Career Fellowship (grant number 1053359). M.M.F. was funded through an NHMRC Postgraduate Scholarship (grant number 1039074). J.K.B. was supported by an NHMRC Early Career Fellowship (grant number 545242) and is currently supported by a National Heart Foundation Future Leader Fellowship (grant number 100085). The funding organisations played no role in the design/conduct of the study, collection/analysis/interpretation of the data or preparation/review/approval of the manuscript. Conflict of interest: None. Authorship: T.P.W. and B.A.K.P. are joint first authors. T.P.W. and B.A.K.P. conceived the study and analysed the data; all authors wrote the paper and have approved the final version. Ethics of human subject participation: The Human Research Ethics Committee of the Northern Territory Department of Health and Menzies School of Health Research, and the Central Australian Human Research Ethics Committee gave ethics approval to conduct the data modelling. All participating communities, food providers and food services gave written consent for the data collection process of the original study.
Supplementary material
To view supplementary material for this article, please visit https://doi.org/10.1017/S1368980016003360


