


Health initiatives that target children at risk for cardiometabolic disease have demonstrated a modest impact on weight-related outcomes and quality of life(Reference Peirson, Fitzpatrick-Lewis and Morrison1,Reference De Onis2) . Accurate identification of ‘at risk’ youth in early childhood is, therefore, fundamental to health measures. Body composition in early childhood is important in determining future risk of cardiometabolic disease(Reference Wells, Chomtho and Fewtrell3), and monitoring of height and weight is a foundational aspect of paediatric care, which allows for the recognition of concerning weight trajectories prior to the onset of serious health consequences(Reference Geserick, Vogel and Gausche4,Reference Society, Summary and Society5) .
Measurement of adiposity in children can be accomplished using a variety of methods. Measurements such as weight for length and BMI z-scores are some of the most commonly used clinical techniques. Dual-energy X-ray absorptiometry (DXA), skin fold thickness measurements, air displacement plethysmography and bioelectrical impedance analysis are measures often used in a research setting to estimate adiposity. While providing a more comprehensive assessment of body composition, these measures can be technically challenging, expensive and not feasible to implement in routine care. Clinical measurements of adiposity should be simple, non-invasive, fast and inexpensive, while also offering diagnostic accuracy and precision. The measured parameter should also be associated with long-term cardiometabolic health. Currently, weight for length is the growth standard used to evaluate adiposity in children from birth to 2 years of age(Reference Society, Summary and Society5–7). However, there is increasing evidence to potentially support the utility of BMI in this age group(Reference Roy, Spivack and Faith8,Reference Furlong, Anderson and Kang9) . For children >2 years old, BMI z-score is the recommended measurement to assess for obesity and nutritional status(Reference Daniels and Hassink10,Reference Styne, Arslanian and Connor11) . However, both these measures have several inherent limitations as they do not specifically capture the amount of body fat or take into account its distribution(Reference Demerath, Schubert and Maynard12–Reference Freedman, Wang and Maynard14).
Waist-to-height ratio is another anthropometric tool that may help stratify obese individuals at an increased risk of health sequelae(Reference Savva, Lamnisos and Kafatos15). Since the presence of visceral fat is strongly associated with cardiometabolic risk in adults, a measure that captures body fat distribution has additional discriminatory value(Reference Fox, Massaro and Hoffmann16). Compared to waist circumference, waist-to-height ratio has additional advantage accounting for the impact of height and relative body proportion on obesity-related risk. In adults, a waist-to-height ratio >0·5 is associated with an increased risk of CVD and metabolic syndrome across different ethnicities(Reference Ashwell and Hsieh17). Studies evaluating waist-to-height ratio in the paediatric age range are largely limited to older children and adolescents, with very few studies exploring the use of waist-to-height ratio in preschool-aged children. Some studies in children aged 3–7 years have shown that this measure may help identify those with risk factors for metabolic syndrome, such as insulin resistance, and is also associated with important indices of body composition such as body fat percentage(Reference Aristizabal, Barona and Hoyos18–Reference Campagnolo, Hoffman and Vitolo20). However, other studies in this same age group have demonstrated that it is inferior to other clinical measures of adiposity and cardiometabolic health(Reference Whitrow, Moore and Davies21–Reference Taylor, Williams and Grant23). To our knowledge, there are no studies comparing waist-to-height ratio with existing measures of adiposity in children under 3 years of age. Accordingly, the objectives of this study were: (i) to determine in young children the ability of waist-to-height ratio, BMI z-score, weight for length, and sum of skin fold thickness to predict cardiometabolic risk and (ii) to examine this association at ages 1, 3 and 5 years.
Methods
We included children from an ongoing cohort of mother–infant dyads in Toronto, Canada. The study design and protocol have been previously described in detail(Reference Retnakaran, Hanley and Raif24). The study cohort consists of mother–infant dyads with and without a history of maternal gestational diabetes mellitus (GDM). Study participants were recruited at the time of their antepartum screening for GDM at the Mount Sinai Hospital outpatient laboratory. All subjects who presented for screening were approached. According to routine practice, pregnant women are universally screened during the second trimester with 50 g glucose challenge test (GCT). Any abnormalities identified during this initial screening (defined as a 1-h plasma glucose ≥7·8 mmol/l) are subsequently referred for a formal oral glucose tolerance test (3 h 100 g). All participants were recruited before or after the GCT, and underwent a diagnostic glucose tolerance test for the determination of GDM status, irrespective of the GCT outcome. This was done to enrich the study population for offspring of women with GDM and cardiometabolic risk. Baseline maternal and paternal data were collected at the time of study recruitment and included demographic data from an established questionnaire. Parental ethnicity was self-reported, and the ethnicity of the offspring was determined by considering both maternal and paternal ethnicity. As the number of participants in each ethnic group was small, participants were classified as either ‘Caucasian/White/European’ and ‘Other’ for the analysis.
Participants and their offspring were followed during pregnancy and postpartum period, evaluating maternal markers of glucose metabolism and adiposity, as well as metabolic changes in the offspring, including growth, adiposity and insulin resistance.
In this analysis, the offspring had their anthropometry measured at 1, 3 and 5 years of age. Subjects were excluded if they were a product of twin pregnancy, if they were delivered prematurely (defined as <32 weeks gestation), if they were low birth weight (defined as a birth weight <2500 g) or if they had a known diagnosis impacting growth. Measurements of adiposity were not collected at birth and, therefore, were not included in the analysis.
Anthropometry
Offspring anthropometry, including waist-to-height ratio, sum of skin fold thickness, BMI z-score and weight for length z-score, was obtained at 1, 3 and 5 years of age. All measurements were obtained in triplicate by trained research staff following standardised procedures(25). A digital paediatric scale was used to obtain weight, rounded to the nearest gram. Up until 2 years of age, recumbent length was obtained using a digital board, rounded to the nearest 0·5 mm. After 2 years of age, standing height was measured using a stadiometer, rounded to the nearest 0·5 mm. Waist circumference was estimated by measuring the circumferential distance between the lowest rib and the top of the lilac crest. Skin fold thickness measurements were obtained in triplicate using a Harpenden Caliper(Reference Pierson, Wang and Heymsfield26) at the triceps, biceps, supra-iliac and subscapular regions. A sum of skin fold thickness was calculated to provide an aggregate measure of adiposity(Reference Schmelzle and Fusch27). These measurements have been shown to correlate well with estimates of body fat, as determined by DXA(Reference Schmelzle and Fusch27,Reference Freedman, Wang and Ogden28) . Supra-iliac and subscapular regions, in particular, are thought to act as a proxy for central adiposity.
Cardiometabolic function
A fasting blood sample was collected from the infants at 1, 3 and 5 years. Fasting duration was defined as the typical length of time the child normally passes overnight without eating. Ideally, this would be a period of 10 h, but a minimum of 4 h was required(Reference Anderson, Maguire and Lebovic29). Subjects were offered the option of a topical anaesthetic cream to minimise any potential pain associated with the procedure. The following measurements were included: insulin (Roche Diagnostics, Laval, Canada; electrochemiluminescence immunoassay range 21–118 pmol/l); glucose (enzymatic reference method with hexokinase); leptin (Millipore, Linco, St Charles, MO; ELISA range 0·5–100 ng/ml); lipids (cholesterol, TAG, HDL, LDL [derived, not measured directly]; Roche, Indianapolis, IN; fluorometric assay).
Insulin resistance was determined using the Homeostasis Model Assessment of Insulin Resistance (HOMA-IR). HOMA-IR is a surrogate measure of insulin resistance that has been validated against gold-standard clamp procedures in non-diabetic young children under 5 years(Reference Gungor, Saad and Janosky30). It is calculated using the following formula: (fasting plasma glucose [mmol/l] × fasting plasma insulin [mU/l])/22·5(Reference Matthews, Hosker and Rudenski31).
Dual-energy X-ray absorptiometry
DXA scans were used to determine fat mass, fat-free mass and percent body fat at the age of 3 years. A Lunar Prodigy whole-body scanner (GE Medical Systems, Madison, WI) was used in conjunction with Encore 2002 software. Results from all scans were interpreted by a trained radiologist. Subjects did not require any preparation prior to the scan, and caregivers were present during the study for comfort. Each scan lasted approximately 3 min, during which time the subject lay supine. DXA scans provided estimates of percent body fat, percent truncal fat and overall fat mass (<1 % CV).
Statistical analysis
Descriptive statistics were used to characterise the study participants at birth and at different measurement intervals. Data are presented as means and standard deviations for continuous variables, and percentages for categorical variables. Continuous variables were assessed for normality of distribution. Natural log transformation was performed for skewed variables when required. Not all subjects were the exact same age at the time of study measurements; and given the age-related variation in anthropometric and biochemical variables, adjustment for age at study visit was performed. When age adjustment was performed, means and standard errors were reported. z-Scores were calculated for weight for length and BMI using the WHO calculator(32). P values <0·05 (two-tailed) were considered statistically significant. The prevalence of obesity was determined in the overall cohort and was defined by the WHO classification criteria(Reference de Onis and Lobstein33).
To assess the relationship between different anthropometric measures, body composition indices and fasting biochemical measures of cardiometabolic risk, Pearson correlation coefficients were used. Log transformation was performed for skewed variables, and Spearman correlation was also performed for variables that remained skewed after transformation. As there were no differences between GDM and non-GDM offspring with respect to waist-to-height ratio, a further stratified analysis was not performed. Coefficient values of 0·0–0·3, 0·3–0·5, 0·5–0·7, 0·7–0·9 represented negligible, weak, moderately strong and strong correlations, respectively(Reference Mukaka34). All statistical analysis was performed with SAS, version 9·4.
Results
Cohort characteristics
A total of 406 subjects had measurements at 1 year; 112 had measurements at 3 years; and 94 had measurements at 5 years of age (Tables 1 and 2). Offspring in the cohort were born at an average of 39 ± 1·3 weeks, with a mean birth weight of 3416 ± 432 g. The offspring cohort was ethnically diverse, with 55·6% identifying as ‘White/European/Caucasian’ and the remaining 44·4% as ‘Other’. ‘Other’ encompassed multiple ethnic groups, including South Asian, Asian, Black, Filipino, Latin American and Arab. Over time, the relative percentage of GDM offspring within the cohort fluctuated between 29·1 % at 1 year to 39·2% at 3 years and 31·9% at 5 years as the sample size changed over time.
Table 1 Cohort characteristics
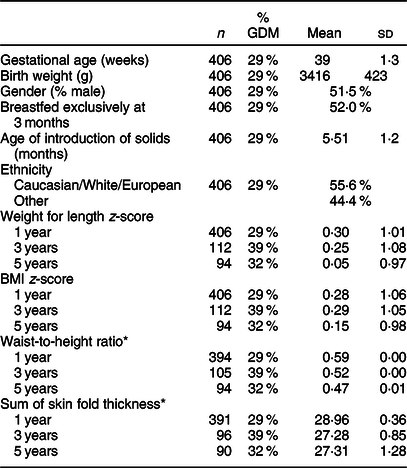
GDM, gestational diabetes mellitus.
* Values are expressed as mean and standard deviation or as estimate ± standard error if age-adjusted.
Table 2 Prevalence of weight classes
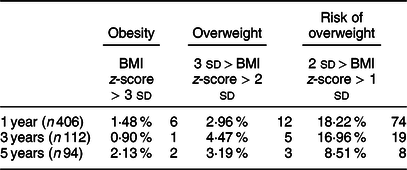
Values are expressed as number of subjects (percentage); definition for weight status based on WHO classification(Reference Martin-Calvo, Moreno-Galarraga and Martinez-Gonzalez35).
The average waist-to-height ratio (estimate and standard error), adjusted for age, was 0·59 ± 0·00, 0·52 ± 0·00 and 0·47 ± 0·00 at 1, 3 and 5 years, respectively. The average BMI z-scores were 0·28 ± 1·06, 0·29 ± 1·05 and 0·15 ± 0·98 at 1, 3 and 5 years, respectively. The average weight for length z-scores were 0·30 ± 1·01, 0·25 ± 1·08 and 0·05 ± 0·97 at 1, 3 and 5 years, respectively. The prevalence of obesity in the overall cohort was determined using the WHO criteria(Reference de Onis and Lobstein33) and defined as BMI z-score >3 SD. The proportion of children with obesity was 1·5 % at 1 year and 2·1 % at 5 years. The prevalence of overweight was 3·0 % at 1 year and 3·1 % at 5 years.
Correlation between anthropometric measures and biochemical cardiometabolic markers
The correlations of anthropometric measures with contemporaneous fasting biochemical measures of cardiometabolic risk are shown in Table 3. Weight for length and BMI z-score demonstrated correlations with the greatest magnitude. They were also most consistently associated with biochemical measures of cardiometabolic risk at each time point. At 3 years of age, BMI z-score and weight for length were positively associated with leptin (ρ = 0·52, P < 0·0001; ρ = 0·51, P < 0·0001) and HOMA-IR (ρ = 0·24, P = 0·02; ρ = 0·25, P = 0·02), and both measures were also positively correlated with fasting insulin and leptin at 3 and 5 years. Only weight for length was positively associated with fasting insulin at 1 year of age (ρ = 0·18, P = 0·02). Conversely, waist-to-height ratio was only moderately positively associated with leptin. The correlation coefficients for leptin and waist-to-height ratio increased in strength from 1 to 5 years (ρ = 0·42, P < 0·0001 at 1 year; ρ = 0·51, P < 0·0001 at 3 years; ρ = 0·65, P < 0·0001 at 5 years). In general, the associations between all of the anthropometric measures and biochemistry were greater over time; however, as a result of subject attrition and ongoing study follow-up, the groups at different time points did not comprise the same population. None of the anthropometric measures were consistently associated with serum lipids.
Table 3 Pearson correlation between anthropometrics and biochemical markers of metabolic risk at 1, 3 and 5 years
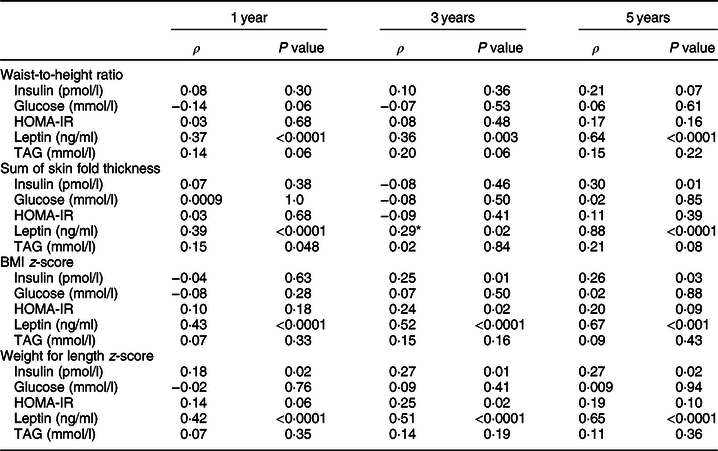
HOMA-IR, Homeostatic Model Assessment of Insulin Resistance; TAG, triacylglycerides.
* Correlations are adjusted for age at the time of visit.
Correlation between anthropometric measures and body composition
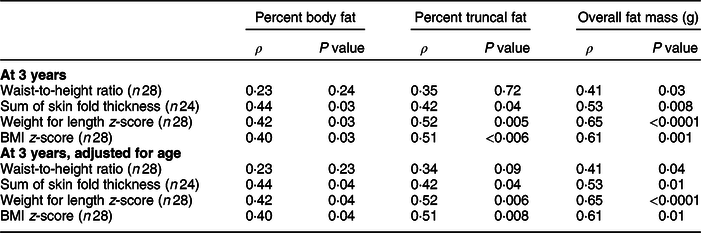
Correlation between anthropometric measures and fat mass at 3 years of age, as estimated by DXA, was determined (Table 4). Waist-to-height ratio was only weakly positively correlated with overall fat mass (ρ = 0·41, P = 0·03). Sum of skin fold thickness, weight for length z-score and BMI z-score were weakly or moderately positively correlated with all three measures of adiposity, including percent body fat, percent truncal fat and overall fat mass. All measures were most strongly positively correlated with overall fat mass and not truncal measures of adiposity.
Table 4 Pearson correlation between anthropometrics and body composition assessed by dual-energy X-ray absorptiometry
Correlation between anthropometric measures at 1 year and BMI at 5 years
The relationships between measures of adiposity at 1 year and BMI z-score at 5 years of age were evaluated to determine the correlation between early childhood anthropometrics and future weight status (Fig. 1). BMI z-score and weight for length z-score measured at 1 year were most strongly predictive of future weight status at 5 years (ρ = 0·53, P < 0·0001; ρ = 0·56, P < 0·0001). Waist-to-height ratio and sum of skin fold thickness were less strongly associated with BMI z-score at 5 years (ρ = 0·28, P < 0·007; ρ = 0·34, P < 0·0001).
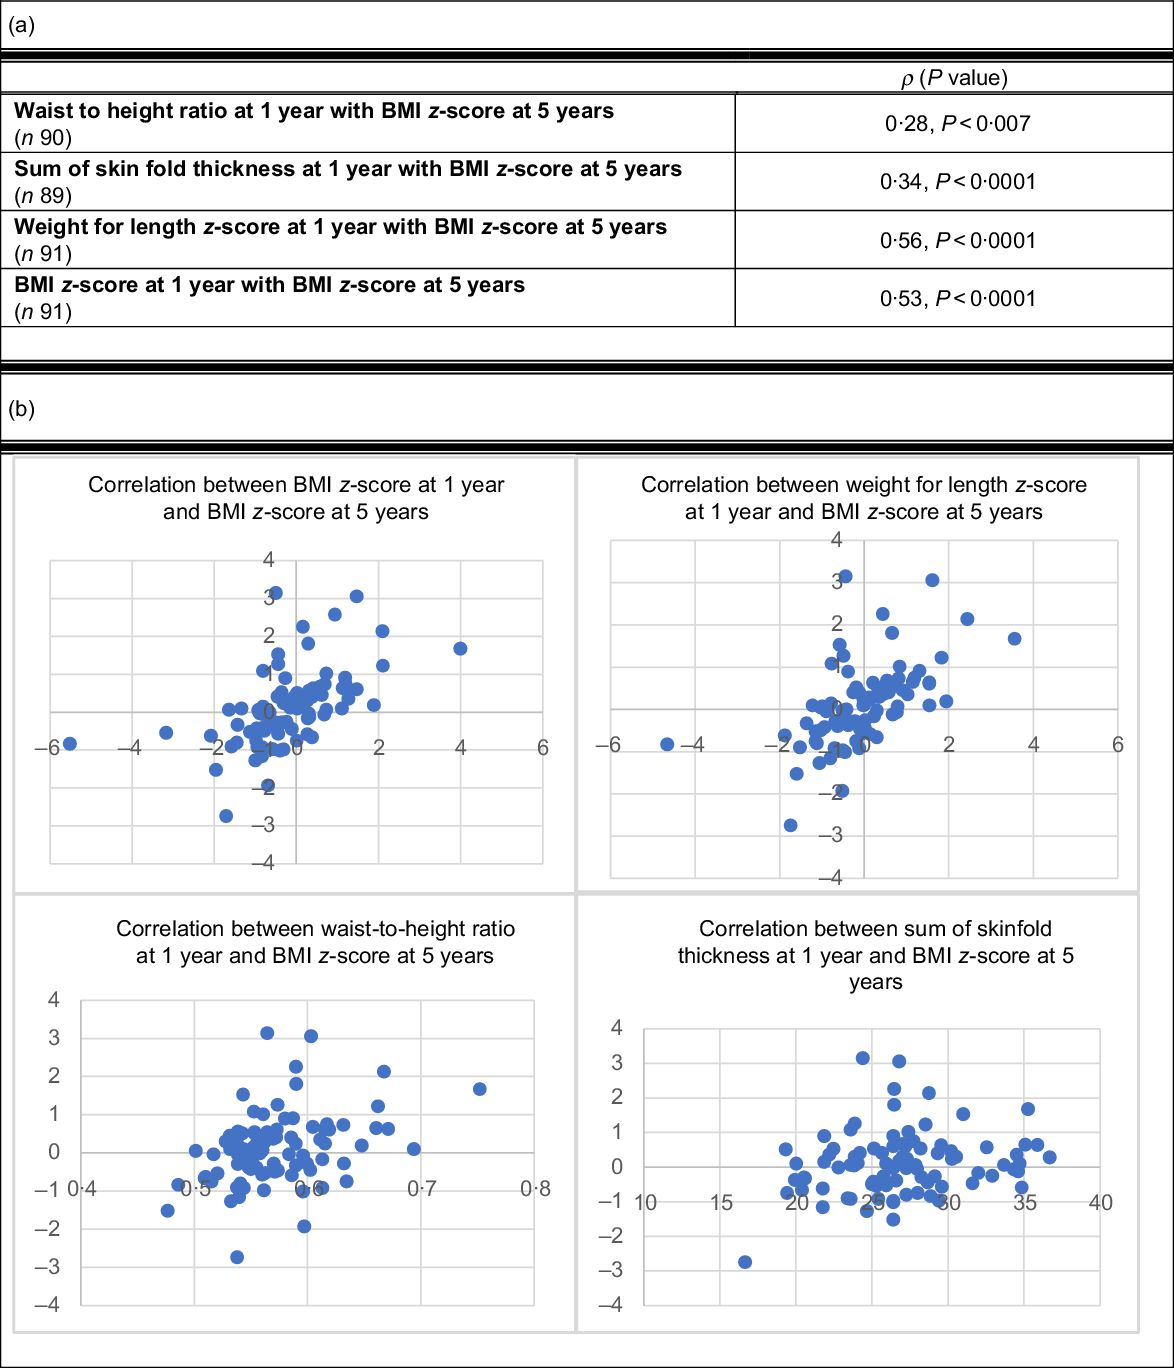
Fig. 1 (a) Pearson correlation between anthropometrics at 1 year and future BMI z-score at 5 years. (b) Scatterplots of Pearson correlations between anthropometrics at 1 year and future BMI z-score at 5 years
Discussion
This study was the first to compare existing measures of adiposity with waist-to-height ratio in young children within a large longitudinal cohort. Importantly, our study illustrates that, unlike in adolescents and adults, waist-to-height ratio, a measure of central adiposity(Reference Martin-Calvo, Moreno-Galarraga and Martinez-Gonzalez35), has a weaker association with biochemical metabolic risks and indices of adiposity compared to BMI z-score or weight for length z-score. Secondly, our study lends further support to the use of weight for length and BMI z-score in early childhood. It adds to the growing literature that endorses the use of BMI z-score as an anthropometric measure for predicting future obesity and cardiometabolic risk, which can be used continuously throughout early childhood(Reference Roy, Spivack and Faith36). In a cross-sectional study, Anderson et al. also described a significant relationship between BMI z-score and biochemical measures of traditional cardiometabolic risk, including leptin and insulin(Reference Anderson, Lebovic and Hamilton37). However, they did not evaluate BMI z-score against other alternative anthropometric measures such as waist-to-height ratio and sum of skin fold thickness. Furthermore, our study analysed fasting blood samples, which more accurately reflects insulin sensitivity compared to random insulin and glucose levels.
While there are several studies that have shown some utility of waist-to-height ratio in predicting metabolic risk among younger school-aged children (3–7 years)(Reference Sijtsma, Bocca and L’abée19,Reference Campagnolo, Hoffman and Vitolo20,Reference Aristizabal, Barona and Hoyos38) , our findings are in line with other studies that found no superiority compared to other measures. A study of 439 healthy children by Whitrow et al. sought to determine the association between waist-to-height ratio and systolic blood pressure. They demonstrated that this measure of central adiposity is not predictive of hypertension(Reference Whitrow, Moore and Davies21). Similarly, Corvalan et al. found a statistically significant correlation between waist-to-height ratio and other indices of body fat in 4-year-olds; however, it was only weakly associated with biochemical cardiometabolic markers(Reference Corvalán, Uauy and Kain22). Finally, Taylor et al. reported that waist-to-height ratio is correlated with trunk fat mass as measured by DXA in 301 children aged 3–5 years; however, waist circumference was overall more strongly correlated(Reference Taylor, Williams and Grant23).
Waist-to-height ratio may not offer the same predictive utility in young children as in adolescents or adults, for several reasons. There are significant changes in body proportion that occur between birth and the first few years of life, related to differential growth of different body segments. As a result, rapid growth and significant changes in height may invalidate the relationship between waist circumference and length. In contrast, in adults and adolescents, height is a more stable measure by which to standardise changes in waist circumference. Other studies in neonates have demonstrated that waist circumference is not strongly correlated with measures of truncal and overall adiposity(Reference Chen, Tint and Fortier39). This may be, in part, due to the technical difficulties that accompany this measurement, including movement, variations in feeding status, and accurate land marking of the ribs and iliac crest. Furthermore, signs of metabolic dysfunction in early childhood are subtle. While abnormalities in patterns of insulin resistance have been identified in early infancy(Reference Ong, Petry and Emmett40,Reference Lawlor, Riddoch and Page41) , accumulation of central adiposity that occurs in adolescents and adults may not have had time to develop. This may reduce the relevance of waist-to-height ratio as a predictor of cardiometabolic risk in early childhood.
One of the challenges of obesity prevention efforts stems from the fact that there is no consensus regarding the optimal way to define obesity in early childhood. At present, weight for length is the recommended anthropometric measure for the evaluation of growth in young children under 2 years of age(Reference Daniels and Hassink42). However, recent evidence suggests that BMI z-score may be more predictive of future obesity risk(Reference Roy, Spivack and Faith36). In our study, both indices demonstrated comparable associations between fasting biochemical measures and fat mass as measured by DXA. The use of BMI z-score is advantageous, as it would simplify growth monitoring for clinicians, allowing for a consistent measure of adiposity throughout childhood.
Interestingly, at 1 year of age, weight for length demonstrated a negligible association with fasting insulin and a weak association with leptin, while BMI z-score was only weakly associated with leptin. As the cohort grew older, both BMI z-score and weight for length showed a correlation with either fasting insulin or HOMA-IR as well as leptin. This suggests that weight for length may begin to correlate with insulin resistance at an earlier age compared to BMI z-score However, at 1 year, both measures were equally correlated with future BMI z-score at 5 years. While the sum of skin fold thickness has consistently shown an association with leptin, the cumbersome technique required to obtain this measurement limits its use in practice. These findings also serve to highlight that alterations in leptin and insulin resistance may be the earliest signs of cardiometabolic dysfunction in young children.
This study has several strengths. It is the first to evaluate waist-to-height ratio in children under the age of 3 years in a prospective and longitudinal design. This measure has been primarily studied in school-aged children with little focus on younger children. The analysis also included multiple measures of anthropometric and fasting cardiometabolic outcomes in very young children. One of the primary limitations of this longitudinal study relates to subject attrition in our cohort, resulting in a smaller number of measurements over time. In the overall study, the drop-out rate remained higher from birth to 1 year, with relatively stable rates of attrition after this time. Many of the mother–infant dyads in this cohort are first-time parents with otherwise healthy children. The childbirth period represents a difficult time for parents and families, rendering follow-up visits more challenging. Furthermore, parents of healthy children may not be as motivated to participate in follow-up visits. Importantly, there was no differential attrition in the proportion of GDM and non-GDM offspring.
Secondly, due to the relatively smaller numbers present at 3 and 5 years, we were unable to analyse the results based on ethnicity, which may have moderated the strength of association between waist-to-height ratio and cardiometabolic outcomes. In this study, 55·6 % of the cohort were classified as ‘White/European/Caucasian’. The remaining 44·4 % were classified as ‘Other’, which encompassed multiple ethnic groups, including South Asian, Asian, Black, Filipino, Latin American and Arab. Importantly, the cohort’s ethnic composition was similar to that of the city of Toronto, with 47·7 % of the city’s population identifying as Caucasian(43). The generalisability of study results to other multicultural cities is hence possible, but may not be universally relevant.
Finally, the rates of overweight and obesity were comparable to other cohorts recruited from the same geographic area(Reference Anderson, Carsley and Lebovic44), but are lower compared to cohorts from previous studies(Reference Sijtsma, Bocca and L’abée19,Reference Corvalán, Uauy and Kain22,Reference Taylor, Williams and Grant23) . The studied measures are likely to be more accurate among children with excess fat mass, as there may be less variation from changes in lean mass with greater adiposity. Enriching our study population with a higher proportion of overweight and obesity would have likely strengthened the relationship between anthropometric and cardiometabolic measures. Our cohort was, however, enriched for the offspring of GDM mothers. While in utero exposure to GDM may be a risk factor for metabolic dysfunction later in adult life, most studies have not found significant differences in anthropometric or metabolic profiles until later adolescence and adulthood(Reference Philipps, Santhakumaran and Gale45,Reference Kim, England and Sharma46) . This is consistent with our study in that we found no differences between GDM and non-GDM offspring with respect to waist-to-height ratio (data not shown).
Taken together, these results demonstrate that in early childhood, BMI z-score and weight for length z-score are superior anthropometric measures in terms of their association with both adiposity and cardiometabolic markers compared to waist-to-height ratio and sum of skin fold thickness. Conversely, waist-to-height ratio is a less useful measure of cardiometabolic health in young children. As BMI z-score may be used as a consistent measure throughout a child’s life time, this further supports its use as a proxy for cardiometabolic health and future weight status in early childhood. Future direction should focus on the relationship between these two measures in early childhood and longer-term cardiometabolic outcomes in adulthood.
Acknowledgements
Acknowledgements: We would like to acknowledge the work of Shiyi Cheng, the biostatistician who contributed to the statistical analysis of the manuscript. Financial support: This work was supported by the Heart and Stroke Foundation of Canada. Conflict of interest: J.H. is supported by the Mead Johnson Chair in Nutritional Science. R.R. holds the Boehringer Ingelheim Chair in Beta-cell Preservation, Function and Regeneration at Mount Sinai Hospital, and his research programme is supported by the Sun Life Financial Program to Prevent Diabetes in Women. The other authors have no disclosures. Authorship: N.C. and J.H. contributed to the design of the study and collection of data. All authors contributed to data analysis and interpretation. N.C. and J.H. participated in the drafting of the manuscript. All authors contributed to manuscript revision and approved the final version. Ethics of human subject participation: This study was conducted according to the guidelines laid down in the Declaration of Helsinki, and all procedures involving study participants were approved by the Institutional Research Ethics Board at Mount Sinai Hospital and the Hospital for Sick Children. Written consent was obtained from all participants, and mothers provided informed consent on behalf of their infant.


