


Evidence from laboratory and free-living studies has linked the consumption of large portion sizes with increased energy intakes across a variety of foods, age ranges and body weights(Reference Jeffery, Rydell and Dunn1–Reference Rolls, Roe and Meengs5). Large portions, particularly of high-energy-density (ED) foods, could challenge innate human appetite control systems and eventually result in weight gain(Reference Wansink and Van Ittersum6, Reference Prentice and Jebb7). This association is supported by epidemiological data highlighting a temporal relationship between increased rates of obesity and portion sizes of foods offered to the public(Reference Prentice and Jebb7, Reference Kelly, Rennie and Wallace8).
The term ‘portion’ is defined as the quantity of food or drink that one would consume on one eating or drinking occasion, also known as ‘portion size’, and expressed in units of weight(9). A ‘serving’ is the equivalent term used by food manufacturers, especially for foods that need to be divided or portioned by the consumer before consumption. Portion sizes can also be referred to in household measures as in dietary guideline systems(10, 11).
The phenomenon of ‘portion distortion’, whereby consumers perceive large portions as appropriate amounts to be consumed on a single occasion(Reference Schwartz and Byrd-Bredbenner12), has been reported across a variety of settings(Reference de Graaf13–Reference Wansink and Kim15). According to one theory, long-term exposure to large portion sizes may lead to portion distortion through the overriding of biological satiety controls present at an early age(Reference Jeffery, Rydell and Dunn1, Reference Prentice and Jebb7, Reference Fisher, Rolls and Birch16). Continued exposure to certain environmental cues, including price incentives, could perpetuate this response(Reference Rolls, Roe and Meengs5, Reference Diliberti, Bordi and Conklin14, Reference Wansink and Kim15, Reference Davis, Curtis and Tweed17, Reference Ello-Martin, Ledikwe and Rolls18). However, other factors such as food attributes and individual preferences may also influence decisions about food portions. For instance, the high palatability and low satiating effect of certain high-ED foods (e.g. chocolate bars and crisps) can lead to the overconsumption of fat and energy(Reference Prentice and Jebb7, Reference Blundell and Macdiarmid19, Reference Yeomans, Blundell and Leshem20). Food presentation(Reference Wansink and Kim15, Reference Raynor and Wing21, Reference Wansink and Cheyney22) and individual traits such as BMI(Reference Davis, Curtis and Tweed17, Reference Burger, Kern and Coleman23, Reference Yuhas, Bolland and Bolland24) have also been reported as factors influencing portion selection.
One question that remains unanswered is whether the effects of external cues and past experience with foods can be overriden by strong physiological signals such as hunger. Published studies have suggested a possible role of appetite status and previous exposure to certain foods in portion selection(Reference Brunstrom, Rogers and Pothos25–Reference Brunstrom and Shakeshaft27); for instance, by influencing the perceived ability of a food to stave off hunger (expected satiety) or to create fullness (expected satiation)(Reference Brunstrom and Shakeshaft27, Reference Higgs28). However, many of these interventions did not systematically manipulate appetite status; mostly food photographs rather than foods were used to estimate ideal portion sizes, and this was in relation to usual consumption rather than linked to current appetite levels at the time of measurement. Differences in the time of day and/or participants’ dietary restraint levels may also have increased variability(Reference Beasley, Hackett and Maxwell26, Reference Brunstrom and Shakeshaft27, Reference Brunstrom and Rogers29).
In order to explore the role of appetite status in portion size estimation in more detail, the present study aimed at testing the hypothesis that appetite status (i.e. hunger v. fullness) influences portion size estimation under laboratory conditions.
We also explored how participants’ estimated portions compared with defined amounts. Consumer research has shown that coexisting portion size systems are confusing to the public because of inconsistent terminology(Reference Hackett30). One basis for the variation in portion size is the purpose for which the approach is used, whether for therapeutic or for public health purposes, along with the manner in which the product it relates to is used in the diet(9). These variations can exacerbate individual differences in the interpretation of what a portion is, limiting the success of portion guidance schemes(Reference Davis, Curtis and Tweed17). In order to explore this issue in more detail, we compared how much the portions estimated by our participants agreed with reference amounts used for clinical purposes (health professionals’ reference instruments), as well as in food labelling (government reference instruments). To decrease variability in portion size estimation(Reference Davy, Van Walleghen and Orr31, Reference Dye and Blundell32), only non-obese men were included. The present study also explored the influence of expected satiation, food familiarity and food liking on portion estimates as reported elsewhere(Reference Brogden and Almiron-Roig33).
Methods
Participants
Sample size was estimated using data from Blake et al.(Reference Blake, Guthrie and Smiciklas-Wright34), according to which thirty-two same-gender participants allowed the detection of significant differences in portion size estimates of at least one item, with α = 0·05 and 80 % power (two-tailed). Participants were recruited from the University of Chester and surrounding areas. Eligibility criteria included: being of male gender; age between 18 and 45 years; BMI between 18·0 and 27·9 kg/m2 (to include lean men with a larger muscle mass); non-dieting; non-smoking; and consuming breakfast regularly. Exclusion criteria were as reported before(Reference Tsuchiya, Almiron-Roig and Lluch35). Those with a relevant qualification in nutrition were also excluded. Individuals willing to participate were pre-screened by telephone interview after which their weight and height were confirmed in the laboratory. Candidates completed the Three-Factor Eating Questionnaire (TFEQ)(Reference Stunkard and Messick36) plus a liking and familiarity questionnaire. Those who scored ≥9 on the disinhibition scale of the TFEQ or those who scored ≥10 on the cognitive restraint scale plus ≥7 on the hunger scale were excluded, as these individuals tend to respond to food cues differently from the general population(Reference Brunstrom and Shakeshaft27, Reference Blundell, Levin and King37, Reference Yeomans, Tovey and Tinley38). Liking and familiarity were assessed on 100 mm visual analogue scales. Participants were excluded if they scored <10 mm (liking) or <30 mm (familiarity) on any of the study foods(Reference Yeomans, Blundell and Leshem20, Reference Raudenbush and Frank39).
After applying the exclusion criteria, a total of twenty-seven men (twenty-one British) were enrolled and completed the study. Mean age and BMI were 24·9 (sd 6·5) years and 23·3 (sd 2·4) kg/m2, respectively. Mean dietary restraint, disinhibition and susceptibility to hunger scores were 4·4 (sd 3·8), 4·8 (sd 2·2) and 6·3 (sd 2·8), respectively. Although below the initially estimated thirty-two, this sample being more homogeneous than that in Blake et al.(Reference Blake, Guthrie and Smiciklas-Wright34) allowed the detection of significant differences (0·01 level). This was probably explained by narrower ranges in BMI and disinhibition scores in our sample compared with Blake et al.'s sample(Reference Yeomans, Tovey and Tinley38).
Study design
This was a randomized, repeated cross-over intervention, with each participant attending the laboratory on four separate occasions spaced at least 5 d apart. At each session, participants rated the number of portions of eight foods and beverages displayed in front of them. Participants rated portions twice after consuming breakfast (full conditions) and twice after an overnight fast (hungry conditions). The order of exposure to each condition was randomized across participants(Reference Williams40). Fullness was induced by requesting that participants under the full conditions consume a cold breakfast 45 min before portion size estimation(Reference Brand, Cagan and Naim41). The study protocol was approved by the Faculty of Applied and Health Sciences Research Ethics Committee, University of Chester. All participants provided written consent and were compensated £20 Sterling for participation.
Procedures
Participants reported to the laboratory at 08.30 hours after a 12 h fast (non-carbonated water allowed). They were asked to refrain from drinking alcohol and to keep evening meals and activity levels similar on the day before each test. After being briefed about the day's activities, participants completed the first set of appetite ratings (see ‘Appetite ratings’). Those under hungry conditions were taken to the test room to complete the test, whereas those under full conditions consumed a breakfast pre-load, immediately after which they completed a second set of appetite ratings. After waiting seated for 45 min, these participants completed a final set of appetite ratings and were accompanied to the test room.
Once in the test room, all participants were allowed 60 s to estimate and record the portion size of all items sequentially, by answering the following question for each item(Reference Beasley, Hackett and Maxwell26, Reference Blake, Guthrie and Smiciklas-Wright34): ‘How many portions of (item) do you think are in this (container type)?’. Container type included plate, bowl, tub, cup or pack. Participants were informed that a portion was defined as ‘the quantity of food or drink that you would consume on one eating or drinking occasion’(Reference Schwartz and Byrd-Bredbenner12) and told to consider this definition when estimating portions. Portions could be recorded as a whole number or as a fraction of a whole number, e.g. ![]() ,
, ![]() , etc. To ensure participants’ estimated portions in the presence of standardized appetite levels, the importance of estimating a portion size at that moment in time was emphasized at each session. On completion of all four study sessions, participants were given a discharge questionnaire asking about the purpose of the study.
, etc. To ensure participants’ estimated portions in the presence of standardized appetite levels, the importance of estimating a portion size at that moment in time was emphasized at each session. On completion of all four study sessions, participants were given a discharge questionnaire asking about the purpose of the study.
Appetite ratings
Participants rated hunger, fullness and thirst using a validated 100 mm visual analogue scale (VAS)(Reference Flint, Raben and Blundell42) presented in booklet form, one scale per page and anchored at each end with opposite labels. Thus, for the question ‘How (attribute, e.g. hungry) do you feel?’ the scale ranged from ‘not (attribute) at all’ to ‘extremely (attribute)’. These data were used to monitor appetite levels throughout the study.
Breakfast pre-load and test foods
The breakfast pre-load consisted of a cheese sandwich, two plain biscuits, orange juice and non-carbonated water. This breakfast provided 3·08 MJ (737 kcal), or approximately one-third of the estimated energy requirements, for inactive men aged 19–49 years(43).
Test foods included snack foods and beverages typically consumed by the university population (Table 1). To decrease confounding, foods and drinks that could be served cold when sold or realistically presented in the original empty container and consumed any time of the day were chosen. Foods were also chosen in such a way so as to include examples of each ED category based on Rolls and Barnett's(Reference Rolls and Barnett44) classification system. Each item was presented in an individual booth, with the sequence randomized across sessions. All visible brand names, weight and/or nutritional information were disguised.
Table 1 Details, amount displayed and portion size of eight tested foods and beverages, according to four portion size reference instruments (from 45 to 48)
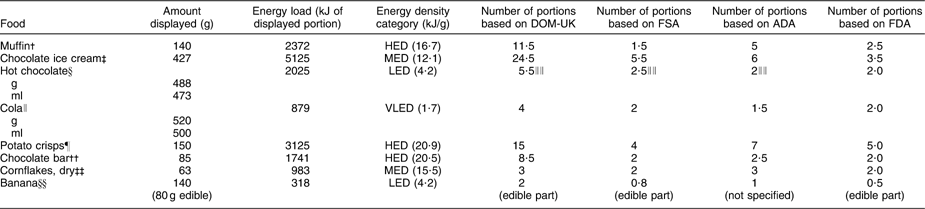
DOM-UK, Dietitians in Obesity Management group of the British Dietetic Association; FSA, UK Food Standards Agency; ADA, American Dietetic Association; FDA, US Food and Drug Administration; HED, high energy density; MED, medium energy density; LED, low energy density; VLED, very low energy density.
Cola, potato crisps and chocolate bars were presented in their original packs as sold. Hot chocolate was presented in an empty take-away container with a heat-proof lid. Ice cream was presented in an original empty tub. Bananas and muffins were presented as sold without packaging, on individual plates (15·5 cm diameter). Cornflakes were presented dry in a cereal bowl (14·0 × 7·5 cm). A standard-sized banana and muffin were purchased each week (mean weight: 140·4 (sd 2·6) g for banana; 139·1 (sd 4·6) g for muffin). Energy content was derived from product label or from the manufacturer's website. Energy density category was based on Rolls and Barnett(Reference Rolls and Barnett44). Conversions used: 1 oz = 28·35 g; 1 fluid oz = 29·57 ml; specific gravity (g/ml) for full-fat milk = 1·031 and for cola = 1·040.
†Starbucks Coffee Company, double chocolate muffin, as sold.
‡Ben and Jerry's Phish Food – chocolate ice-cream tub, as sold.
§Starbucks Coffee Company, signature hot chocolate, made with full-fat milk, no cream.
∥Coca-Cola, 500 ml bottle, as sold.
¶Aldi, specially selected handcooked potato crisps (sea salt), pack as sold.
††Twix Xtra, twin finger chocolate bar, as sold.
‡‡Kelloggs cornflakes breakfast cereal, served from pack.
§§Tesco's whole fresh banana, presented with skin (portion size calculated on the basis of flesh only).
∥∥Hot chocolate reference portion based on portion information for full-fat milk: DOM-UK, 200 ml (377 kJ (90 kcal)); FSA, 200 g or 194 ml; ADA, 1 cup (8 fl oz or 244 g).
Comparison with portion size reference amounts
Estimated portion sizes were compared with reference amounts based on portion size reference instruments from the Dietitians in Obesity Management group of the British Dietetic Association (DOM-UK)(45), the UK Food Standards Agency (FSA)(46), the American Dietetic Association (ADA)(47) and the US Food and Drug Administration (FDA)(48) (Table 1). These were selected as representative portion size schemes from countries with a high consumption of snacks and energy-yielding beverages(Reference Bates, Lennox and Swan49, Reference Kant and Graubard50). DOM and ADA schemes are based on the energy or carbohydrate content of foods and aim to clinically assist overweight/obese patients(45) or those with diabetes(47). FSA and FDA schemes are based on amounts customarily consumed per eating occasion(46, 48) and are used in food labelling.
Data management and data analysis
Data were analysed with the Statistical Package for the Social Sciences statistical software package version 16·0 (SPSS Inc., Chicago, IL, USA). The assumptions for normality were verified for all variables for which parametric tests were applied. VAS ratings for appetite sensations, portion size estimates and per cent error (%error) in estimates were treated as continuous data. Appetite ratings at each time point and mean portion size estimates under each condition were analysed using one-way repeated measures ANOVA with the Geisser–Greenhouse correction where appropriate (P < 0·05)(Reference Minke51). A nested ANOVA was used to assess the independent effect of appetite status on mean portion estimate for each food. One-sample t tests were conducted to compare mean portion size estimates against reference portion sizes for each reference instrument. The Bonferroni correction was applied in all multiple comparisons.
Per cent error of mean portion estimates was calculated on the basis of reference amounts from all four reference instruments as follows: [(mean portion size estimate − reference portion size)/reference portion size] × 100(Reference Blake, Guthrie and Smiciklas-Wright34). Differences in %error of estimations between hungry and full conditions for each food and reference instrument were analysed using the Wilcoxon signed-rank test.
The relationship between %error and food ED, energy load (EL) and weight across foods was explored using Pearson's correlation.
The level of significance for all statistical tests was set to <0·05 (two-sided).
Results
Appetite ratings
Hunger ratings were highest on arrival, decreased following breakfast consumption under each repeated full condition and continued to reduce during the 45 min wait, as expected because of breakfast intervention (Table 2). Fullness ratings followed an exact opposite pattern. Thirst ratings were highest on arrival, decreased following consumption of fluid (in breakfast) and increased afterwards but without reaching baseline levels. ANOVA revealed a significant main effect of time on hunger, fullness and thirst ratings (P < 0·001 for all variables), confirming the effect of the intervention (Table 2).
Table 2 Mean visual analogue scale ratings for hunger, fullness and thirst provided by twenty-seven non-obese men attending the laboratory on four separate occasions (two repeated hungry conditions and two repeated full conditions)
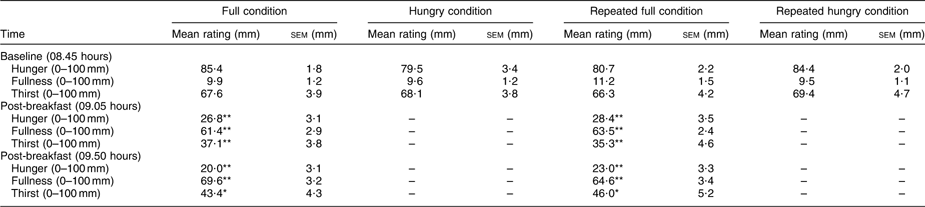
Under hungry conditions, participants rated feelings of appetite after an overnight fast, whereas under full conditions participants did so after consuming a sandwich-based breakfast providing 3·08 MJ (737 kcal). Repeated measures ANOVA confirmed a significant main effect of time on hunger, fullness and thirst ratings (P < 0·001 for all variables). Results of pairwise comparisons are indicated as follows: mean rating differs from corresponding appetite and thirst levels at baseline, with *P < 0·05 or **P < 0·001.
Effect of appetite status on estimated portion size
The smallest mean portion size estimate was for bananas (0·8 portions) and the largest for potato crisps (2·6 portions). When considering all items together, mean estimates were larger under each full condition than under hungry conditions. ANOVA confirmed an overall significant effect of condition on mean portion estimates for all foods. Thus, significant effects were detected for hot chocolate (F (3) = 6·70, P < 0·001), chocolate bar (F (3) = 6·03, P < 0·01), muffin (F (3) = 4·16, P < 0·01), potato crisps (F (2·36) = 7·18, P < 0·01), ice cream (F (3) = 4·19, P < 0·01), banana (F (1·89) = 4·0, P < 0·05), cola (F (2·12) = 3·45, P < 0·05) and cornflakes (F (2·33) = 4·28, P < 0·05). Pairwise comparisons confirmed that portion estimates were significantly lower under hungry conditions than under full conditions for all foods except banana, cornflakes and ice cream, for which non-significant trends were detected (0·05 < P < 0·09). These trends became significant when the data for the two repeated sessions under each condition were pooled together (P < 0·01; see Fig. 1).
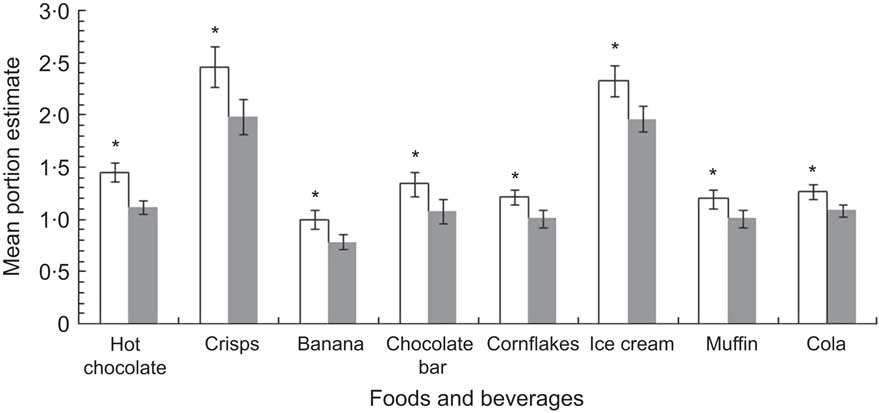
Fig. 1 Mean portion size estimates for the snack foods and energy-containing beverages used in the present study, provided by twenty-seven non-obese men under hungry (![]() ) and full (□) conditions. Data are results of nested ANOVA (n 54) representing pooled data for two repeated sessions under each appetite condition, with standard error of the mean represented by vertical bars. *Portion estimates for ‘full’ differ from ‘hungry’ with P < 0·01
) and full (□) conditions. Data are results of nested ANOVA (n 54) representing pooled data for two repeated sessions under each appetite condition, with standard error of the mean represented by vertical bars. *Portion estimates for ‘full’ differ from ‘hungry’ with P < 0·01
Differences between mean portion estimates and reference amounts for each item (%error of estimation) are shown in Table 3. One-sample t tests using pooled portion estimates for each repeated appetite condition revealed that portion estimates were lower than reference amounts for the DOM-UK (P < 0·001 for all foods), as well as for the FSA, ADA and FDA instruments (P < 0·001 for all foods except banana against FSA, P < 0·05). In addition, %error for each item differed significantly between hungry and full conditions for all reference instruments (Z = −3·51 and Z = −3·57 for hot chocolate and crisps, respectively (P < 0·001); P < 0·01 for all other foods). Per cent error was always higher when participants were hungry compared with when they were full, except for bananas. Compared with FSA and FDA reference amounts, the banana was less accurately estimated when full than when hungry (FSA: full 25 %, hungry 0 %error; and FDA: full 100 %, hungry 60 %error). Otherwise, portion sizes of all foods and beverages were estimated more accurately when participants were full than when they were hungry, irrespective of reference instrument. Despite this, most estimates were still below standard amounts, indicating that portion underestimation still occurs when full.
Table 3 Portion size estimates for the eight foods used in the study and %error of mean portion estimates against reference amounts based on four reference instruments (reference amounts as shown in Table 1)
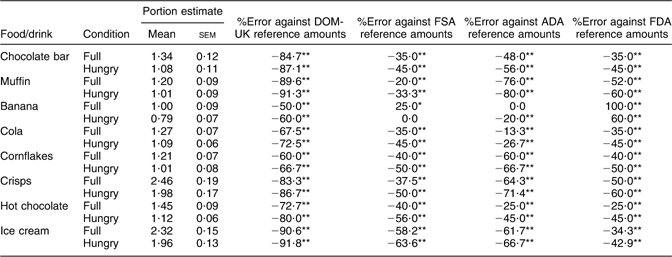
%Error, per cent error; DOM UK, Dietitians in Obesity Management group of the British Dietetic Association; FSA, UK Food Standards Agency; ADA, American Dietetic Association; FDA, US Food and Drug Administration.
%Error was calculated as [(mean estimate – reference portion size)/reference portion size] × 100(Reference Blake, Guthrie and Smiciklas-Wright34). Results from the Student t test corresponding to data from twenty-seven non-obese men attending the laboratory on two repeated occasions under each appetite condition (final n 54) are shown. Data from each of the two repeated appetite conditions were pooled.
Mean portion estimate differs from reference portion size with *P < 0·05 or **P < 0·001.
Overall, the food most frequently estimated with the greatest accuracy was the banana and that estimated with the least accuracy was the ice cream. The DOM-UK instrument was associated with the highest levels of error, whereas the FSA and FDA were associated with the lowest levels of error, excluding the banana. The ADA reference instrument was associated with the lowest levels of error for beverages, irrespective of condition, and with the lowest error for bananas (full conditions). However, levels of error were higher on the basis of the ADA reference instrument for high- or medium-ED foods than when using government instruments.
Influence of food energy density, energy load and weight on portion size estimation
As appetite status did not fully explain underestimation, the role of ED, EL and weight was also explored. To address the worst case scenario, %error corresponding to hungry conditions was used for the analyses. Results revealed a significant correlation between %error of mean estimates and the ED of test foods (r = 0·36, n 32, P < 0·05), which just failed to reach significance when drinks were excluded (r = 0·40, n 24, P = 0·05). ED was responsible for 13 % of the variance in %error (drinks included). No significant correlation was detected between %error of mean portion estimates and weight of test foods (with or without drinks). A significant correlation was detected between %error of mean estimates and EL of test foods (r = 0·39, n 32, P < 0·05), which again lost significance when drinks were excluded (r = 0·38, n 24, P = 0·07). EL was responsible for 15 % of the variance in %error (drinks included). Overall, %error tended to increase with increasing ED and increasing EL. However, the presence of beverages may have distorted results because of their low ED and high energy content.
Discharge questionnaire
Fifteen participants returned the discharge questionnaire, of whom two identified that the purpose of the study was to investigate the effect of appetite status on portion size estimation.
Discussion
In the present study, non-obese men perceived portion sizes of popular snack foods and beverages as being significantly smaller when they were hungry than when they were full. With the exception of bananas, accuracy of estimations decreased under hungry conditions for all items; however, underestimation also occurred when full, irrespective of the reference instrument used for comparison. This suggests that none of the explored instruments matched the participants’ interpretation of a portion.
The present results confirm previous hypotheses on the influence of hunger on portion size estimation(Reference Brunstrom, Rogers and Pothos25, Reference Beasley, Hackett and Maxwell26, Reference Ueland, Cardello and Merrill52). The overall effect of appetite status on portion size estimates was significant in all tested foods and drinks but differences in estimates were more prominent among high-ED foods (i.e. chocolate bar, muffin and crisps) and energy-containing drinks than for the low- or medium-ED foods (cornflakes, ice cream and banana), confirming the potential role of these items in weight gain(Reference Prentice and Jebb7, Reference Drewnowski53). However, ED explained only 13 % of the variance in %error. As the accuracy of estimation probably decreases with increasing portion size(Reference Wansink and Cheyney22, Reference Rolls54), we expected the weight of foods to influence the accuracy of estimates (i.e. a very large volume may have distorted participants' ability to estimate portions). Surprisingly, this was not the case. However, %error did increase with increasing EL, but because of the limited number of tested foods it is difficult to determine which cues participants associated with ED or with EL when estimating portions.
Across standards, the two government instruments (based on weight) were associated with lower levels of error compared with the health professionals’ instruments (based on nutrients and energy). As the range of energy values in our sample foods was larger than the range of portion estimates, greater inaccuracies for energy-based instruments were expectable.
A relevant finding was that, except for the banana, participants rated portions for all foods below reference amounts, irrespective of reference instrument. Thus, in the present study population, none of the tested schemes appeared to accurately represent our participants’ concept of a ‘portion’, even when they were provided with a specific definition during the test. Thus, excluding the banana, fasting participants interpreted one portion of each food as having between 368 and 1679 kJ (88 and 401 kcal) more than a portion based on the FSA reference instrument (and between 253 and 1274 kJ or 60 and 304 kcal when full). Similar results were obtained for the FDA instrument, and the discrepancy was even greater for health professionals’ instruments.
However, these results should be considered with caution. The relatively small and homogeneous sample of participants in the present study may have responded differently compared with a larger and more varied population(Reference Burger, Kern and Coleman23, Reference Yuhas, Bolland and Bolland24, Reference Brunstrom and Shakeshaft27). For instance, it has been suggested that men estimate portions less accurately than women(Reference Burger, Kern and Coleman23–Reference Brunstrom, Rogers and Pothos25), and that ideal portion size is influenced by BMI in some cases(Reference Davis, Curtis and Tweed17, Reference Burger, Kern and Coleman23, Reference Brunstrom and Shakeshaft27), although not always(Reference Rolls, Roe and Meengs5, Reference Brunstrom, Rogers and Pothos25). Other participant characteristics such as sex and dietary restraint have been reported to modulate portion choice when interacting with certain food attributes(Reference Rolls, Roe and Meengs5, Reference Davis, Curtis and Tweed17, Reference Burger, Kern and Coleman23–Reference Brunstrom, Rogers and Pothos25). In addition to the sample characteristics, the way in which the foods were presented to participants may also have affected the results. Large portions of energy-containing beverages, sharer packs of snack food and portions of dessert or snack food sold in very large containers may be difficult to gauge by the average consumer(Reference Wansink and Kim15, Reference Raynor and Wing21, Reference Wansink and Cheyney22). The study protocol also involved reminding participants to evaluate portion sizes at that particular moment in time. On half of the occasions, this represented 45 min after consumption of a large breakfast. These demands could have alerted the participants about the purpose of the study and thus influenced their responses. Finally, we used a laboratory setting devoid of external influences such as smells and social interactions. It is possible that portion estimate differences are even larger under real-life conditions in which external cues may play a stronger role(Reference Wansink and Van Ittersum6).
In an effort to mimic real-life conditions, we displayed large portions of snacks and beverages, presented in some cases as ‘unit’ packs, which tend to be consumed as a whole(Reference Wansink and Kim15, Reference Wansink and Cheyney22, Reference Rolls54). The amounts represented by the schemes used were probably smaller than what participants normally consume (e.g. for muffin, ice cream and beverages). Participants may have estimated portion sizes on the basis of amounts habitually consumed(Reference Brunstrom, Shakeshaft and Scott-Samuel55), rather than engaging in a more complex decision-making process(Reference Brunstrom and Shakeshaft27). In addition, the high palatability of some foods may have challenged the participants' ability to estimate actual portion size(Reference Yeomans, Blundell and Leshem20, Reference Kral56). Although participants were encouraged to estimate portions on the basis of their immediate need, it cannot be guaranteed that this occurred, especially for some high-fat foods(Reference Drewnowski and Almiron-Roig57). However, laboratory data suggest that consumers do not always use previous feelings of satiety to determine subsequent food intake, but instead rely more on actual hunger(Reference Ueland, Cardello and Merrill52), in agreement with our findings. Further research is required to determine whether increased portion size perception actually leads to reductions in food intake and to what extent this is reproduced in women, in participants of higher BMI and in those with dietary restraint, as this may influence dietary learning(Reference Beasley, Hackett and Maxwell26, Reference Brunstrom and Mitchell58).
Conclusions
The present study provides evidence that portion size estimation of some snacks and energy-containing beverages is influenced by appetite status in non-obese men. It is unknown how women and overweight individuals would respond under the same conditions, but we could expect even more pronounced effects if susceptibility to hunger or to food reward is high(Reference Davis, Curtis and Tweed17). Importantly, the portion sizes of such foods were also underestimated when full, confirming the reported discrepancies between the public's understanding of a portion and existing portion size schemes(Reference Hackett30). Government schemes are particularly relevant as they are used in food labelling, but are susceptible to distortion because of increased availability of larger portions. On the other hand, health professionals’ schemes may require adaptation to reflect actual consumption patterns(Reference Young and Nestle59). Nutritional education strategies should take into account the strong influence of hunger, as well as the public's familiarity with recommended portion size schemes. Existing dietary guideline systems, such as the UK's eatwell plate(10) or the US MyPyramid.gov(11), could be optimized by providing objective information on what a portion is (e.g. in grams) for all food categories including snacks, energy-containing beverages, take-away meals and other multi-item foods.
Acknowledgements
The present study was supported by an internal Research Activity Exercise grant from the Faculty of Applied and Health Sciences, University of Chester, to E.A.-R. The authors have no conflict of interest to declare. N.B. recruited the volunteers, collected the data and performed the statistical analysis; E.A.-R. supervised all the steps in the study and obtained the funding. Both authors contributed equally to the study conception, study design and writing of the manuscript. The authors thank Mr Colin Sinclair for statistical advice; Mrs Sue Dunn, Mr Juan M Bravo and Mrs Helen Green for technical assistance; Professor John Banks for revising a draft of the manuscript; and all the volunteers for their participation in the study.


