Neural tube defects (NTD) are the second most common birth defect(Reference Copp, Stanier and Greene1, Reference Yi, Lindemann and Colligs2). The average global birth prevalence of NTD is 2·4 per 1000 live births(Reference Copp, Stanier and Greene1, Reference Arth, Kancherla and Pachón3, Reference Mitchell4), with this prevalence varying from 0·2 to 10 per 1000 live births by geographical location(Reference Copp, Stanier and Greene1). NTD constitute an important public health problem in terms of mortality, morbidity, human suffering and societal costs(Reference Yi, Lindemann and Colligs2). The aetiology of NTD is multifactorial and includes a combination of genetic predisposition and environmental factors(Reference Copp, Stanier and Greene1). The known environmental risk factors for NTD include maternal obesity(Reference Rasmussen, Chu and Kim5), diabetes(Reference Soler, Walsh and Malins6), hyperthermia during early pregnancy(Reference Moretti, Bar-Oz and Fried7), exposure to the fungal product fumonisin(Reference Missmer, Suarez and Felkner8), anticonvulsant drug use (valproic acid)(9), and vitamin B12 and folate deficiency(Reference Copp, Stanier and Greene1, Reference Arth, Kancherla and Pachón3, Reference Mitchell4).
The demonstration of the association of maternal folate status with NTD constituted an important epidemiological achievement(Reference Arth, Kancherla and Pachón3, Reference Mitchell4). In 1991, a placebo-controlled trial undertaken by the Medical Research Council (UK) confirmed the protective effect of pre-pregnancy folic acid supplementation against NTD for those women at high risk due to a previous affected pregnancy(9). As a result, many countries have implemented maternal folic acid supplementation in the pre-pregnancy period and first trimester of pregnancy. However, despite this intervention the prevalence of NTD did not decrease in the succeeding decade(Reference Gomes, Lopes and Pinto10, Reference Abramsky, Botting and Chapple11).
The subsequent implementation of mandatory fortification of cereals with folic acid in some countries, such as the USA, Canada and Chile, resulted in a decreased incidence of NTD(Reference Williams, Mai and Mulinare12–Reference Hertrampf and Cortés14). However, in many European and Asian countries and in New Zealand (NZ), mandatory fortification of food with folic acid was not implemented(Reference Williams, Mai and Mulinare12, Reference Atta, Fiest and Frolkis13, 15). Food Standards Australia New Zealand recommended the mandatory fortification of bread with folic acid from 2009; however, in 2012 NZ put this recommendation on hold and revoked the mandatory programme due to concerns about safety, cost-effectiveness and impact on consumer choice(Reference Evans, Mygind and Peddie16, 17). Instead, NZ continued with the voluntary fortification of breads at a level of 200 μg folic acid/100 g bread. The industry committed to fortify at least 25 % and up to 50 % of bread production. According to the first audit report to the Ministry for Primary Industries in 2012 and 2013, about 14 % of packaged sliced breads were fortified with folic acid, with plans for 25–35 % by the end of 2014(17). Recently (June 2018), the NZ Office of the Prime Minister’s Chief Science Advisor and the Royal Society Te Apārangi published a report which provided compelling evidence that the benefits of mandatory fortification of packaged bread with folic acid outweigh any potential adverse effects. This report recommends the mandatory fortification of breads(18).
Fortification of widely distributed and consumed foods with folic acid has the potential to improve the nutritional status of a large proportion of the population, including women of childbearing age(19). This cost-effective public health intervention requires neither changes in dietary behaviours nor individual decisions for compliance(19, 20). However, to choose the most effective food vehicle to fortify with folic acid, the dietary patterns of the target population need to be known(20, Reference Hsiung, Marsit and Houseman21). Currently, there is a lack of published data about the most suitable foods for fortification with folic acid in a population of pregnant women from diverse ethnicities, in countries where mandatory fortification is still recent or under consideration.
The objectives of the present study were to: (i) describe the dietary intake of the known main food sources of folate in an ethnically and socio-economically diverse cohort of pregnant women from NZ; and (ii) simulate the potential impact of different scenarios of folic acid fortification on the pregnant women’s dietary folate intake.
Methods
Population and study design
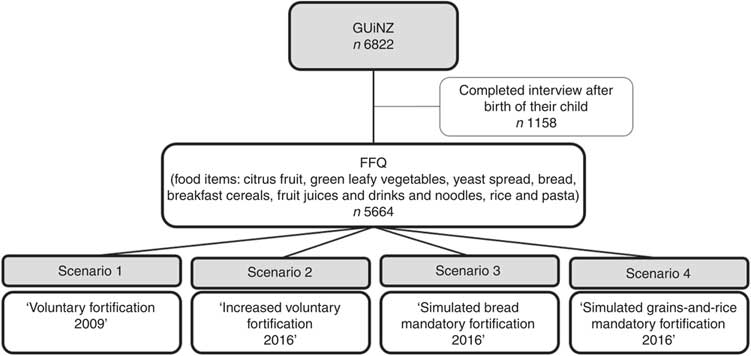
We completed this project within the Growing Up in New Zealand (GUiNZ; www.growingup.co.nz) cohort study. GUiNZ is a nationally representative birth cohort study that was created by the enrolment of a large ethnically diverse sample of pregnant women living in NZ(Reference Morton, Atatoa Carr and Grant22). In total, 6822 pregnant women were recruited into the cohort. The 6853 children that formed the birth cohort will be followed until adulthood. Eligibility of women for enrolment was defined by having an estimated delivery date between 25 April 2009 and 25 March 2010 and residence in a geographic region defined by the three contiguous District Health Boards of Auckland, Counties-Manukau and Waikato. This region was chosen because of its ethnic, socio-economic and rural/urban diversity. For the present study we used data from the antenatal enrolment interview. This collection wave consisted of a face-to-face home interview conducted with the pregnant women, most often in the last trimester of pregnancy.
Ethical approval was granted by Ministry of Health Northern Y Regional Ethics Committee. Written informed consent was obtained from all participating women.
Assessment and estimation of dietary intake
The dietary intake was assessed using a semi-quantitative forty-four-item FFQ which referred to the previous four weeks. To reduce recall bias, only data from the women who completed the interview prior to the birth of their child were included (n 5664/6822, 83 %). As described previously, this FFQ was developed to evaluate the adherence of the study participants to the NZ Ministry of Health guidelines for healthy pregnant women, which encompass recommendations for the intake of four core food groups: fruits and vegetables; breads and cereals; milk and milk products; and lean meat, meat alternatives and eggs(23, Reference Morton, Grant and Wall24). For each of the forty-four food items, the mothers were asked: ‘Which of the following items have you eaten over the last four weeks?’ (yes or no) and ‘How many servings of this item have you eaten over the past four weeks?’ (with frequency options gradually increasing from 1 serving per month to 6 or more per day). The format of the GUiNZ FFQ questions were based in the 2008/09 NZ Adult National Nutrition Survey(25). Show cards with pictures of standard serving sizes were used to help mothers to describe the portion size consumed(Reference Morton, Grant and Wall24, Reference Cade, Thompson and Burley26). The NZ Ministry of Health guidelines for healthy pregnant women include recommendations for consumption of an adequate amount of folate. The 1997 National Nutritional Survey identified that the main food sources of folate for women aged 25–44 years in New Zealand are vegetables (18 %), breads (13 %), breakfast cereals (11 %) and fruit (9 %)(Reference Russell, Parnell and Wilson27). A smaller regional survey completed in 2008–2009 reported similar findings where the five largest food contributors of total dietary folate equivalents (DFE) intake were bread (33 % of total DFE), cereal (11 %), vegetables (10 %), fruit (7 %) and yeast spread (5 %)(Reference Evans, Mygind and Peddie16). These food items were included in the FFQ used in the GUiNZ study. When pregnant women were recruited into the GUiNZ study, NZ did not have mandatory folic acid fortification of the food supply. Therefore, the FFQ used in the GUiNZ study includes the main food sources of folate for pregnant women in NZ and has captured the main dietary folate sources in the NZ food supply.
The present study focused on the dietary intake of foods that are naturally high in folate, or that are fortified or suitable for fortification with folic acid. These include citrus fruit, green leafy vegetables, fruit juices and drinks, yeast spread, bread, breakfast cereals, and noodles, rice and pasta(19, Reference Morton, Atatoa Carr and Grant22). The serving sizes were derived from the NZ Food and Nutrition Guidelines for Healthy Pregnant and Breastfeeding Women (Table 1)(23). Daily intakes (grams) of each food item cited above were calculated by multiplying the portion size by the frequency of intake (number of servings consumed per person per day) reported in the FFQ. Bread intake was calculated by summing the items: white bread, high-fibre white bread, brown/wholemeal/wholegrain bread and other bread. It was not possible to evaluate the items noodles, rice and pasta separately, as they constituted a single food item in the FFQ.
Table 1 Serving size according to the New Zealand (NZ) Food and Nutrition Guidelines for Healthy Pregnant and Breastfeeding Women, dietary folate equivalents (DFE) content (mean) according to the NZ Food Composition Tables (2009 and 2016) for foods naturally high in folate, fortified or suitable for fortification with folic acid, percentage of increase for 2016 v. 2009, and DFE content assumed for the simulated mandatory fortification scenarios. New Zealand, 2008–2010

The NZ Food Composition Tables 2009(28) were used to calculate the mean DFE content of each food item and also the DFE intake of each participant at the time that the antenatal interview took place, constituting the ‘voluntary fortification 2009’ scenario (Table 1). For the year 2016, the calculation of the mean DFE content of the food items under investigation used the NZ Food Composition Tables 2016(29), with this defined as the ‘increased voluntary fortification 2016’ scenario (Table 1). The NZ Food Composition Tables are regularly updated and expanded to include local appropriate food composition values(28, 29). DFE describe the dietary folate content of food and account for differences in the absorption of naturally occurring food folate and the more bioavailable synthetic folic acid (naturally occurring food folates plus (folic acid multiplied by 1·67))(29).
We then studied a third scenario, ‘simulated bread mandatory fortification 2016’, as initially proposed by the Food Standards Australia New Zealand, which states that bread must contain no less than 80 μg and no more than 180 μg of folic acid (median = 130 μg) per 100 g bread(30). This simulation used as its reference the DFE content of the NZ Food Composition Tables 2016(29) and set the bread content of DFE at 130 μg/100 g bread (Table 1).
Due to increased migration to NZ in recent years(Reference Statistics31), NZ has experienced an increase in its cultural diversity and consequently variability in the types of foods eaten(32). Therefore, the fortification of just bread with folic acid might not be sufficient to achieve adequate levels of folate in the target population(Reference Houghton33). Therefore, we created a fourth scenario, ‘simulated grains-and-rice mandatory fortification 2016’, which simulated the DFE intake with the fortification of bread (130 μg folic acid/100 g) as well as of noodles, rice and pasta (113 μg folic acid/100 g). The scenario’s nomenclature and the amount of DFE considered for noodles, rice and pasta in this simulation were based on those established in the USA(34). The reference for the DFE content of the other items was the NZ Food Composition Tables 2016 (Table 1)(29).
The brands and types of breads consumed by the women were unknown as this level of detail was not included in the FFQ. Therefore, the DFE content of breads in 2009 was estimated as the total mean content of DFE of all breads available in the NZ Food Composition Tables 2009. A similar procedure was adopted to estimate the content of DFE from breads in 2016, having as the reference the mean DFE content of all types and brands of breads from the NZ Food Composition Tables 2016.
Figure 1 summarizes the scenarios of food fortification with folic acid considered in the present study and Table 1 shows the portion sizes and DFE values considered to calculate the DFE intake of each study participant.

Fig. 1 Study flowchart. New Zealand, 2008–2010 (GUiNZ, Growing Up in New Zealand cohort study)
Assessment of covariates
The sociodemographic covariates assessed were maternal self-prioritized ethnicity, age, education and BMI, and neighbourhood deprivation.
Detailed information about maternal self-prioritized ethnicity was coded into six Level 1 categories following the Statistics New Zealand coding criteria: (i) European; (ii) Māori; (iii) Pacific Peoples; (iv) Asian; (v) Middle Eastern, Latin American and African (MELAA); and (vi) Other. MELAA and Other were combined for analysis purposes (and designated Others) due to the small number of participants in these groups. Age was categorized as <20, 20–29 and >29 years. Neighbourhood deprivation was described using the 2006 NZ Index of Deprivation (NZDep06), grouped as deciles. These deprivation deciles were then grouped as 1–3 (least deprived), 4–7 and 8–10 (most deprived). NZDep06, derived from 2006 census data on nine socio-economic characteristics, is a well-validated measure of socio-economic deprivation in NZ(35).
BMI was calculated and categorized according to WHO criteria(36), based on women’s self-reported weight (in kilograms) and height (in centimetres). Self-reported information on height and weight during pregnancy has been shown to classify most women appropriately into BMI categories(Reference Brunner Huber37).
Statistical analysis
The prevalence of non-intake of citrus fruit, green leafy vegetables, yeast spread, bread, breakfast cereal (high-fibre and others), fruit juices and drinks, and noodles, rice and pasta was described according to each woman’s sociodemographic characteristics. The χ 2 test identified statistical differences in the prevalence of non-intake according to maternal sociodemographic characteristics.
The DFE provided by each food item was divided by the total DFE (the sum of the studied food items) to obtain the contribution of each food item to the total DFE intake, using as references the NZ Food Composition Tables of 2009 and 2016(28, 29). To facilitate the visualization of food DFE contributions, the following food items were grouped: breakfast cereal (high-fibre) and breakfast cereal (others); and citrus fruit and fruit juices and drinks.
For each of the four scenarios of folic acid fortification, total DFE intake was divided into tertiles and described according to the women’s self-prioritized ethnicity. If ethnicity is not a factor associated with DFE intake, we expect to have 33 % of each self-prioritized ethnicity (European, Māori, Pacific, Asian and Others) in each tertile of DFE intake. Binomial probability tests were used to compare statistical differences in proportions.
All analyses were performed using the statistical software package Stata release 12 (2011). Two-sided significance was determined at P < 0·05.
Results
Participants identified their ethnicity as European (56·0 %), Asian (14·2 %), Māori (13·2 %), Pacific (12·8 %) or Others (3·8 %). Over half of the women (56·4 %) were more than 29 years old, and over half (59·5 %) had BMI ≤ 24·9 kg/m2. Approximately one-third (30·4 %) had completed at least a diploma/trade certificate, and approximately one-third (37·7 %) lived in neighbourhoods in the intermediate category of deprivation (deciles 4–7; Table 2).
Table 2 Prevalence of non-intake of foods naturally high in folate, fortified or suitable for fortification with folic acid consumed by pregnant women in New Zealand according to sociodemographic characteristics. New Zealand, 2008–2010
NCEA, National Certificate of Educational Achievement.
* P values were calculated by χ 2 test, P < 0·05 identified statistically significant differences.
† Others includes maternal self-prioritized ethnicities of Middle Eastern, Latin American and African (MELAA) and Other.
‡ Based on BMI: underweight and eutrophic, BMI ≤ 24·9 kg/m2; overweight, BMI = 25·0–29·9 kg/m2; obese, BMI ≥ 30·0 kg/m2.
§ Area-level socio-economic deprivation was measured using the 2006 New Zealand Index of Deprivation (NZDep06), grouped as deciles.
║ To protect the anonymity of the study participants, cells with low numbers are indicated as below the percentage equivalent to ten individuals.
Non-intake of foods naturally high in folate, fortified or suitable for fortification with folic acid
Of the foods naturally high in folate, fortified or suitable for fortification with folic acid, the most frequently consumed were bread, green leafy vegetables, and noodles, rice and pasta, followed by fruit juices and drinks, citrus fruit, breakfast cereal (high-fibre), yeast spread and other breakfast cereals. Non-intake of these foods varied according to some of the women’s sociodemographic characteristics (Table 2). However, the non-intake of bread did not vary by maternal education or BMI, or by neighbourhood deprivation; and the non-intake of green leafy vegetables and citrus fruit did not vary by maternal BMI or ethnicity, respectively (Table 2).
Foods naturally high in folate, fortified or suitable for fortification with folic acid compared with NZ Food Composition Tables of 2009 and 2016
From 2009 to 2016, the amount of DFE increased for citrus fruit by 111 %, green leafy vegetables by 32 %, fruit juices and drinks by 64 %, yeast spread by 48 %, bread by 25 %, breakfast cereal (high-fibre) by 75 %, breakfast cereal (others) by 56 %, and noodles, rice and pasta by 59 % (Table 1). These increases in DFE content in foods naturally high in folate may have occurred due to the increase in the number of imported products in NZ from 2009 to 2016. The maximum amount of DFE in bread increased from 293 μg/100 g in 2009 to 820 μg/100 g in 2016. The maximum amount of DFE in breakfast cereals increased from 333 μg/100 g in 2009 to 1300 μg and 850 μg/100 g in 2016 for the high-fibre and other breakfast cereal types, respectively. The maximum amount of DFE in the available brands of yeast spread increased from 2000 μg/100 g in 2009 to 3300 μg/100 g in 2016 (see online supplementary material, Supplemental Table 1).
Main contributors of dietary folate equivalents intake according to self-prioritized ethnicity and scenarios of food fortification with folic acid
In the ‘voluntary fortification 2009’ scenario, bread (26 %), breakfast cereals (26 %) and yeast spread (21 %) were the three largest food sources of DFE for the entire sample. Green leafy vegetables were the main contributor of DFE for Asian women (30 %) and the third contributor for Others (20 %). In the ‘increased voluntary fortification 2016’ scenario, breakfast cereals (30 %) became the main contributor of DFE dietary intake, followed by bread (22 %) and yeast spread (21 %) for the entire sample. As expected, bread became the main contributor of DFE intake in the ‘simulated bread mandatory fortification 2016’ scenario for the whole sample and ethnic groups, except for Europeans (for whom breakfast cereals represented the main source of DFE). In the ‘simulated grains-and-rice mandatory fortification 2016’ scenario, bread remained the main contributor of DFE intake for the entire sample. However, the main contributor of DFE intake for Asian women were noodles, rice and pasta, as was breakfast cereal for European women (Fig. 2).
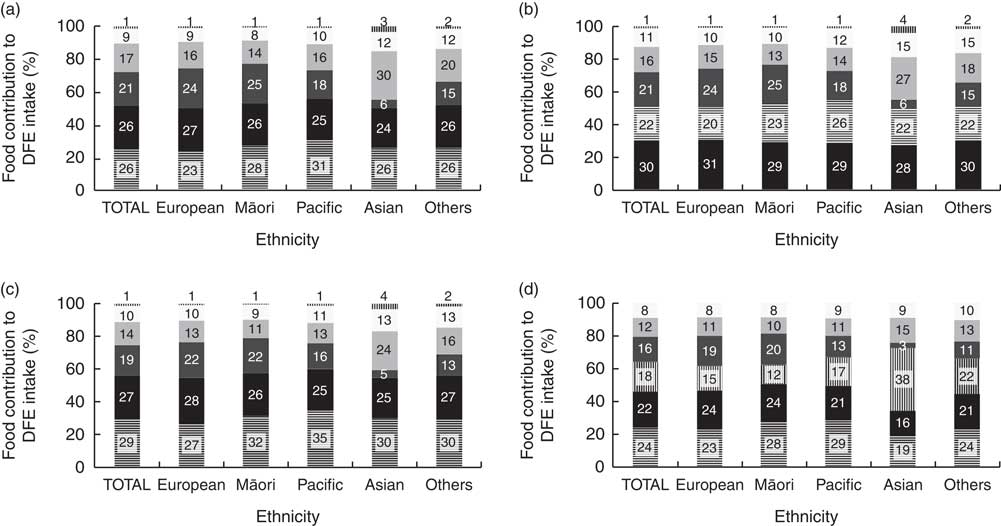
Fig. 2 Percentage food contributions to dietary folate equivalents (DFE) intake from foods naturally high in folate, fortified or suitable for fortification with folic acid (![]() , bread;
, bread; ![]() , breakfast cereals*;
, breakfast cereals*; ![]() , yeast spread;
, yeast spread; ![]() , green leafy vegetables;
, green leafy vegetables; ![]() , citrus fruit, fruit juices and drinks;
, citrus fruit, fruit juices and drinks; ![]() , noodles, rice and pasta), according to women’s ethnicity† and scenarios of food fortification with folic acid (a, ‘voluntary fortification 2009’; b, ‘voluntary fortification 2016’; c, ‘simulated bread mandatory fortification 2016’; d, ‘simulated grains-and-rice mandatory fortification 2016’) in New Zealand, 2008–2010. *The food items breakfast cereal (high-fibre) and breakfast cereal (others) were grouped to facilitate the visualization of food contributions; the food items citrus fruit and fruit juices and drinks were grouped as well. †Others includes maternal self-prioritized ethnicities of Middle Eastern, Latin American and African (MELAA) and Other
, noodles, rice and pasta), according to women’s ethnicity† and scenarios of food fortification with folic acid (a, ‘voluntary fortification 2009’; b, ‘voluntary fortification 2016’; c, ‘simulated bread mandatory fortification 2016’; d, ‘simulated grains-and-rice mandatory fortification 2016’) in New Zealand, 2008–2010. *The food items breakfast cereal (high-fibre) and breakfast cereal (others) were grouped to facilitate the visualization of food contributions; the food items citrus fruit and fruit juices and drinks were grouped as well. †Others includes maternal self-prioritized ethnicities of Middle Eastern, Latin American and African (MELAA) and Other
Dietary folate equivalents intake according to level of intake, self-prioritized ethnicity and scenarios of food fortification with folic acid
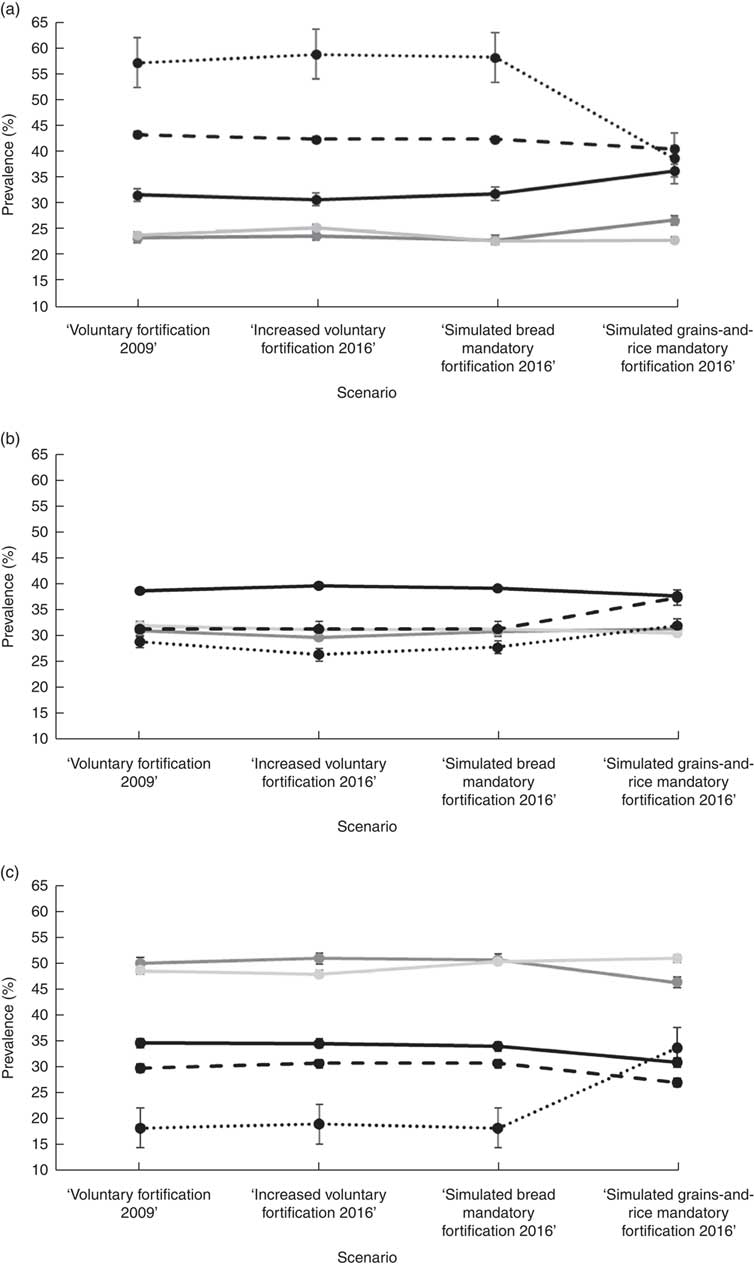
Figure 3 shows the proportion of women, according to their self-prioritized ethnicity and tertile of DFE intake, for the four scenarios of food fortification with folic acid. The proportions in the lowest tertile of DFE intake in the first three fortification scenarios were Asians (58–60 %), Others (43–44 %), Europeans (31–32 %), Pacific (23–26 %) and Māori (23–24 %). In the ‘simulated grains-and-rice mandatory fortification 2016’ scenario, the proportions in the lowest DFE intake tertile were Asians (39 %), Others (41 %), Europeans (37 %), Pacific (23 %) and Māori (27 %). In the first three scenarios, the proportion varied in comparisons between all ethnic groups except for Pacific v. Māori (P = 0·54, 0·17 and 0·93, respectively). In the fourth scenario, the proportions of Asian and Others did not differ from one another (P = 0·28), but both were higher than for the other three ethnic groups.
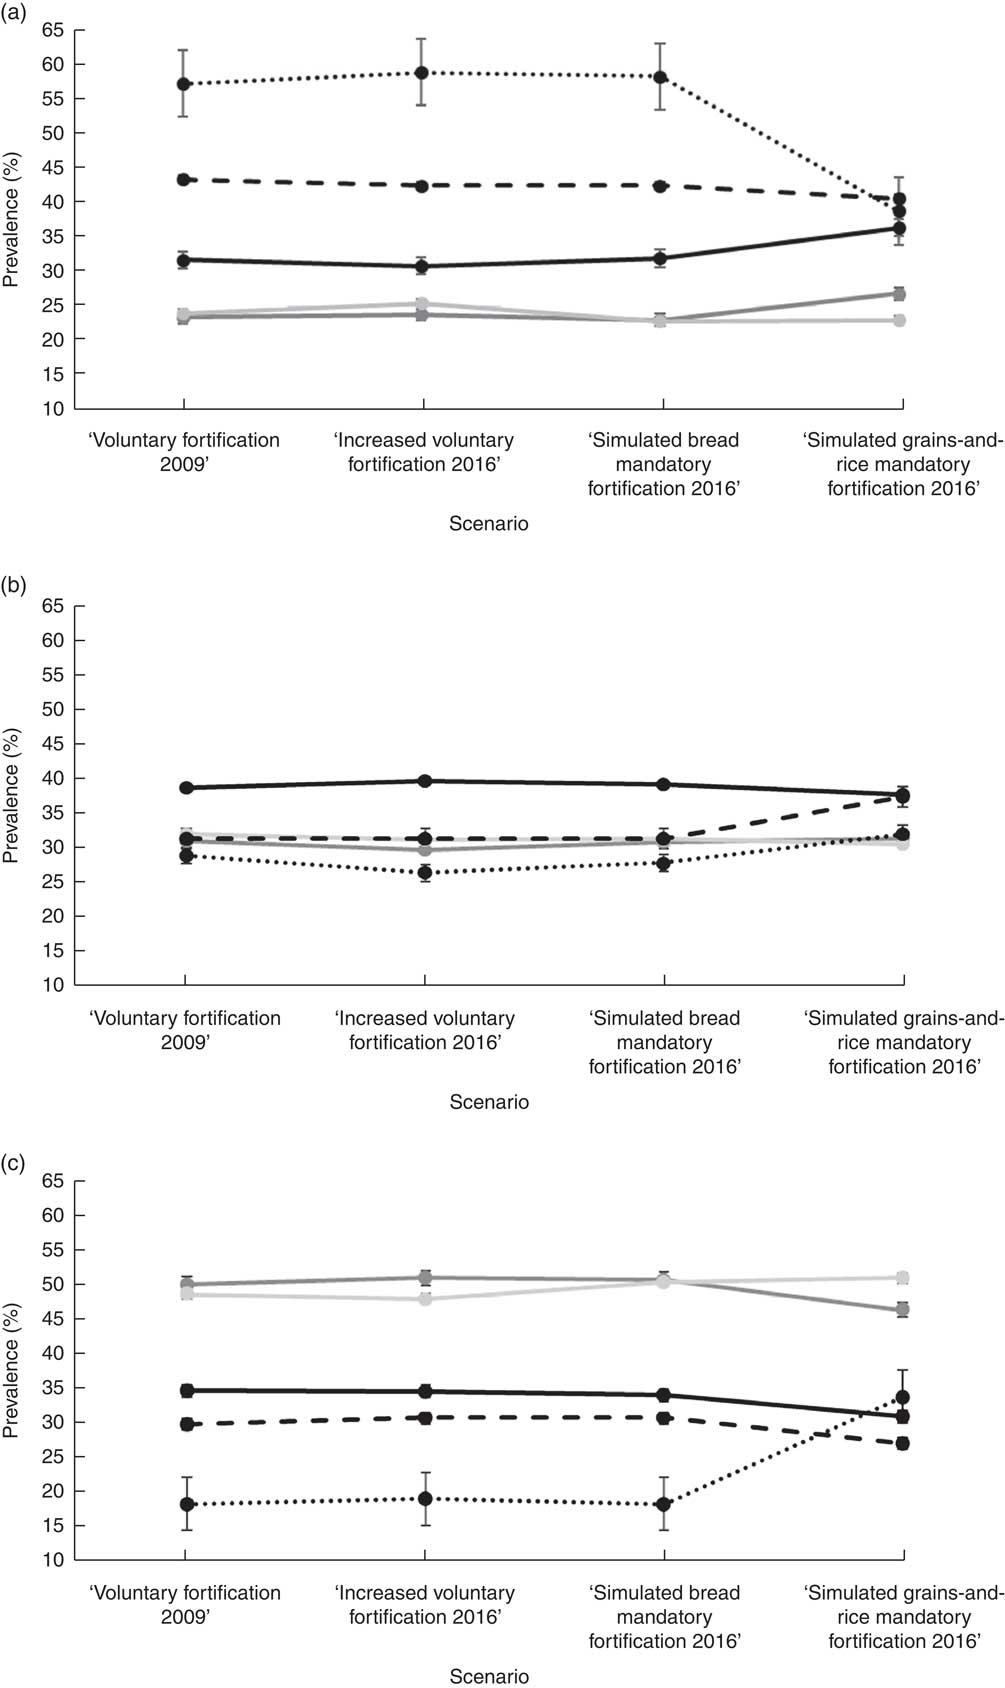
Fig. 3 Prevalence of different ethnic groups (![]() , European;
, European; ![]() , Māori;
, Māori; ![]() , Pacific;
, Pacific; ![]() , Asian;
, Asian; ![]() , Others*) in tertiles of dietary folate equivalents (DFE) intake (a, lowest tertile of DFE intake; b, middle tertile of DFE intake; c, highest tertile of DFE intake) according to the scenarios of food fortification with folic acid in New Zealand, 2008–2010. *Others includes maternal self-prioritized ethnicities of Middle Eastern, Latin American and African (MELAA) and Other
, Others*) in tertiles of dietary folate equivalents (DFE) intake (a, lowest tertile of DFE intake; b, middle tertile of DFE intake; c, highest tertile of DFE intake) according to the scenarios of food fortification with folic acid in New Zealand, 2008–2010. *Others includes maternal self-prioritized ethnicities of Middle Eastern, Latin American and African (MELAA) and Other
In comparisons within each ethnic group across the scenarios, no differences were present for the first three scenarios. In contrast, with the ‘simulated grains-and-rice mandatory fortification 2016’ scenario, the proportion of those with Asian ethnicity decreased in the lowest (P < 0·001) and increased in the middle (P < 0·001) and highest (P < 0·001) tertiles of DFE intake; for European the proportion increased in the lowest (P < 0·001) and decreased in the middle (P = 0·03) and highest (P < 0·001) tertiles of DFE intake; and for Māori the proportion decreased in the highest tertile of DFE intake (P = 0·01).
Discussion
Among the foods naturally high in folate or fortified with or suitable for fortification with folic acid, bread, green leafy vegetables, noodles, rice and pasta, and fruit juices and drinks were the items consumed by more than 80 % of the pregnant women, independent of their sociodemographic characteristics. On average, the amount of folic acid in the fortified food products increased from 2009 to 2016: by 56–75 % for breakfast cereals, 48 % for yeast spreads and 25 % for breads. In the scenario of ‘increased voluntary fortification 2016’, breakfast cereal was the main contributor of DFE intake, followed by bread and yeast spread. In descending order, the proportions of different ethnic groups in the lowest tertile of DFE intake for the four fortification scenarios were Asians (39–60 %), Others (41–44 %), Europeans (31–37 %), Pacific (23–26 %) and Māori (23–27 %). However, in comparisons within each ethnic group across the scenarios of food fortification with folic acid, differences were observed only with the ‘simulated grains-and-rice mandatory fortification 2016’ scenario.
The discussion about mandatory fortification of staple foods with folic acid in NZ has raised arguments in favour(Reference Evans, Mygind and Peddie16, Reference Houghton33, Reference Bower38–Reference Oakley, Weber and Bell44) and against(Reference Marks and Potter41, Reference Mann and Green45–Reference Dalziel, Segal and Katz47) its implementation. There are concerns regarding the potential toxic effects of excessive folic acid intake among children and adolescents, as well as among the elderly, due to the irreversible neurological damage caused by masked vitamin B12 deficiency which can occur with high intakes of folic acid(Reference Skeaff, Green and Mann46). Furthermore, there is concern about the possibility of potential adverse effects of unmetabolized folic acid intake, either from fortified foods or from supplements, or both(Reference Barua, Kuizon and Junaid48). A lifelong exposure to increased amounts of synthetic folate is also hypothesized to increase the risk of cancer(Reference Marks and Potter41, Reference Skeaff, Green and Mann46). Alternative strategies, for example improving adherence among pregnant women to the national recommendations for folic acid supplementation, remains a challenge in NZ and worldwide. In NZ the risk of NTD shows socio-economic and ethnic gradients. Māori women are at higher risk than those of non-Māori non-Pacific ethnicity (relative risk = 2·65; 95 % CI 1·64, 4·29)(Reference Houghton33, Reference Morton, Grant and Carr42, Reference Craig, McDonald and Adams49–Reference Teixeira, Castro and Wall51). NTD are significantly more common in world regions with voluntary v. mandatory folic acid fortification(Reference Atta, Fiest and Frolkis13). In addition to the reduction in NTD rates, the mandatory approach and the consequent higher dietary folate intakes have been shown to be associated with reduced risks of other diseases, including anaemia, CVD, hypertension, neuropsychiatric disorders, cancers and other congenital defects such as heart anomalies and clefts, although the causality of these relationships remains unproven(Reference Marks and Potter41, Reference Cornel, Smit and de Jong-van den Berg52–Reference Bentley, Weinstein and Willett54). So far, studies conducted in countries where mandatory fortification was implemented have not shown any potential negative effects of this policy(Reference Vollset, Clarke and Lewington55). A meta-analyses of data on 50 000 individuals (mean age 64 (sd 10) years) found that folic acid supplementation was not associated with the incidence of cancer of the large intestine, prostate, lung, breast or any other specific site during the first 5 years of folic acid supplementation, indicating that the smaller dose provided by fortification programmes potentially would not affect the risk of cancer development as well(Reference Vollset, Clarke and Lewington55). Recently in NZ, in response to a request by the Ministry of Health, the Prime Minister’s Chief Science Advisor and the Royal Society Te Aparangi completed a review which concluded that the benefits of mandatory fortification of packaged bread with folic acid outweigh any potential adverse effects. Analyses from 2012 suggest that moving from a hypothetical voluntary programme in which 50 % of all packaged breads in NZ are fortified to a mandatory programme in which 100 % of packaged breads are fortified would prevent approximately 5–15 extra NTD pregnancies annually(18).
The economic benefit from the prevention of NTD has been shown to exceed the cost of mandatory folic acid fortification in the USA (benefit–cost ratio = 4·3:1), Chile (11·8:1) and South Africa (30:1)(Reference Yi, Lindemann and Colligs2). In that review, the only study where mandatory fortification was not cost-effective was a simulation study using NZ data(Reference Skeaff, Green and Mann46). This may be the result of the lack of robust data about the costs involved in mandatory fortification for NZ, with wide variation in the costs estimated by the Food Standards Australia New Zealand-commissioned consultant and by the flour industry(30, Reference Dalziel, Segal and Katz47).
According to the NZ Food Composition Tables 2016, the content of folic acid in breakfast cereals varied from 0 to 585 μg folic acid per serving (45 g of breakfast cereal), 4·5 times higher than the permitted(29). In 2009, an evaluation made by the NZ Food Safety Authority showed that the amount of folic acid added to breakfast cereals was between 88 and 374 μg folic acid per serving, indicating both wide variability and excessive content in some breakfast cereals(56). Similar observations were made for yeast spread (8560 μg/100 g), with folate concentration more than four times higher than the permitted and what the label claimed (2000 μg/100 g)(56). The NZ legislation for voluntary folic acid fortification that was in place until June 2018 could potentially exceed the upper limit of intake for individuals in the higher end of intake of fortified breakfast cereals or yeast spreads (without considering other sources of folate) representing, approximately, 1 % of different NZ population groups(56).
A retrospective survey of 723 postpartum women from hospitals and birth centres across NZ showed that mandatory fortification of bread with folic acid would benefit the sectors of the population less likely to use folic acid supplements. However, it also identified that this type of fortification would not benefit subgroups equally, indicating that, with bread fortification, Māori women were more likely to achieve an adequate intake of folate than women of Pacific, Asian and other ethnicities(Reference Mallard, Gray and Houghton39). Studies have suggested that, in NZ, the proposed bread mandatory fortification is probably an outdated policy intervention(Reference Evans, Mygind and Peddie16, Reference Houghton33, Reference Mallard, Gray and Houghton39, Reference Mallard, Gray and Houghton57). When comparing data from 1997 and 2008/09, NZ adults were less likely in 2008/09 to report consuming vegetables, bread, breakfast cereal, pies, biscuits, cakes and puddings and more likely to report consuming rice dishes(Reference Smith, Gray and Mainvil58). Among females, there was an increased reporting of intakes of snacks, snack bars and pasta from 1997 to 2008/09(Reference Smith, Gray and Mainvil58). The change in the dietary intake over time among NZ adults was probably influenced by the increase in the population diversity from the 2000s and, consequently, in the variety of foods that were available(Reference Lawrence59).
The mandatory fortification of flour is a simpler intervention: there is an extensive knowledge of adding B vitamins to cereals (including wheat and maize flours) and rice grains, and there are only a small number of flour millers supplying the NZ market(20, Reference Green, Newton and Bourn60, 61). Furthermore, this approach would provide more options for consumers(Reference Green, Newton and Bourn60). Rice can be more difficult to fortify because usually the supply is produced at a small scale, but the NZ case needs to be further studied(20). If vitamin B12 deficiency is a concern in NZ, this nutrient could also be added to fortified flours(20).
The monitoring and evaluation of a health policy are crucial to identify if it is implemented as planned and if it does more good than harm(Reference Lawrence59, Reference Lawrence62, Reference Lawrence and Riddell63). The fortification of staple foods with folic acid in NZ should include updated, adequate and continued monitoring of NTD(64), and also monitoring of the potential negative outcomes that could be associated with excessive folic acid intake, such as toxicity symptoms (mainly in children and adolescents)(Reference Skeaff, Green and Mann46, Reference Green, Newton and Bourn60), vitamin B12 deficiency (mostly among the elderly)(Reference Skeaff, Green and Mann46, Reference Green, Newton and Bourn60) and cancer risk(Reference Cole, Baron and Sandler65). As part of the baseline and monitoring assessment, only updated national nutrition surveys, ideally with assessment of red-blood-cell folate levels(Reference Green, Newton and Bourn60), will allow for estimation on the prevalence of inadequate and excess folic acid intakes across life-cycle groups(Reference Evans, Mygind and Peddie16, Reference Lawrence59, Reference Lawrence62–64, Reference Bradbury, Williams and Mann66). Also, regulating and evaluating the amount of folic acid added to the permitted foods is needed with some urgency in NZ.
To our knowledge, the present study is the first in NZ to simulate the impact of different scenarios of food fortification with folic acid on the dietary intake of women from different ethnic groups in a generalizable birth cohort study(Reference Morton, Atatoa Carr and Grant22, Reference Morton, Ramke and Kinloch67). Therefore, we add important findings to the discussion around the development of a mandatory food fortification programme with folic acid. One potential limitation of the study is the use of a non-validated FFQ to evaluate maternal dietary folate intake during pregnancy. However, as previously described, the FFQ used included the main dietary sources of folate for pregnant women in NZ(Reference Evans, Mygind and Peddie16, 23, 28). It is also important to consider the potential sources of error in the estimated DFE intake due to the assumptions on portion sizes and DFE content of foods consumed. The FFQ food list lacked detailed information about food brands. However, we did use a country-specific food composition database with more than 2500 foods, where the majority of nutrient data is obtained by analysis of composite samples (76 %)(Reference Sivakumaran, Huffman and Sivakumaran68). Moreover, the individual quantitative data on DFE dietary intake have not been presented and all the analyses reported herein were based on classification of individuals according to their ranking of DFE intake.
Conclusion
The present study demonstrated that the current voluntary fortification of food with folic acid in NZ is not providing equal access to folate intake among its ethnically diverse population of women of childbearing age. The recent recommendation of mandatory fortification of breads in NZ may not be enough to reduce inequalities in DFE intakes. If the mandatory fortification with folic acid is extended for grains and rice in NZ, intakes of folate would be more evenly distributed among women of different ethnicities. Furthermore, there is an urgent need to regulate and evaluate the amount of folic acid added to the permitted foods.
Acknowledgements
Acknowledgements: The authors would like to acknowledge the participants of the GUiNZ study. They would also like to acknowledge the funders, the New Zealand Ministry of Social Development, supported by the Health Research Council, as well as the ongoing support from Auckland UniServices and The University of Auckland. They acknowledge all members of the GUiNZ team, including those members and managers of the operational, data, communications, community and quality aspects of the study. The authors are grateful for the ongoing support and advice provided by their Kaitiaki Group and their national and international Scientific Advisory Group, and also acknowledge the members of the Morton Consortium responsible for planning and design of this study in the Development Phase. Additionally, they acknowledge the São Paulo Research Foundation (FAPESP, Brazil) for supporting J.A.T. (grant number 2016/15356-3). Financial support: GUiNZ has been funded by the New Zealand Ministries of Social Development, Health, Education, Justice and Pacific Island Affairs; the former Ministry of Science Innovation and the former Department of Labour (now both part of the Ministry of Business, Innovation and Employment); the former Ministry of Women’s Affairs (now the Ministry for Women); the Department of Corrections; the Families Commission (now known as the Social Policy Evaluation and Research Unit); Te Puni Kokiri; New Zealand Police; Sport New Zealand; the Housing New Zealand Corporation; and the former Mental Health Commission, The University of Auckland and Auckland UniServices Limited. Other support for the study has been provided by the NZ Health Research Council, Statistics New Zealand, the Office of the Children’s Commissioner and the Office of Ethnic Affairs. J.A.T. is supported by FAPESP, Brazil (grant 2016/15356-3). The funding agencies had no role in the design, analysis or writing of this article. Conflict of interest: None. Authorship: S.M.B.M., C.C.G., C.R.W. and S.B. were involved in the conception and design of the study; J.A.T. conducted the data analysis; J.A.T., T.G.C., C.R.W., C.C.G. and D.M.M. contributed to interpretation of data and manuscript development. All authors participated in critically revising the manuscript and approved the final version. Ethics of human subject participation: This study was conducted according to the guidelines laid down in the Declaration of Helsinki and all procedures involving human subjects were approved by Ministry of Health Northern Y Regional Ethics Committee. Written informed consent was obtained from all participating women.
Supplementary material
To view supplementary material for this article, please visit https://doi.org/10.1017/S1368980018003026