


Young children have higher nutritional needs for growth and development, with increasing evidence supporting the importance of early-life nutrition on long-term health outcomes. The benefits of breast-feeding are unquestionable in the first 6 months of life; however, after weaning, dietary intake is not always optimal during the dietary transition period( Reference Picciano, Smiciklas-Wright and Birch 1 ). A lack of access to adequate nutritious foods may be a direct contributory factor in suboptimal dietary intake, but the latter may also be due to food neophobia (i.e. fear of trying new foods) and ‘picky/fussy’ eating behaviour( Reference Dovey, Staples and Gibson 2 ). Researchers have identified that children with food neophobia have limited dietary variety( Reference Falciglia, Couch and Gribble 3 ) and picky eaters consume fewer vegetables( Reference Galloway, Lee and Birch 4 ). Cow’s milk is one of the most commonly consumed and accepted food groups among young children, contributing the highest percentage of energy intake( Reference Fox, Reidy and Novak 5 , Reference Webb, Rutishauser and Knezevic 6 ).
Cow’s milk is a rich source of Ca, protein and fat; however, it is low in certain micronutrients important for growth and development, such as Fe. Fe deficiency is the most common micronutrient deficiency in the world( Reference Domellof, Braegger and Campoy 7 ). Cow’s milk is not only naturally low in Fe, but Ca has an inhibitory effect on Fe absorption. Young children are also at risk of deficiency of other nutrients such as vitamin D( Reference Grant, Wall and Crengle 8 , Reference Munns, Simm and Rodda 9 ) and n-3 essential fatty acids( Reference Meyer and Kolanu 10 , Reference Zhou, Gibson and Gibson 11 ), which are also low in cow’s milk. In addition to being a poor source of key nutrients, excessive consumption of cow’s milk may present other potential issues not conducive to optimal child growth, particularly the high protein content( Reference Michaelsen and Greer 12 ). Studies have shown a link between high protein intake in early childhood and increased body fat and risk for later obesity( Reference Gunther, Buyken and Kroke 13 , Reference Rolland-Cachera, Deheeger and Akrout 14 ). Childhood overweight and obesity is a serious global public health concern( 15 ).
Although consuming a balanced diet with a wide variety of nutritious foods is the best strategy to address nutrient deficiencies, unavailability of appropriate nutritious foods or fussy eating behaviours present a challenge to achieve optimal nutritional intake among young children. The WHO guidelines on improving infant and young child health and nutrition suggest using fortified foods when children are not achieving adequate nutrient intake from their diet( 16 ). Milk fortified with nutrients and/or with modified nutrient value is available and may be beneficial in meeting the nutrient requirements of some 1–3-year-old children( Reference Vandenplas, De Ronne and Van De Sompel 17 – Reference Walton and Flynn 19 ). Thus far, the effect of fortified milk has not been systematically investigated. The purpose of the current systematic review and meta-analysis was to investigate the effect of fortified milk products compared with control milk in young children’s growth and nutritional status outcomes, such as body size and composition, and/or biochemical markers.
Methods
The present systematic review was conducted in accordance with the guidelines of the Preferred Reporting Items of Systematic Reviews and Meta-analysis (PRISMA) statement( Reference Moher, Liberati and Tetzlaff 20 ).
Eligibility criteria
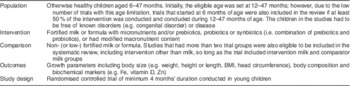
Studies had to meet the following criteria to be included in the current review: (i) population was otherwise healthy children aged 6–47 months; (ii) intervention was fortified milk; (iii) control was cow’s milk or non-/low-fortified milk; (iv) outcome was growth parameters and biochemical markers; and (v) study setting was a randomised controlled trial (RCT). Details are provided in Table 1.
Table 1 PICOS table
Search strategy
We carried out the systematic computerised literature search in June 2014, using five electronic databases: PubMed (1951–), Web of Science (1900–), Embase (1966–), CINAHL (1982–) and Cochrane Library (1996–). Only full original studies published in peer-reviewed journals in the English language, to minimise potential bias due to mistranslation, were selected. The search strategy incorporated the medical subject heading (MeSH) and the following search terms were used: (‘growing up milk’ OR ‘fortified milk’ OR ‘follow-on formula’) AND (NOT milk, human OR NOT ‘breast milk’) OR (probiotic*, prebiotic*, synbiotic*, symbiotic* AND milk) AND (child, preschool (MeSH) OR infant (MeSH) OR NOT infant, newborn (MeSH) AND growth). The term ‘follow-on formula’ was included because fortified milk for children older than 1 year of age can be referred to as ‘follow-on formula’. The ‘synbiotics’ are a combination of pre- and probiotics, which is sometimes spelt ‘symbiotic’. The term ‘infant’ was used as MeSH defines an infant as ‘a child between 1 and 23 months of age’. Further hand-searching was also conducted from the citations in studies that met the eligibility criteria. One reviewer conducted the systematic literature search. All articles that matched the search terms were transferred to EndNote X7 (Thomson Reuters) and duplicates were removed.
Study selection and data extraction
Two reviewers independently screened titles and selected articles to review abstracts. Full articles were also screened independently based on relevance to the study question and eligibility criteria. One reviewer extracted data from selected articles based on the following variables: (i) lead author and year of publication; (ii) the age of children and country of origin (geographical setting of study); (iii) type of RCT; (iv) sample size including the number and percentage of participants completing the study, the number of participants with blood results, the type of milk and the amount consumed for the intervention and control groups; (v) the length of the intervention; (vi) adherence check, exclusion criteria and attrition information; (vii) baseline characteristics; and (viii) outcomes that were pertinent to the systematic review. Reported ages and lengths of intervention were converted to months. For studies that did not report outcomes that could be synthesised in a meta-analysis, efforts were made to contact the authors to obtain the data; but if authors did not respond to two requests, or were unable to provide data, the article was excluded from meta-analysis. Three reviewers independently verified the extracted data. Meta-analysis was carried out under the guidance of a biostatistician. Risk of bias for individual articles was assessed using the modified Cochrane Collaboration’s tool for assessing risk of bias in randomised trials( Reference Higgins, Altman and Gotzsche 21 ) with additional items relevant to the current review. For single studies with multiple published articles reporting different outcomes measured, data were extracted separately and the quality was assessed for each article independently.
Meta-analysis
The differences in means for continuous outcomes were calculated from baseline and outcome measures at the end of intervention for outcomes reported in arithmetic mean and standard deviation. If the study featured more than two intervention groups (i.e. intervention milk, control milk and another group), the intervention milk and the comparator milk that were most relevant to the review question were analysed. For example, if the study had two comparators, cow’s milk or standard formula, then cow’s milk was chosen as the comparator in meta-analysis. If the study reported outcome measurements at multiple time points, the measurement taken at the end of the intervention period and the corresponding number of samples were used. If the differences in means and 95 % confidence intervals were reported instead of standard deviations, standard errors were calculated assuming normal distribution( Reference Bland 22 ). A pooled odds ratio was calculated for cases of anaemia at the end of the intervention period. Anaemia was determined by the number of cases reported in each study. If anaemia was reported as a percentage, it was converted to numbers using the sample size reported. For zero-cell correction, 0·5 was added to all cells. Subgroup analyses were conducted based on the study country’s economic status( 23 ), the intervention duration and the age of participants. Studies with I 2>0·40 were analysed using the inverse-variance random-effects model, and forest plots were produced to illustrate the results. A funnel plot was produced to determine risk of bias across studies. The statistical software package Stata SE 13.1 was used to conduct meta-analysis.
Results
Study selection
A total of 514 titles were identified from the electronic search, and, after screening titles and abstracts, thirty-six full articles were retrieved. After screening, fifteen articles met the eligibility criteria to be included in the current review. The detailed literature search process is illustrated in Fig. 1.
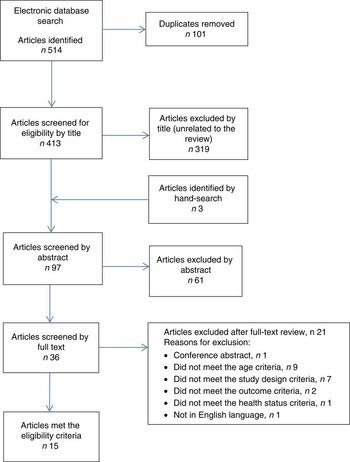
Fig. 1 (colour online) Flow diagram of the study selection process including the relevant number of papers at each stage and reasons for exclusion
Study characteristics
Fifteen articles based on twelve studies were included in the present systematic review( Reference Chatchatee, Lee and Carrilho 24 – Reference Sazawal, Dhingra and Hiremath 38 ) (Table 2). The articles by Szymlek-Gay et al.( Reference Szymlek-Gay, Ferguson and Heath 34 ), Morgan et al.( Reference Morgan, Heath and Szymlek-Gay 28 ) and Houghton et al.( Reference Houghton, Gray and Szymlek-Gay 27 ) were from a single study; and the articles by Morley et al.( Reference Morley, Abbott and Fairweather-Tait 29 ) and Singhal et al.( Reference Singhal, Morley and Abbott 32 ) were also from a single study. Participant age was reported as median or mean; the youngest participants at baseline were 6 months and the oldest were 31 months. Four articles based on three interventions( Reference Daly, MacDonald and Aukett 25 , Reference Morley, Abbott and Fairweather-Tait 29 , Reference Singhal, Morley and Abbott 32 , Reference Stevens and Nelson 33 ) enrolled children before 12 months of age and these interventions were from the UK. Length of intervention ranged from 4 to 12 months. In one study(26), although the intervention length was 12 months, measurements taken at 4 months after the commencement of intervention were reported. Sex ratio was almost equal (close to 50 %) in seven studies; however, in one study( Reference Virtanen, Svahn and Viinikka 36 ) the control group had a higher percentage of females (81 %). Four studies( Reference Daly, MacDonald and Aukett 25 , Reference Sazawal, Dhingra and Dhingra 31 , Reference Stevens and Nelson 33 , Reference Sazawal, Dhingra and Hiremath 38 ) did not report the distribution of sex. The geographical setting of the studies varied. Of these, studies from India( Reference Sazawal, Dhingra and Dhingra 31 , Reference Sazawal, Dhingra and Hiremath 38 ), Indonesia( Reference Firmansyah, Dwipoerwantoro and Kadim 26 ), Mexico( Reference Rivera, Shamah and Villalpando 30 , Reference Villalpando, Shamah and Rivera 35 ) and Vietnam( Reference Xuan, Wang and Grathwohl 37 ) were pooled as developing economies in subgroup analysis. Studies from New Zealand( Reference Houghton, Gray and Szymlek-Gay 27 , Reference Morgan, Heath and Szymlek-Gay 28 , Reference Szymlek-Gay, Ferguson and Heath 34 ), Sweden( Reference Virtanen, Svahn and Viinikka 36 ) and the UK( Reference Daly, MacDonald and Aukett 25 , Reference Morley, Abbott and Fairweather-Tait 29 , Reference Singhal, Morley and Abbott 32 , Reference Stevens and Nelson 33 ) were pooled as developed economies. One study( Reference Chatchatee, Lee and Carrilho 24 ) was set in multiple countries consisting of Malaysia, the Netherlands, Poland, Portugal and Thailand. The total sample size of studies at enrolment varied from n 54 to n 767. The most common fortificants were Fe and vitamin C, followed by Zn, essential fatty acids, vitamin D, and prebiotics, probiotics or synbiotics. The protein content of the milk was different between the intervention and control group in two studies, and the amount of milk consumed during the studies varied from 426 to 611 ml/d. The control milk varied from standard cow’s milk to no- or low-fortified ‘follow-on-formula’.
Table 2 Summary of articles included in the current systematic review, in alphabetical order of the first author
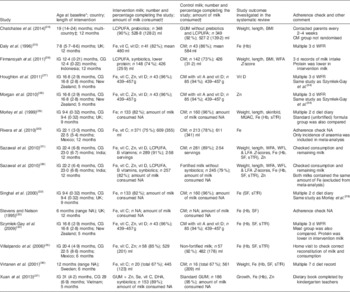
IG, intervention group; CG, control group; NA, not available or not reported; LCPUFA, long-chain PUFA; vit, vitamin; GUM, growing-up milk; CM, standard cow’s milk; WFA, weight-for-age; MUAC, mid-upper arm circumference; sTfR, serum transferrin receptor; WFL, weight-for-length; LFA, length-for-age; SF, serum ferritin; WFR, weighed food record.
* Age is reported as mean (sd) or median (range).
† Amount of milk is reported as mean (sd) or median (range).
‡ Malaysia, Holland, Poland, Portugal and Thailand.
Two studies were cluster RCT( Reference Rivera, Shamah and Villalpando 30 , Reference Xuan, Wang and Grathwohl 37 ), but both studies were adjusted for cluster effects; therefore, these studies were included in the meta-analysis. All studies were double-blinded for milk groups except for one study, where the control group already consumed standard cow’s milk prior to inclusion in the study and continued consuming this milk throughout the study( Reference Daly, MacDonald and Aukett 25 ). Types of Fe used for fortification were ferrous sulfate( Reference Sazawal, Dhingra and Dhingra 31 – Reference Stevens and Nelson 33 ), ferrous gluconate( Reference Villalpando, Shamah and Rivera 35 , Reference Virtanen, Svahn and Viinikka 36 ) and ferrous lactate( Reference Virtanen, Svahn and Viinikka 36 ); the remaining studies( Reference Daly, MacDonald and Aukett 25 , Reference Rivera, Shamah and Villalpando 30 , Reference Szymlek-Gay, Ferguson and Heath 34 , Reference Xuan, Wang and Grathwohl 37 , Reference Sazawal, Dhingra and Hiremath 38 ) did not specify the type of Fe used for fortification. Most studies collected dietary intake data including the consumption of milk, which in some cases was used as an adherence check to the study milk. Frequently cited exclusion criteria were cow’s milk intolerance or allergy, congenital abnormalities, cardiac and renal issues, using regular medication and/or supplementation, and severe anaemia. However, not all studies excluded children with anaemia at baseline. Two studies( Reference Sazawal, Dhingra and Dhingra 31 , Reference Sazawal, Dhingra and Hiremath 38 ) supplemented severely anaemic children with extra Fe for the first 3 months of the study in addition to their assigned milk. The operational definition of anaemia was not uniform, but mostly based on Hb concentration of <110 g/l.
Body size outcomes
Seven articles( Reference Chatchatee, Lee and Carrilho 24 , Reference Firmansyah, Dwipoerwantoro and Kadim 26 , Reference Morley, Abbott and Fairweather-Tait 29 , Reference Sazawal, Dhingra and Dhingra 31 , Reference Virtanen, Svahn and Viinikka 36 – Reference Sazawal, Dhingra and Hiremath 38 ) reported outcomes in weight (kg). Children in the intervention group had a statistically significant greater mean weight gain of 0·17 kg (95 % CI 0·02, 0·31 kg) compared with the control group at the end of the intervention (Fig. 2). Two of the studies from developing economies( Reference Firmansyah, Dwipoerwantoro and Kadim 26 , Reference Xuan, Wang and Grathwohl 37 ) reported average baseline weight-for-age Z-scores below zero. Studies based in India( Reference Sazawal, Dhingra and Dhingra 31 , Reference Sazawal, Dhingra and Hiremath 38 ) reported that 3·5–6·3 % of children had weight-for-age Z-score <–2, which is classified as ‘wasted’ based on the WHO growth reference. Subgroup analysis for studies from developing economies( Reference Firmansyah, Dwipoerwantoro and Kadim 26 , Reference Sazawal, Dhingra and Dhingra 31 , Reference Xuan, Wang and Grathwohl 37 , Reference Sazawal, Dhingra and Hiremath 38 ) of the difference in weight gain between the groups was 0·24 kg (95 % CI 0·02, 0·45 kg). Subgroup analysis for studies from developed economies was not conducted due to only having two studies reporting weight( Reference Morley, Abbott and Fairweather-Tait 29 , Reference Virtanen, Svahn and Viinikka 36 ). For studies with longer than 7 months’ duration( Reference Chatchatee, Lee and Carrilho 24 , Reference Morley, Abbott and Fairweather-Tait 29 , Reference Sazawal, Dhingra and Dhingra 31 , Reference Sazawal, Dhingra and Hiremath 38 ), the mean difference in weight gain in the intervention group compared with the control group was 0·15 kg (95 % CI 0·07, 0·23 kg), whereas for intervention length shorter than 7 months( Reference Firmansyah, Dwipoerwantoro and Kadim 26 , Reference Virtanen, Svahn and Viinikka 36 , Reference Xuan, Wang and Grathwohl 37 ) the mean difference was 0·22 kg (95 % CI −0·09, 0·53 kg). Subgroup analysis based on the age of participants was not conducted, as only one study( Reference Morley, Abbott and Fairweather-Tait 29 ) that started its intervention before 12 months of age reported body size outcomes.
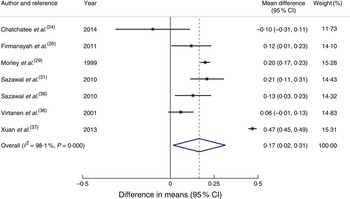
Fig. 2 (colour online) Forest plot: effect of fortified milk compared with control milk on mean difference in weight gain (kg) among 6–47-month-old children. The study-specific mean difference and 95 % CI are represented by the black dot and horizontal line, respectively; the area of the grey square is proportional to the specific-study weight to the overall meta-analysis. The centre of the open diamond/vertical dashed line represents the pooled mean difference and the width of the diamond represents the pooled 95 % CI. The solid vertical line represents no effect
Length or height (cm) was reported in six articles( Reference Chatchatee, Lee and Carrilho 24 , Reference Firmansyah, Dwipoerwantoro and Kadim 26 , Reference Morley, Abbott and Fairweather-Tait 29 , Reference Sazawal, Dhingra and Dhingra 31 , Reference Xuan, Wang and Grathwohl 37 , Reference Sazawal, Dhingra and Hiremath 38 ). However, the difference between the intervention group and control group in length or height gain from these articles, including subgroup analyses, did not reach statistical significance. Head circumference was reported in only two studies( Reference Firmansyah, Dwipoerwantoro and Kadim 26 , Reference Morley, Abbott and Fairweather-Tait 29 ); therefore, results were unable to be pooled for meta-analysis.
BMI was reported in three articles( Reference Chatchatee, Lee and Carrilho 24 , Reference Firmansyah, Dwipoerwantoro and Kadim 26 , Reference Xuan, Wang and Grathwohl 37 ). One article( Reference Chatchatee, Lee and Carrilho 24 ) reported that BMI was not statistically significant between the intervention and control groups. Another article( Reference Firmansyah, Dwipoerwantoro and Kadim 26 ) reported that BMI was slightly higher in the intervention group compared with the control group when the measurements were taken at 4 months after the study commenced. The third article( Reference Xuan, Wang and Grathwohl 37 ) reported that BMI among the intervention group remained normal for age compared with the control group, based on WHO reference data( 39 ).
Weight-for-age Z-scores were reported in four articles( Reference Firmansyah, Dwipoerwantoro and Kadim 26 , Reference Sazawal, Dhingra and Dhingra 31 , Reference Xuan, Wang and Grathwohl 37 , Reference Sazawal, Dhingra and Hiremath 38 ) and height- or length-for-age Z-scores were reported in three articles( Reference Sazawal, Dhingra and Dhingra 31 , Reference Xuan, Wang and Grathwohl 37 , Reference Sazawal, Dhingra and Hiremath 38 ). A study set in Indonesia( Reference Firmansyah, Dwipoerwantoro and Kadim 26 ) identified that among the intervention group, the change in weight-for-age Z-score from 12 months (baseline) to 16 months was in line with the WHO growth reference( 39 ). Two articles were based on studies conducted simultaneously in India( Reference Sazawal, Dhingra and Dhingra 31 , Reference Sazawal, Dhingra and Hiremath 38 ). In one of these studies( Reference Sazawal, Dhingra and Dhingra 31 ), where the intervention group received micronutrient-fortified milk and the control group received standard cow’s milk, it was shown that weight-for-height, weight-for-age and height-for-age Z-scores were significantly improved in the intervention group. In the other study( Reference Sazawal, Dhingra and Hiremath 38 ), both intervention and control groups received milk fortified with the same added micronutrient contents including Fe, but the intervention milk had added synbiotics; probiotic Bifidobacterium lactis HN019 DR 10, as well as prebiotic oligosaccharides. In that study, the authors did not find a significant difference in the change in Z-scores between the intervention and control groups from baseline to end of the study. However, weight velocity was greater in children in the intervention group receiving milk with added synbiotics compared with children in the control group( Reference Sazawal, Dhingra and Hiremath 38 ). Another study( Reference Xuan, Wang and Grathwohl 37 ), which investigated the effect of milk fortified with synbiotics compared with milk without synbiotics, showed statistically significant differences between intervention and control groups for weight-for-age Z-scores (P<0·001) and length-for-age Z-scores (P<0·001), despite a short intervention duration of 5 months.
Body composition outcomes
Only one article( Reference Morley, Abbott and Fairweather-Tait 29 ) reported anthropometry-derived body composition using mid-upper arm circumference and skinfold thickness. That study did not find any significant differences in body composition between the fortified milk group and the cow’s milk group.
Biochemical marker outcomes – iron
Fe was the most investigated biochemical marker. Nine articles reported changes in Hb concentration (g/l) from baseline( Reference Daly, MacDonald and Aukett 25 , Reference Morley, Abbott and Fairweather-Tait 29 , Reference Sazawal, Dhingra and Dhingra 31 , Reference Stevens and Nelson 33 – Reference Sazawal, Dhingra and Hiremath 38 ). One article( Reference Sazawal, Dhingra and Hiremath 38 ) was omitted from meta-analysis for biochemical markers of Fe status because both the intervention milk and the control milk in the study were fortified with the same amount of Fe (approximately 5·4 mg/d). Although the result did not reach statistical significance, the mean increase of Hb concentration in the intervention group compared with the control group was 5·89 g/l (95 % CI −0·24, 12·02 g/l; P=0·06).
Serum ferritin and transferrin receptor concentrations were also reported, but because some of these values were reported as geometric mean( Reference Singhal, Morley and Abbott 32 , Reference Szymlek-Gay, Ferguson and Heath 34 , Reference Virtanen, Svahn and Viinikka 36 ) or median( Reference Stevens and Nelson 33 ), or did not measure baseline values( Reference Singhal, Morley and Abbott 32 ), it was not possible to pool these results to calculate mean differences. Outcomes for serum ferritin levels and serum transferrin levels were inconsistent. Two articles reported an increase in serum ferritin levels among the fortified milk groups( Reference Sazawal, Dhingra and Dhingra 31 , Reference Szymlek-Gay, Ferguson and Heath 34 ), whereas two other articles( Reference Villalpando, Shamah and Rivera 35 , Reference Virtanen, Svahn and Viinikka 36 ) did not show a statistically significant difference between groups, albeit trends were apparent in one article( Reference Virtanen, Svahn and Viinikka 36 ) for an increase in serum ferritin (P=0·06) and decreased ratio of serum transferrin receptor to ferritin (P=0·05) in the fortified milk group. One article( Reference Stevens and Nelson 33 ) did not identify differences in median ferritin levels between the two groups. The intervention milk compared with the control milk had no effect on serum transferrin receptor concentration in two articles( Reference Szymlek-Gay, Ferguson and Heath 34 , Reference Virtanen, Svahn and Viinikka 36 ), but it was reduced in two articles( Reference Sazawal, Dhingra and Dhingra 31 , Reference Villalpando, Shamah and Rivera 35 ). One article( Reference Singhal, Morley and Abbott 32 ) did not report a baseline measure, but found higher serum ferritin levels among the fortified milk group, although there was no difference in serum transferrin receptor values.
Nine articles( Reference Daly, MacDonald and Aukett 25 , Reference Morley, Abbott and Fairweather-Tait 29 , Reference Rivera, Shamah and Villalpando 30 , Reference Sazawal, Dhingra and Dhingra 31 , Reference Stevens and Nelson 33 – Reference Xuan, Wang and Grathwohl 37 ) reporting cases of anaemia at the end of the intervention were pooled to calculate an odds ratio. The risk of anaemia was reduced significantly among the intervention group compared with the control group (OR=0·32; 95 % CI 0·15, 0·66; Fig. 3). Odds of anaemia among the intervention group compared with the control group in the subgroup analysis of developing economies( Reference Rivera, Shamah and Villalpando 30 , Reference Sazawal, Dhingra and Dhingra 31 , Reference Villalpando, Shamah and Rivera 35 , Reference Xuan, Wang and Grathwohl 37 ) was 0·36 (95 % CI 0·14, 0·91) and for interventions longer than 7 months( Reference Daly, MacDonald and Aukett 25 , Reference Morley, Abbott and Fairweather-Tait 29 , Reference Rivera, Shamah and Villalpando 30 , Reference Sazawal, Dhingra and Dhingra 31 , Reference Szymlek-Gay, Ferguson and Heath 34 ) was 0·17 (95 % 0·09, 0·33). The odds for interventions less than 7 months’ duration or studies conducted in developed economies did not reach statistical significance. To investigate the effect of age, removing three studies which started the study before 12 months of age( Reference Daly, MacDonald and Aukett 25 , Reference Morley, Abbott and Fairweather-Tait 29 , Reference Stevens and Nelson 33 ) resulted in an OR of 0·46 (95 % CI 0·19, 1·12).
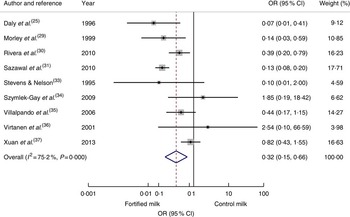
Fig. 3 (colour online) Forest plot: odds of anaemia with fortified milk compared with control milk among 6–47-month-old children. The study-specific OR and 95 % CI are represented by the black dot and horizontal line, respectively; the area of the grey square is proportional to the specific-study weight to the overall meta-analysis. The centre of the open diamond/vertical dashed line represents the pooled OR difference and the width of the diamond represents the pooled 95 % CI. The solid vertical line represents no effect
Body Fe was investigated in one study( Reference Szymlek-Gay, Ferguson and Heath 34 ), which was higher in the fortified milk group compared with the control group. Other markers of Fe status such as Zn protoporphyrin, haematocrit and red-cell distribution width were investigated in one study( Reference Sazawal, Dhingra and Dhingra 31 ); these authors reported improvements in these markers among the fortified milk group. Mean corpuscular volume was investigated in two studies( Reference Daly, MacDonald and Aukett 25 , Reference Virtanen, Svahn and Viinikka 36 ). One study showed significant improvements in the fortified milk group( Reference Daly, MacDonald and Aukett 25 ), but no difference was found in the other study( Reference Virtanen, Svahn and Viinikka 36 ).
Other outcomes
Serum Zn was investigated in five articles( Reference Morgan, Heath and Szymlek-Gay 28 , Reference Sazawal, Dhingra and Dhingra 31 , Reference Villalpando, Shamah and Rivera 35 , Reference Xuan, Wang and Grathwohl 37 , Reference Sazawal, Dhingra and Hiremath 38 ). None of these studies identified a statistically significant change in serum Zn concentration as a result of feeding Zn-fortified milk. Vitamin D was investigated in one study set in New Zealand; however, both the intervention and control milks were fortified with vitamin D( Reference Houghton, Gray and Szymlek-Gay 27 ). That study also had a red meat intervention group and compared with this group, both milk groups increased mean serum 25-hydroxyvitamin D concentration.
Risk of bias
The risk of bias within studies is shown in Table 3. More than half of the articles described the method of allocation sequence generation. It was not practicable to double-blind all participants in every study. Most studies addressed incomplete outcome data, but two articles did not state the exclusion criteria( Reference Rivera, Shamah and Villalpando 30 , Reference Villalpando, Shamah and Rivera 35 ) and two did not provide attrition details( Reference Houghton, Gray and Szymlek-Gay 27 , Reference Singhal, Morley and Abbott 32 ). All articles reported primary and secondary outcomes. The studies were also reviewed for publication bias. Most studies reported any baseline imbalance between groups. Four articles (two studies)( Reference Houghton, Gray and Szymlek-Gay 27 , Reference Morgan, Heath and Szymlek-Gay 28 , Reference Rivera, Shamah and Villalpando 30 , Reference Szymlek-Gay, Ferguson and Heath 34 ) had imbalance in the number of participants in the intervention and control group. Three studies had potential baseline imbalances, i.e. weight and length( Reference Chatchatee, Lee and Carrilho 24 ), biochemical status( Reference Morgan, Heath and Szymlek-Gay 28 , Reference Virtanen, Svahn and Viinikka 36 ), but none were deemed sufficiently extreme to have impacted the study outcome significantly. Only two articles clearly stated that the determined sample size was met( Reference Chatchatee, Lee and Carrilho 24 , Reference Singhal, Morley and Abbott 32 ). Risk of bias across studies was investigated by producing a funnel plot from the odds ratio of anaemia at the end of intervention; the funnel plot showed symmetry, indicating minimal publication bias (data not shown).
Table 3 Risk of bias within studies using the modified Cochrane Collaboration’s tool for assessing risk of bias in randomised trials
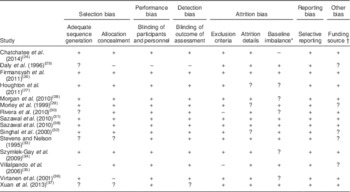
+, low risk; −, high risk or not reported; ?, unclear/unsure.
* Baseline imbalance includes the number in each group and other imbalances between groups.
† If author/s declared that they have no conflict of interest, the article is deemed free of funding source bias.
Sensitivity analysis
Sensitivity analysis was conducted for studies that were deemed as low risk of bias, fulfilling more than five out of six of the Cochrane quality assessment criteria. Among the studies considered low risk of bias( Reference Chatchatee, Lee and Carrilho 24 , Reference Firmansyah, Dwipoerwantoro and Kadim 26 , Reference Sazawal, Dhingra and Dhingra 31 , Reference Sazawal, Dhingra and Hiremath 38 ), the mean weight gain among the intervention group compared with the control group was 0·12 kg (95 % CI 0·03, 0·21 kg), but an increase in height was not statistically significant. In studies that reported biomarkers of Fe, two articles were deemed as low risk of bias( Reference Sazawal, Dhingra and Dhingra 31 , Reference Szymlek-Gay, Ferguson and Heath 34 ), but it was not feasible to produce meta-analysis with two articles.
Discussion
The present systematic review investigated the effect of fortified milk compared with control milk on the growth and nutritional status of young children. Even though the included studies displayed substantial statistical heterogeneity, we identified some trends in growth parameters and biochemical markers among children in the intervention group.
The overall effect of fortified milk on weight and height gain among children in the intervention groups compared with control groups was minimal, suggesting fortified milk does not adversely affect growth. Importantly, evidence presented here suggests that fortified milk does not promote rapid growth or weight gain, which is known to be associated with later overweight and obesity(40). Growth outcomes were slightly higher in studies conducted in developing economies, possibly because these children generally experience compromised growth and development due to dietary inadequacy( Reference Lunn 41 ). In these countries, milk fortification is often part of a public health intervention programme; indeed, four articles included in the current review were evaluating such programmes( Reference Rivera, Shamah and Villalpando 30 , Reference Sazawal, Dhingra and Dhingra 31 , Reference Villalpando, Shamah and Rivera 35 , Reference Sazawal, Dhingra and Hiremath 38 ).
Developing countries in Asia account for more than half of the total stunted children in the world( Reference Black, Allen and Bhutta 42 ). Studies from Asia included in the current review identified that fortified milk may be contributing to normal growth potential in young children( Reference Firmansyah, Dwipoerwantoro and Kadim 26 , Reference Sazawal, Dhingra and Dhingra 31 , Reference Sazawal, Dhingra and Hiremath 38 ). Stunting in childhood is associated with impaired health and long-term cognitive development, and therefore is one of the major public health priorities( Reference Dewey and Begum 43 ). Further, in the Indian study( Reference Sazawal, Dhingra and Hiremath 38 ), the intervention group receiving milk with added synbiotics had greater weight gain and weight velocity. The authors suggest that this may be due to reduced incidence of gastrointestinal disorders or improved nutrient absorption through regeneration of gut epithelium as a result of improved gut microbiota profiles. The role of gut microbiota in immune system development is well established( Reference Kamada and Nunez 44 ) and nutritional status is closely associated with immune function. Two other Asian studies( Reference Firmansyah, Dwipoerwantoro and Kadim 26 , Reference Xuan, Wang and Grathwohl 37 ) investigating the effect of milk fortified with synbiotics were based on the premise that synbiotics support immune function leading to improved health, thereby promoting normal growth in young children. These studies also observed statistically significant weight gain among the intervention group receiving milk fortified with synbiotics. However, as the role of probiotics is strain- and species-specific, effectiveness of probiotics on growth outcomes cannot be generalised from results of these studies alone.
The reviewed studies indicate that children consuming milk fortified with Fe had improved Fe status, even though milk is consumed only as part of a whole diet in young children. Fe deficiency is prevalent among young children, not only in developing economies but also in developed economies( Reference Uijterschout, Vloemans and Vos 45 – Reference Looker, Dallman and Carroll 47 ). In developing economies, food fortification is one of many strategies used to address undernutrition. Supplementation programmes have proven effective to address micronutrient deficiencies in developing economies; however, adverse effects of supplementation with Fe tablets have been reported in regions with high prevalence of malaria( Reference Sazawal, Black and Ramsan 48 ). Therefore, milk fortified with Fe and other micronutrients may be a safer alternative for addressing nutrient deficiencies with less risk of overdose and, to date, there has not been any report of serious adverse effects of fortified milk( Reference Vandenplas, De Ronne and Van De Sompel 17 ).
A recent Australian study on Fe intake identified a lack of adequate Fe-rich complementary foods consumed among young children( Reference Atkins, McNaughton and Campbell 49 ). Efforts to raise public awareness of the importance of Fe-rich complementary foods are essential. However, availability of such foods is scarce in developing economies. Furthermore, the New Zealand study( Reference Houghton, Gray and Szymlek-Gay 27 , Reference Morgan, Heath and Szymlek-Gay 28 , Reference Szymlek-Gay, Ferguson and Heath 34 ) reviewed here included an intervention group receiving red meat; however, groups receiving milk had a significantly higher compliance rate compared with the meat group. The adherence rates to intervention were 81·4 and 89·4 % for the milk groups, whereas only 3·4 % of the meat group consumed the recommended two study meat dishes per day. These results highlight potential difficulties in achieving desirable Fe intake from normal diet alone during the transition period for some children. In addition, a US-based study identified that fortified foods and drinks are major contributors to nutrient intakes of US children and adolescents( Reference Berner, Keast and Bailey 50 ). Together, evidence presented here supports the effectiveness of fortified milk under certain circumstances.
Limitations
The present systematic review and meta-analysis provided robust evaluation of RCT investigating the effect of fortified milk in diverse settings, but there are several limitations. The included studies were heterogeneous and, therefore, it is difficult to determine the effective level or combination of fortification. A general trend in positive outcomes for serum Fe markers is in line with two previous systematic reviews and meta-analyses of fortified foods, including milk, in young children( Reference Eichler, Wieser and Ruthemann 51 , Reference Athe, Rao and Nair 52 ). Inclusion of RCT published in the English language only may have introduced bias.
Despite the benefit of reduction in anaemia, fortified milk costs more than regular milk. However, Fe-deficiency anaemia remains the leading cause of years lived with disability among children and adolescents( Reference Kyu, Pinho and Wagner 53 ). To date, there has not been any economic evaluation conducted specifically for using fortified milk in anaemia reduction. Plessow et al.( Reference Plessow, Arora and Brunner 54 ) evaluated the cost-effectiveness of fortified cereal to reduce Fe-deficiency anaemia in 6–23-month-old children in India, and identified that fortified cereal is cost-effective to reduce the social costs of Fe-deficiency anaemia even if it is heavily subsidised. A review of various Fe fortification programmes in Brazil also demonstrated that the use of fortified milk was twenty-five times more cost-effective considering the estimated mean productivity loss due to Fe-deficiency anaemia( Reference Beinner and Lamounier 55 ).
Young children are consuming milk as part of a whole diet; it is difficult to determine whether improved growth and nutritional outcomes were specifically due to fortified milk or other factors such as dietary intake. However, studies that investigated dietary intake reported no differences between the intervention and control groups in dietary intake( Reference Chatchatee, Lee and Carrilho 24 , Reference Daly, MacDonald and Aukett 25 , Reference Houghton, Gray and Szymlek-Gay 27 – Reference Morley, Abbott and Fairweather-Tait 29 , Reference Singhal, Morley and Abbott 32 , Reference Stevens and Nelson 33 , Reference Szymlek-Gay, Ferguson and Heath 34 , Reference Virtanen, Svahn and Viinikka 36 ), suggesting the only point of difference between the groups was fortified milk consumption. Due to a limited number of studies, it was not possible to fully evaluate the effect on milk fortification of other key nutrients such as vitamin D in the current systematic review. However, observational studies have also identified improved nutrient intakes, including Fe and vitamin D, from fortified milk( Reference Walton and Flynn 19 , Reference Ghisolfi, Vidailhet and Fantino 56 , Reference Sidnell, Pigat and Gibson 57 ). In diet-related trials, compliance and leakage can be an issue, and compliance is often based on self-reports. These are common issues experienced in any trial, including studies included in the present review, which may have impacted the observed results. None of the studies included in the review were longer than 12 months in duration. Longer-term follow-up is important to assess other health, clinical and functional outcomes of using the fortified milk products.
Implications for future research and practice
There is an association between cow’s milk consumption and diminishing Fe stores among infants and young children( Reference Ziegler 58 ). In the UK-based studies included in the current systematic review( Reference Daly, MacDonald and Aukett 25 , Reference Morley, Abbott and Fairweather-Tait 29 , Reference Singhal, Morley and Abbott 32 , Reference Stevens and Nelson 33 ), children in the control group were receiving cow’s milk before 12 months of age. Removing these studies resulted in an attenuated result of anaemia reduction. A recent systematic review has identified that infants consuming cow’s milk have a higher risk of Fe-deficiency anaemia compared with those consuming Fe-fortified formula milk( Reference Griebler, Bruckmuller and Kien 59 ). These results highlight the importance of establishing clear recommendations regarding not giving cow’s milk as the main source of drink before 12 months of age and avoiding excessive consumption of cow’s milk after 12 months of age.
A growing body of evidence is indicating that higher protein consumption in early life is associated with increased risk of overweight later in life( Reference Gunther, Buyken and Kroke 13 , Reference Rolland-Cachera, Deheeger and Akrout 14 , Reference Ohlund, Hernell and Hornell 60 ). Only four articles (two studies)( Reference Firmansyah, Dwipoerwantoro and Kadim 26 – Reference Morgan, Heath and Szymlek-Gay 28 , Reference Szymlek-Gay, Ferguson and Heath 34 ) included in the current systematic review used intervention milk with a distinctively lower protein content compared with cow’s milk, but none of these studies assessed body composition. Future trials using more sophisticated laboratory-based body composition assessment methods, such as dual-energy X-ray absorptiometry, may provide more accurate measures of potential differences in body composition between children consuming different types of milk. Recently, a panel of experts in early nutrition developed a recommendation on the composition of fortified follow-up formula for young children based on common deficiencies, to be adapted in each country( Reference Suthutvoravut, Abiodun and Chomtho 18 ). This recommendation may assist in developing fortified milk that is more uniform in composition, based on scientific evidence.
The role of the human gut microbiota in health has been the subject of considerable scientific interest and research. Diet, by far, is the most important factor that influences the gut microbiota population. Prebiotics, probiotics, or in combination as synbiotics, are used as strategies to improve the composition of the gut microbiota. Fortifying milk with synbiotics in the studies included in the present review was based on the understanding of the interrelationship between gastrointestinal function, the immune system and nutritional status, which ultimately affects growth in children. Although an increasing amount of research is indicating that gut microbiota development is proceeding until about 3 years of age or even longer( Reference Agans, Rigsbee and Kenche 61 , Reference Ringel-Kulka, Cheng and Ringel 62 ), there is still a paucity of research on gut microbiota development beyond the first year of life. The function of milk containing prebiotics and/or probiotics for young children over 12 months of age should, therefore, be further investigated, together with close monitoring of the potential effect on the gut microbial profile, health and growth outcomes, and dietary intake analysis.
The present systematic review and meta-analysis identified that consuming fortified milk can improve certain aspects of nutritional status, particularly Fe, in young children. Considering that Fe deficiency is the most common nutrient deficiency among children in the world, it is an important public health concern to be addressed. Undoubtedly, if children are consuming a balanced and varied diet, fortified milk is not necessary. However, when adequate nutritious complementary foods are unavailable or fussy eating behaviour is prevalent during dietary transition, children may not be meeting nutritional requirements for optimal growth and development. Under such circumstances, fortified milk may be a safe, acceptable and effective source of complementary nutrition to supplement those children in need, when consumed in appropriate amounts in addition to a normal diet, until a better dietary habit can be established. New recommendations on the composition of fortified milk for children over 12 months of age are now available, and further well-designed RCT incorporating follow-up beyond 12 months of duration are warranted to investigate the benefit of fortified milk on growth and nutritional outcomes in young children.
Acknowledgements
Financial support: This research received no specific grant from any funding agency in the public, commercial or not-for-profit sectors. M.M. is supported by the Australian Government Post Graduate Award Scholarship. R.J.H. is partially funded by Danone Nutricia. Conflict of interest: The authors declare that they have no conflict of interest. Authorship: M.M. designed the study and wrote the manuscript. M.M. conducted the electronic database search and extracted titles, abstracts and articles. M.M. and T.H. screened and selected articles. M.M. extracted data. T.H. and R.J.H. verified the extracted data. M.M. conducted meta-analyses and M.D. provided biostatistics support. T.H., M.D., R.J.H. and P.S.W.D. read and commented on the manuscript. All authors read and approved the final manuscript. Ethics of human subject participation: Not applicable.


