


Among non-communicable diseases, CVD are the most common accounting for the largest fraction of deaths( Reference Dugani and Gaziano 1 ). More than 17·3 million CVD-related deaths were reported in 2013, which represented a 41% increase over the prior three decades( Reference Roth, Forouzanfar and Moran 2 ). It should be noted that these deaths occur before the age of 60 years, resulting in substantial costs due to loss of human resources( Reference Bloom, Cafiero and Jané-Llopis 3 ). Therefore, primary and secondary prevention of CVD are very important to reducing CVD morbidity and even mortality.
Different lifestyle-related risk factors have been suggested to be related to CVD incidence and mortality( Reference Kim, Adamson and Ebrahim 4 ). Among these risk factors, diet is a critical one( Reference Sotos-Prieto, Bhupathiraju and Mattei 5 ). Studies have shown that adherence to a Western dietary pattern compared with a traditional diet will increase the risk of CVD events( Reference Mirmiran, Bahadoran and Vakili 6 ). In addition, a large number of studies have found that high dietary Na intake causes an increase in blood pressure that in turn may be associated with increases in CVD and all-cause mortality( Reference He and Whelton 7 , 8 ). A meta-analysis of prospective studies showed that high salt intake was associated with increased risks of stroke and CVD( Reference Strazzullo, D’Elia and Kandala 9 ). However, some studies failed to find such significant association between dietary Na intake and all-cause or cause-specific mortality( Reference Perry and Beevers 10 , Reference Cohen, Hailpern and Alderman 11 ). Another meta-analysis in 2012 showed serious conflicting results among observational studies linking Na intake to CVD events( Reference Alderman and Cohen 12 ). Although Graudal claimed that there is a ‘U-shaped’ association between dietary Na intake and CVD mortality( Reference Graudal 13 ), a letter by Whelton and Appel rejected this hypothesis( Reference Whelton and Appel 14 ).
High Na intake has been strongly associated with different health problems( Reference Steffen 15 , Reference Yakoob, Micha and Khatibzadeh 16 ). However, as mentioned above, there are major controversies over studies investigating the association of Na intake with all-cause and CVD mortality. In addition, to the best of our knowledge, the exact threshold dose of Na intake to decrease risk of all-cause and CVD events has still not been established. Establishment of this threshold is a health priority and would help to improve available guidelines. Given these reasons, the current systematic review and meta-analysis was done to investigate, for the first time, a dose–response association of dietary Na intake with all-cause and cardiovascular mortality among prospective studies published up to August 2017.
Methods
Search strategy
The present systematic review and meta-analysis of studies was done according to the PRISMA (Preferred Reporting Items for Systematic Reviews and Meta-Analyses) guidelines( Reference Moher, Liberati and Tetzlaff 17 ). Eligible studies published up to August 2017 were searched in MEDLINE, EMBASE and Google Scholar databases using combinations of the following keywords: ((sodium chloride[mesh] OR sodium chloride[tiab] OR sodium chloride, dietary[mesh] OR salt[tiab] OR sodium, dietary[mesh] OR sodium[tiab]) AND (cardiovascular diseases[mesh] OR cardiovascular disease*[tiab] OR CVD[tiab] OR all-cause[tiab]) AND (mortality[mesh] OR mortality[tiab] OR death[mesh] OR death[tiab])). The search strategy was limited to studies on human subjects which were published in the English language. We also hand-searched reference lists of the relevant publications to include additional studies.
Eligibility criteria
Publications were selected according to the following inclusion criteria: population age ≥18 years; categorized Na intake (at least three categories) for non-linear association as well as continuous intake of Na for linear association; reported number of participants in each Na intake category; reported all deaths or/and CVD death numbers in total population and in each Na intake category; and calculated the hazard ratio (HR) or relative risk (RR) with 95 % CI of all-cause or/and CVD mortality in each category. Exclusion criteria were: randomized clinical trials, cross-over, cross-sectional and review studies, letters, comments; non-English language articles; in vitro or animal studies; studies on pregnant women; studies on patients with renal diseases, heart failure, cancers, liver diseases, hypertension, cystic fibrosis and chronic obstructive pulmonary disease; studies in which patients used surgery, drug therapy, transplantation or other physical treatments; and studies that reported only serum Na concentrations.
Study selection
Two reviewers independently evaluated titles and abstracts of publications retrieved in the initial search for relevance. Publications which did not meet the eligibility criteria based on study design, population or exposure and outcome were excluded using a screen form. Then, full texts of the candidate relevant articles were retrieved and evaluated again for relevance by the same reviewers. Any disagreements between reviewers were discussed and resolved by the third reviewer (S.S.-B.).
Data extraction
The following data were extracted from all included publications: study title; study authors; country; year of publication; journal name; study population; participants’ sex; follow-up duration; Na intake categories as well as number of cases; mean Na intake; mean age; total number of deaths; crude and adjusted HR/RR for all-cause mortality as well as crude and adjusted HR/RR for CVD mortality in each category of Na intake; and adjustments made.
Statistical analysis
All statistical analyses were conducted using the statistical software package Stata version 14. We selected studies in which the HR/RR were reported for all-cause or/and CVD mortality across categories of Na intake. A dose-dependent meta-analysis using the method proposed by Greenland and Longnecker( Reference Greenland and Longnecker 18 ) and Orsini et al.( Reference Orsini, Bellocco and Greenland 19 ) was used to compute the trend from the correlated log HR/RR estimates across Na intake categories. The midpoint of the Na intake category was considered as the corresponding HR/RR estimate. We assumed the open-ended categories to be the same width as the neighbouring categories. A two-stage random-effects dose–response meta-analysis was used to investigate a probable non-linear relationship between dietary Na intake and risk of all-cause and CVD mortality. This was conducted using Na intake modelling and restricted cubic splines with three knots at fixed percentiles of 10, 50 and 90 % of the distribution( Reference Harre, Lee and Pollock 20 ). As described by Orsini et al, a restricted cubic spline model was calculated using generalized least-squares regression accounting for the correlation within each set of published HR/RR( Reference Orsini, Bellocco and Greenland 19 ). Then, we combined the study-specific estimates using the restricted maximum likelihood method in a multivariate random-effects meta-analysis( Reference Jackson, White and Thompson 21 ). A probability value for non-linearity was estimated using null hypothesis testing in which the coefficient of the second spline was considered equal to 0. A linear dose–response relationship between 100mg/d increments in Na intake with CVD and all-cause mortality was estimated using the generalized least-squares trend estimation( Reference Greenland and Longnecker 18 , Reference Orsini, Bellocco and Greenland 19 , Reference Berlin, Longnecker and Greenland 22 ). We used the two-stage generalized least-squares trend estimation method. To obtain an overall average slope, the study-specific slope lines were estimated and then combined with studies in which the slopes were directly reported( Reference Orsini, Bellocco and Greenland 19 ). Study-specific results were combined using a random-effects model. Studies in which the risk was estimated per any unit increment in Na intake were also included. Cochran’s Q test and the I 2 statistic were used to assess statistical heterogeneity between the recruited studies( Reference Higgins and Thompson 23 ). I 2 values less than 30 % were considered as no or marginal heterogeneity, between 30 and 75 % as mild heterogeneity, and ≥75 % as notable between-study heterogeneity. In addition, publication bias was examined using Egger regression( Reference Egger, Smith and Schneider 24 ). Furthermore, the methodological quality of included studies was assessed using the Newcastle–Ottawa Scale adapted for cohort studies. Studies with at least six stars were considered high quality and the rest as low quality.
Results
Study selection and characteristics of included studies
Overall, twenty-one publications were included in the current systematic review( Reference Cohen, Hailpern and Alderman 11 , Reference Umesawa, Iso and Date 25 – Reference Gardener, Rundek and Wright 44 ). The flow diagram of study selection is presented in Fig. 1. In total, 4084 potentially relevant publications were identified through the initial search. After screening based on title and abstract, 195 publications were candidates for more detailed evaluation. Of those, review studies (n 25), randomized clinical trials (n 6), non-English language articles (n 11), studies in which only serum Na concentration (n 81) was reported and those lacking mortality data (n 51) were excluded.
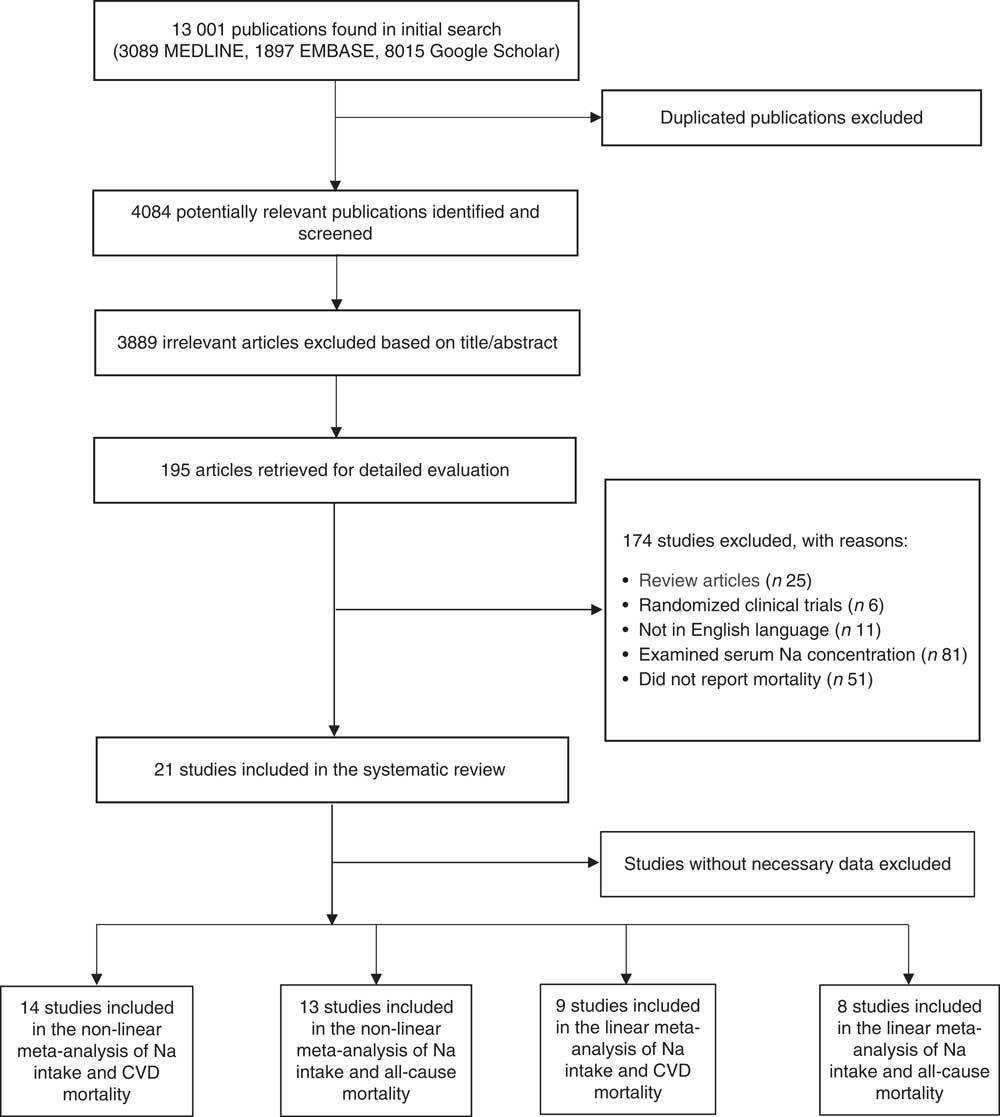
Fig. 1 Flow diagram of study selection for the present systematic review and meta-analysis of prospective studies on the association of dietary sodium intake with all-cause and cardiovascular mortality
All included studies were prospective cohort studies published between 1998 and 2017. Duration of follow-up of the included cohorts was between 1·02 and 20 years. In total, 222189 participants (aged 40·9–74·6 years) were enrolled in the studies. The characteristics of the studies are summarized in Table 1. Among the included studies, nine studies were done in the USA( Reference Cohen, Hailpern and Alderman 11 , Reference Cook, Appel and Whelton 26 , Reference He, Ogden and Vupputuri 28 , Reference Kalogeropoulos, Georgiopoulou and Murphy 31 , Reference Singer, Cohen and Alderman 33 – Reference Cohen, Hailpern and Fang 36 , Reference Gardener, Rundek and Wright 44 ), four in Japan( Reference Umesawa, Iso and Date 25 , Reference Horikawa, Yoshimura and Kamada 29 , Reference Ikehara, Iso and Date 30 , Reference Nagata, Takatsuka and Shimizu 41 ) and the rest in Canada( Reference O’Donnell, Yusuf and Mente 32 ), the Netherlands( Reference Geleijnse, Witteman and Stijnen 27 ), Belgium( Reference Stolarz-Skrzypek, Kuznetsova and Thijs 40 ), China( Reference Dong, Li and Yang 37 ), France( Reference Saulnier, Gand and Ragot 38 ), Finland( Reference Tuomilehto, Jousilahti and Rastenyte 39 ), Brazil( Reference Costa, de Paula and Carvalho 43 ) and Australia( Reference Ekinci, Clarke and Thomas 42 ). In total, 20270 patients died due to all causes in the studies, while 13806 deaths were due to CVD. Mean Na intake was 3749·03mg/d (range: 1035–9400mg/d) among the participants. All studies were done on both sexes. Na intake was assessed using 24h urinary Na excretion in eight studies( Reference Cook, Appel and Whelton 26 , Reference Geleijnse, Witteman and Stijnen 27 , Reference O’Donnell, Yusuf and Mente 32 , Reference Singer, Cohen and Alderman 33 , Reference Saulnier, Gand and Ragot 38 – Reference Stolarz-Skrzypek, Kuznetsova and Thijs 40 , Reference Ekinci, Clarke and Thomas 42 ) and using dietary intake assessment in thirteen studies( Reference Cohen, Hailpern and Alderman 11 , Reference Umesawa, Iso and Date 25 , Reference He, Ogden and Vupputuri 28 – Reference Kalogeropoulos, Georgiopoulou and Murphy 31 , Reference Yang, Liu and Kuklina 34 – Reference Dong, Li and Yang 37 , Reference Nagata, Takatsuka and Shimizu 41 , Reference Costa, de Paula and Carvalho 43 , Reference Gardener, Rundek and Wright 44 ). Among studies in which dietary intake of Na was assessed, seven studies had used an FFQ( Reference Umesawa, Iso and Date 25 , Reference Horikawa, Yoshimura and Kamada 29 – Reference Kalogeropoulos, Georgiopoulou and Murphy 31 , Reference Nagata, Takatsuka and Shimizu 41 , Reference Costa, de Paula and Carvalho 43 , Reference Gardener, Rundek and Wright 44 ) and five studies used a 24h food recall( Reference Cohen, Hailpern and Alderman 11 , Reference He, Ogden and Vupputuri 28 , Reference Yang, Liu and Kuklina 34 – Reference Cohen, Hailpern and Fang 36 ). In addition, in one study( Reference Dong, Li and Yang 37 ) dietary Na intake was estimated using a 3d food record.
Table 1 General characteristics of studies included in the present systematic review and meta-analysis of prospective studies on the association of dietary sodium intake with all-cause and cardiovascular mortality
F, female; M, male; NR, not reported.
* Adjustments: 1, age; 2, sex; 3, urinary potassium; 4, creatinine; 5, estimated 24 h Na excretion; 6, education; 7, exercise; 8, alcohol use; 9, current smoking; 10, weight; 11, race/ethnicity; 12, family history of CVD; 13, clinic and treatment assignment; 14, race; 15, BMI; 16, systolic blood pressure; 17, estimated glomerular filtration rate, 18, haematocrit; 19, plasma renin activity; 20, history of diabetes mellitus; 21, history of smoking; 22, history of baseline left ventricular hypertrophy; 23, history of hypertension; 24, physical activity; 25, prevalent CVD; 26, pulmonary disease; 27, history of diabetes; 28, depression; 29, blood pressure; 30, heart rate; 31, electrocardiogram abnormalities; 32, serum glucose; 33, serum albumin; 34, cholesterol; 35, glycosylated Hb (HbA1c); 36, diabetes duration; 37, LDL-cholesterol; 38, HDL-cholesterol; 39, log-transformed TAG; 40, treatment by insulin; 41, treatment by lipid-lowering agents; 42, energy intake; 43, treatment for hypertension; 44, time spent on sports activity; 45, walking time; 46, perceived mental stress; 47, fresh fish intake; 48, protein intake; 49, saturated fat intake; 50, carbohydrate intake; 51, hypercholesterolaemia; 52, previous cardiac disease; 53, total fat intake; 54, myocardial infarction; 55, left ventricular end-diastolic volume; 56, C-reactive protein; 57, brain natriuretic peptide; 58, prior history of stroke or myocardial infarction; 59, co-morbid vascular risk factors; 60, treatment allocation; 61, fruit and vegetable consumption; 62, baseline blood pressure and change in systolic blood pressure from baseline to last follow-up; 63, study population; 64, average mean arterial pressure; 65, Hb; 66, phosphate intake; 67, calcium intake; 68, Kt/V; 69, added table salt; 70, history of cancer; 71, dietary potassium; 72, menopause; 73, hormone replacement therapy; 74, diuretic use; 75, marital status; 76, intake of vitamin E; 77, study year.
† Reported risk of mortality for continuous intake of Na.
‡ Quartiles.
§ Quintiles.
In four studies, participants with the highest consumption of Na had higher risk of mortality due to all causes than those with the lowest intake( Reference Cook, Appel and Whelton 26 , Reference O’Donnell, Yusuf and Mente 32 – Reference Yang, Liu and Kuklina 34 ). In addition, two studies showed that participants with the highest intake of Na also had higher cardiovascular mortality compared with those with the lowest intake( Reference Umesawa, Iso and Date 25 , Reference O’Donnell, Yusuf and Mente 32 ). In Nagata et al.’s study, this association was significant only among men( Reference Nagata, Takatsuka and Shimizu 41 ). In contrast, an inverse association was found for Na intake with all-cause mortality( Reference Cohen, Hailpern and Fang 36 , Reference Stolarz-Skrzypek, Kuznetsova and Thijs 40 ) and CVD mortality( Reference Cohen, Hailpern and Alderman 11 , Reference Cohen, Hailpern and Fang 36 , Reference Stolarz-Skrzypek, Kuznetsova and Thijs 40 ) when comparing participants in the highest category of Na intake with those in the lowest. However, differences in all-cause mortality between participants in the highest v. those in the lowest category of Na consumption were not significant in five studies( Reference Cohen, Hailpern and Alderman 11 , Reference Geleijnse, Witteman and Stijnen 27 – Reference Horikawa, Yoshimura and Kamada 29 , Reference Kalogeropoulos, Georgiopoulou and Murphy 31 ). Furthermore, CVD mortality was not also significantly different between participants in the highest v. the lowest Na intake category in five studies( Reference He, Ogden and Vupputuri 28 , Reference Ikehara, Iso and Date 30 , Reference Singer, Cohen and Alderman 33 , Reference Yang, Liu and Kuklina 34 , Reference Gardener, Rundek and Wright 44 ).
In addition, a significant inverse association was found between Na intake and all-cause( Reference Alderman, Cohen and Madhavan 35 , Reference Dong, Li and Yang 37 , Reference Saulnier, Gand and Ragot 38 , Reference Ekinci, Clarke and Thomas 42 ) as well as CVD mortality( Reference Dong, Li and Yang 37 , Reference Saulnier, Gand and Ragot 38 , Reference Ekinci, Clarke and Thomas 42 ). In contrast, the association of Na intake with all-cause( Reference Tuomilehto, Jousilahti and Rastenyte 39 ) and CVD mortality( Reference Tuomilehto, Jousilahti and Rastenyte 39 , Reference Costa, de Paula and Carvalho 43 ) was positively significant in some other studies. However, the association of Na intake with all-cause and CVD mortality( Reference Alderman, Cohen and Madhavan 35 ) was not significant in one study. It should be pointed out that among the included studies, only one study did not adjust findings for potential confounders( Reference Ekinci, Clarke and Thomas 42 ).
Meta-analysis
After excluding studies without enough required data, nine studies were included in a non-linear dose–response meta-analysis of Na intake and CVD mortality( Reference Cohen, Hailpern and Alderman 11 , Reference Umesawa, Iso and Date 25 , Reference He, Ogden and Vupputuri 28 , Reference Ikehara, Iso and Date 30 , Reference O’Donnell, Yusuf and Mente 32 , Reference Singer, Cohen and Alderman 33 , Reference Stolarz-Skrzypek, Kuznetsova and Thijs 40 , Reference Nagata, Takatsuka and Shimizu 41 , Reference Gardener, Rundek and Wright 44 ) and eight studies in a non-linear meta-analysis of Na intake and all-cause mortality( Reference Cohen, Hailpern and Alderman 11 , Reference Cook, Appel and Whelton 26 , Reference He, Ogden and Vupputuri 28 , Reference Horikawa, Yoshimura and Kamada 29 , Reference Kalogeropoulos, Georgiopoulou and Murphy 31 – Reference Singer, Cohen and Alderman 33 , Reference Stolarz-Skrzypek, Kuznetsova and Thijs 40 ). We found a significant non-linear association (P non-linearity<0·001) between Na intake and the risk of CVD mortality among studies in which urinary excretion of Na was examined, with a relatively steep slope at Na intakes higher than 2400mg/d (Fig. 2(b)). However, the association was not significant in those studies which examined dietary intake of Na (P=0·61; Fig. 2(a)). In contrast, the non-linear association of Na intake with all-cause mortality was not significant in studies assessing both dietary intake (P=0·85; Fig. 3(a)) and urinary excretion (P=0·79; Fig. 3(b)). When we combined data from studies using dietary intake and those assessing urinary excretion of Na, a significant association was found between Na intake and CVD mortality (Fig. 4). However, the association of Na intake with all-cause mortality was still not significant (Fig. 5).
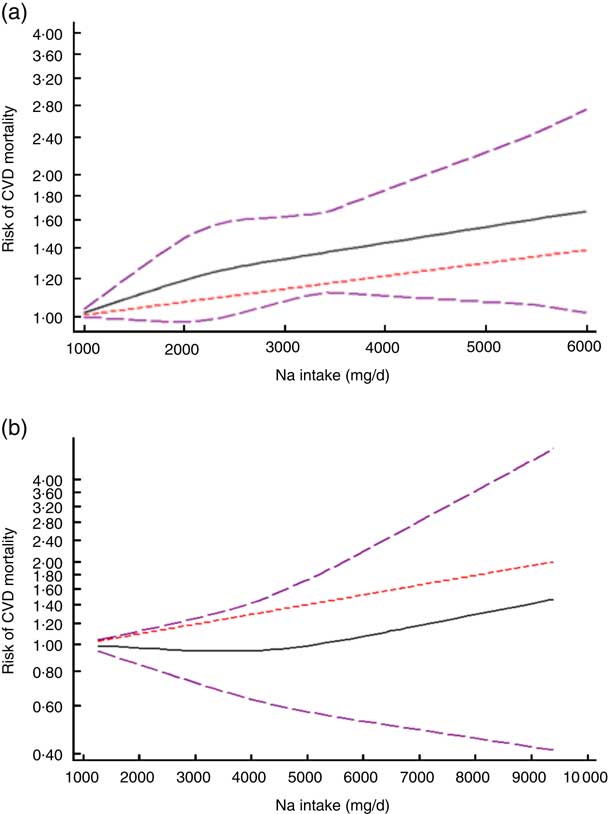
Fig. 2 (colour online) The non-linear association meta-analysis between adjusted hazard ratios of CVD mortality and sodium intake among studies using (a) dietary intake assessment and (b) urinary sodium excretion. Sodium intake was modelled with restricted cubic splines in a multivariate random-effects dose–response model (![]() , linear model;
, linear model; ![]() , spline model;
, spline model; ![]() , 95% CI); the vertical axis is on a log scale
, 95% CI); the vertical axis is on a log scale
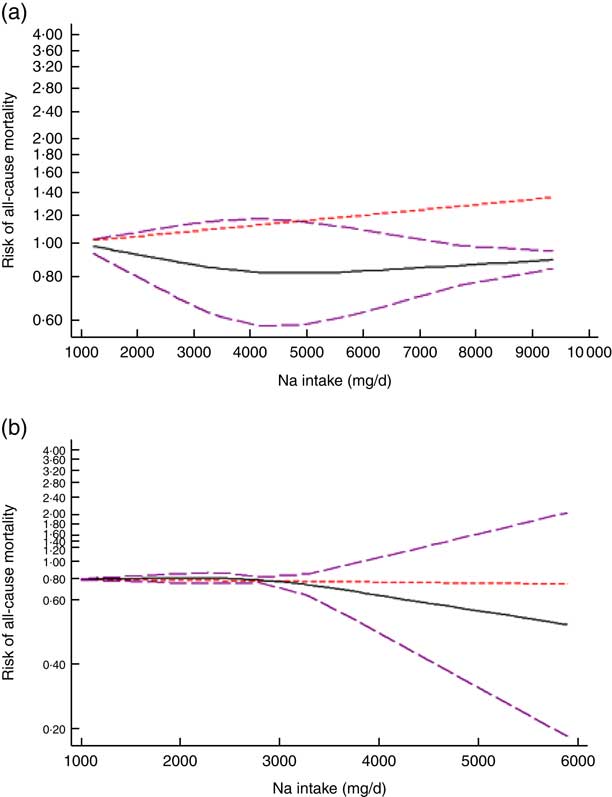
Fig. 3 (colour online) The non-linear association meta-analysis between adjusted hazard ratios of all-cause mortality and sodium intake among studies using (a) dietary intake assessment and (b) urinary sodium excretion. Sodium intake was modelled with restricted cubic splines in a multivariate random-effects dose–response model (![]() , linear model;
, linear model; ![]() , spline model;
, spline model; ![]() , 95% CI); the vertical axis is on a log scale
, 95% CI); the vertical axis is on a log scale
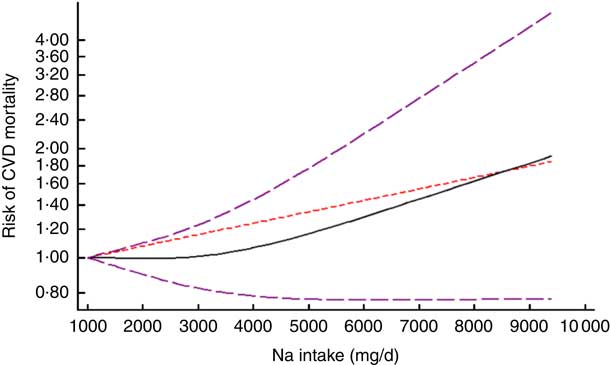
Fig. 4 (colour online) The non-linear association meta-analysis between adjusted hazard ratios of CVD mortality and sodium intake. Sodium intake was modelled with restricted cubic splines in a multivariate random-effects dose–response model (![]() , linear model;
, linear model; ![]() , spline model;
, spline model; ![]() , 95% CI); the vertical axis is on a log scale
, 95% CI); the vertical axis is on a log scale
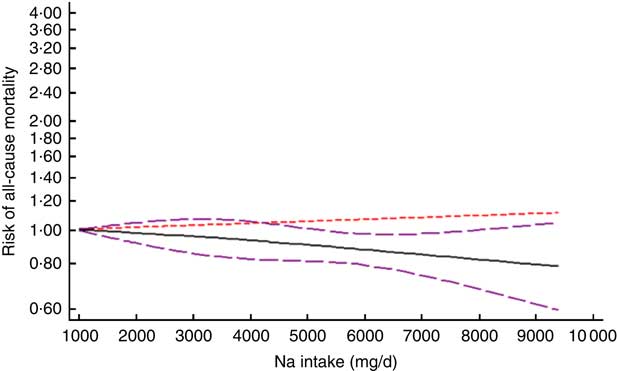
Fig. 5 (colour online) The non-linear association meta-analysis between adjusted hazard ratios of all-cause mortality and sodium intake. Sodium intake was modelled with restricted cubic splines in a multivariate random-effects dose–response model (![]() , linear model;
, linear model; ![]() , spline model;
, spline model; ![]() , 95% CI); the vertical axis is on a log scale
, 95% CI); the vertical axis is on a log scale
In addition, the linear trend of Na intake with CVD( Reference Cohen, Hailpern and Alderman 11 , Reference Umesawa, Iso and Date 25 , Reference He, Ogden and Vupputuri 28 , Reference Ikehara, Iso and Date 30 , Reference O’Donnell, Yusuf and Mente 32 , Reference Singer, Cohen and Alderman 33 , Reference Alderman, Cohen and Madhavan 35 , Reference Dong, Li and Yang 37 – Reference Ekinci, Clarke and Thomas 42 , Reference Gardener, Rundek and Wright 44 ) and all-cause mortality( Reference Cohen, Hailpern and Alderman 11 , Reference Cook, Appel and Whelton 26 , Reference He, Ogden and Vupputuri 28 , Reference Horikawa, Yoshimura and Kamada 29 , Reference Kalogeropoulos, Georgiopoulou and Murphy 31 – Reference Singer, Cohen and Alderman 33 , Reference Alderman, Cohen and Madhavan 35 , Reference Dong, Li and Yang 37 – Reference Stolarz-Skrzypek, Kuznetsova and Thijs 40 , Reference Ekinci, Clarke and Thomas 42 ) was analysed. No significant association was found between 100mg/d increment in Na intake and CVD mortality in the current study (effect size=1·01; 95 % CI 0·97, 1·05; I 2=98·4 %; Fig. 6). Due to substantial heterogeneity between the included studies, we conducted a subgroup analysis based on publication country (USA/Japan/other countries), follow-up duration (<10 years/≥10 years), exposure assessment method (dietary intake assessment/urinary Na excretion), study sample size (<5000 persons/≥5000 persons), study quality (low/high) and daily Na intake (<3000mg/≥3000mg; Fig. 7(a)–(f)). Among the subgroup analyses, between-study heterogeneity disappeared only among studies conducted in the USA (effect size=0·99; 95 % CI 0·99, 1·00; I 2=20·0 %). Sensitivity analysis showed that neither an individual study nor a group of studies had a significant influence on our results (data not shown).
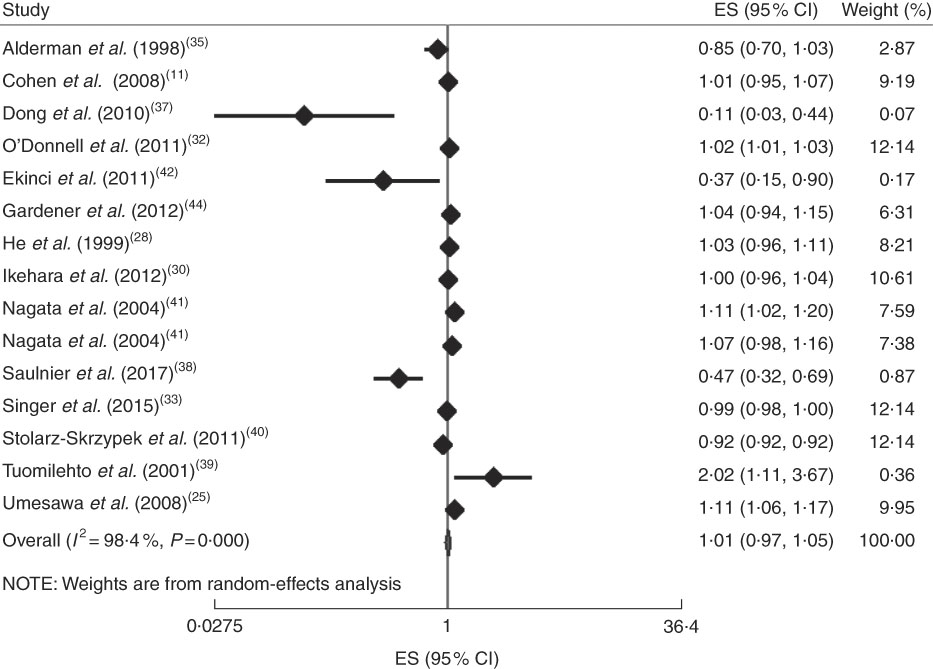
Fig. 6 (colour online) Forest plot for the linear trend meta-analysis between 100mg/d increment in sodium intake and CVD mortality. The effect size (ES) and 95 % CI are represented by the black diamond and horizontal line, respectively; the study weight diamond is proportional to the inverse of the variance of the ES. The centre of the blue open diamond and the vertical dashed red line represent the pooled ES, the width of the open diamond represents the pooled 95% CI and the vertical black line at ES=1 represents the null effect
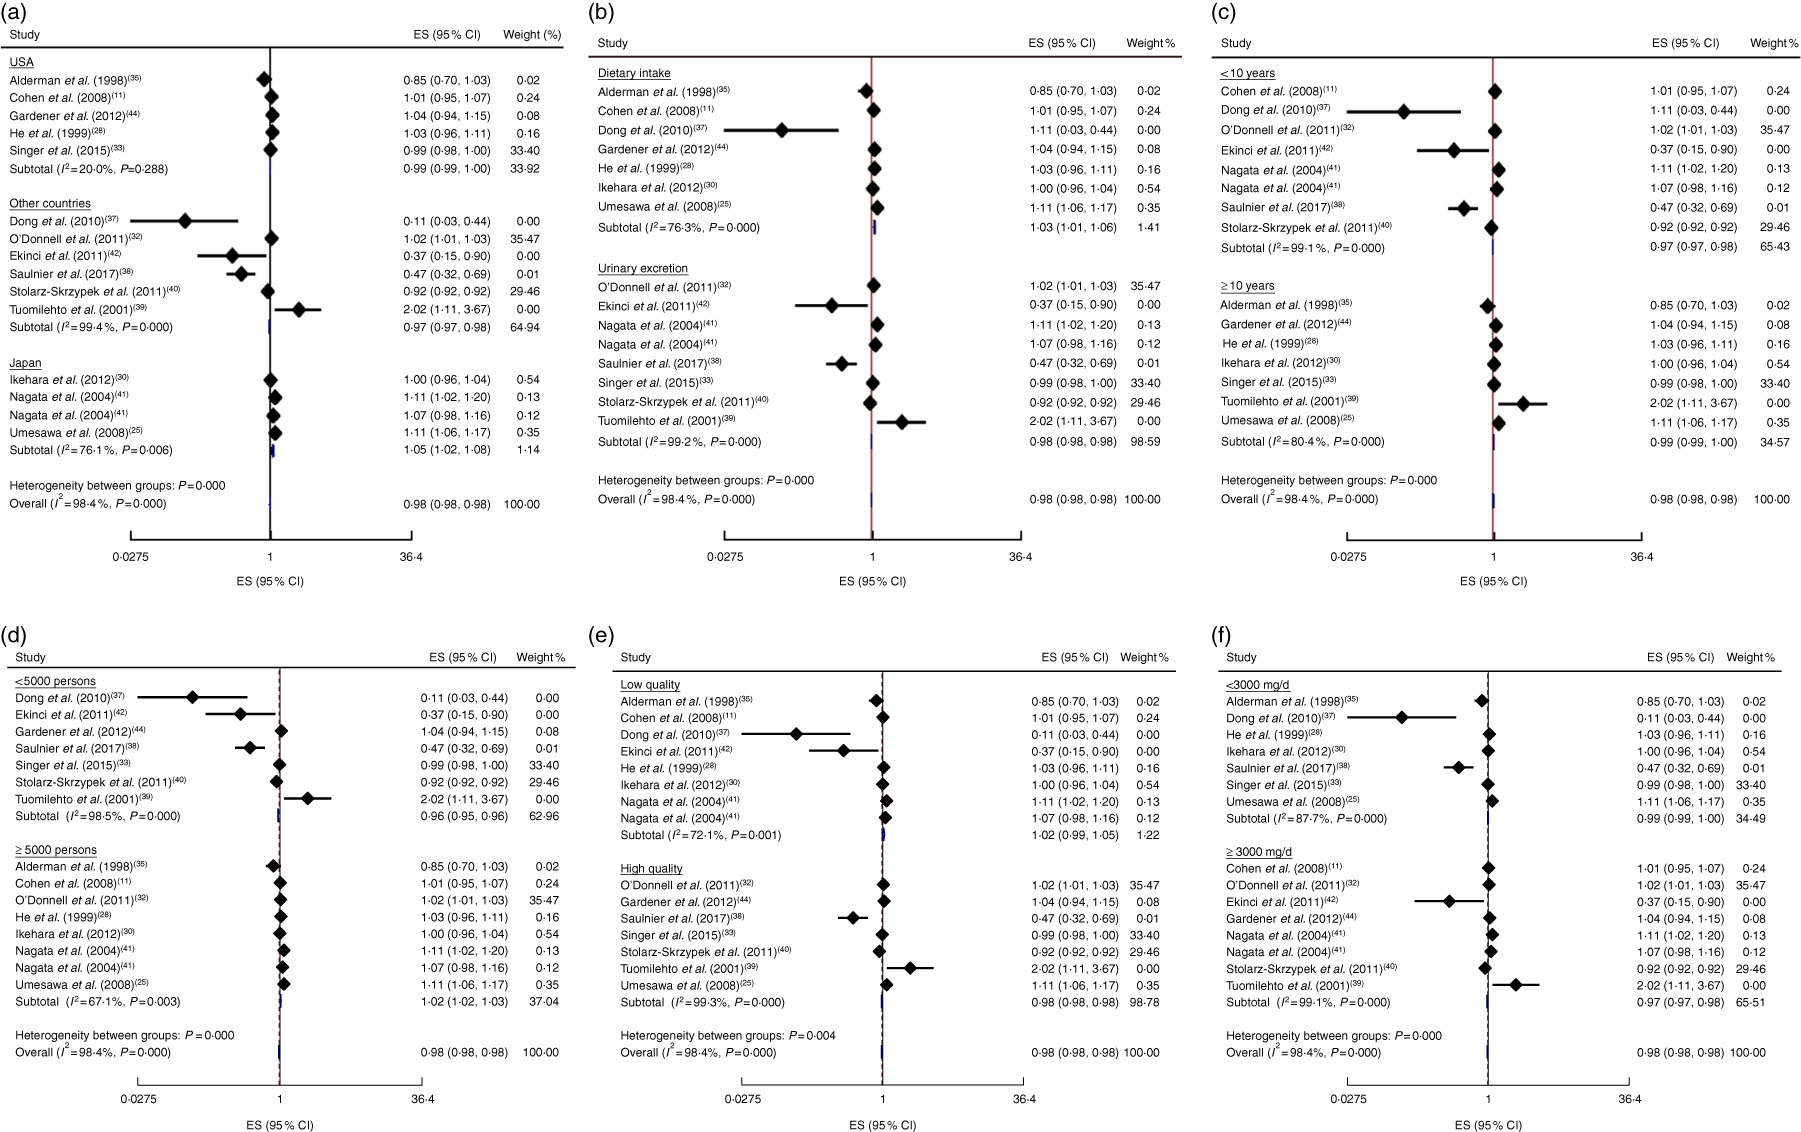
Fig. 7 (colour online) Forest plots for subgroup analysis of the linear trend meta-analysis between 100mg/d increment in sodium intake and CVD mortality by (a) country, (b) exposure assessment, (c) follow-up duration, (d) study sample size, (e) study quality and (f) daily sodium intake. The effect size (ES) and 95% CI are represented by the black diamond and horizontal line, respectively; the study weight is proportional to the inverse of the variance of the ES. The centre of the blue open diamond and the vertical dashed red line represent the pooled ES, the width of the open diamond represents the pooled 95% CI and the vertical black line at ES=1 represents the null effect
Furthermore, a 100mg/d increment in Na intake was not significantly associated with all-cause mortality in the current study (effect size=1·01; 95 % CI 1·00, 1·02; I 2=89·2%; Fig. 8). The subgroup analysis was done based on publication country (USA/non-USA), follow-up duration (<10 years/≥10 years), exposure assessment method (dietary intake assessment/urinary Na excretion), study sample size (<5000 persons/≥5000 persons), study quality (low/high) and daily intake of Na (<3000mg/≥3000mg; see online supplementary material, Supplemental Fig. 1(a)–(f)); results showed that none of them was the potential source of heterogeneity. However, the most reduction in heterogeneity occurred when we did the reanalysis based on exposure assessment method among the studies which had used dietary intake measures (effect size=1·00; 95 % CI 1·00, 1·01; I 2=65·8%). In addition, sensitivity analysis showed that neither an individual study nor a group of studies had a considerable influence on the final finding (data not shown).
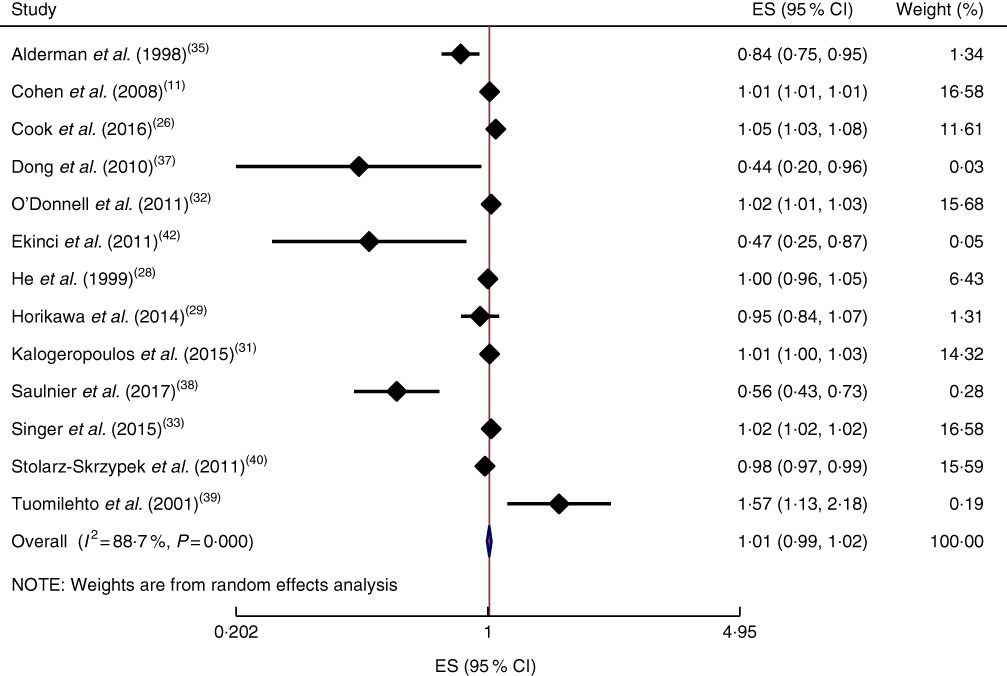
Fig. 8 (colour online) Forest plot for the linear trend meta-analysis between 100mg/d increment in sodium intake and all-cause mortality. The effect size (ES) and 95 % CI are represented by the black diamond and horizontal line, respectively; the study weight is proportional to the inverse of the variance of the ES. The centre of the blue open diamond and the vertical dashed red line represent the pooled ES, the width of the open diamond represents the pooled 95% CI and the vertical black line at ES=1 represents the null effect
Discussion
In the current study, we found that there was no significant association of 100mg/d increment in Na intake with CVD and all-cause mortality. High levels of heterogeneity were found between the studies. The country where the study was conducted and the method for the assessment of Na were the potential sources of heterogeneity.
We also found a non-linear direct association between urinary excretion of Na and the risk of CVD mortality. This association was more considerable at Na intakes higher than 2400mg/d. In addition, we failed to find a non-linear association between Na intake and all-cause mortality.
Our meta-analysis showed a non-linear direct association between Na urinary excretion and CVD mortality, which was more considerable at Na intakes higher than 2400mg/d. This finding is in line with the American Heart Association guidelines, which recommend consumption of no more than 2400mg of Na daily( Reference Eckel, Jakicic and Ard 45 ). However, our included studies did not have sufficient data for extreme low and high intakes of Na. Mean Na intake of participants in the studies was between 3000 and 5000mg/d. Therefore, more studies are needed to find an association between extreme low or high Na intakes and mortality. Findings of previous meta-analyses in this area are controversial. In Alderman and Cohen’s meta-analysis, although there was an inverse association between Na intake and CVD mortality among individuals who had consumed less than 4500mg Na/d, the association was direct among those with a higher Na intake. Moreover, a ‘J-shaped’ association was found between Na intake and CVD mortality in two observational studies included in that meta-analysis( Reference Alderman and Cohen 12 ). In addition, Graudal claimed that there is a ‘U-shaped’ association between dietary Na intake and CVD mortality( Reference Graudal 13 ). Furthermore, another study reported a significant association between Na intake and risk of CVD( Reference Strazzullo, D’Elia and Kandala 9 ). However, the significance was achieved only by the arbitrary exclusion of the Alderman et al. study with sufficient numbers at the low end.
We could not find a significant association between Na intake and CVD mortality among studies in which a dietary assessment tool was used to estimate participants’ Na intake. But the association was significant among studies which had used 24h urinary Na excretion. It should be noted that dietary intake assessment may not reflect actual dietary intakes of participants such that intake of some minerals including Na is frequently underestimated while urinary Na may provide adequately acceptable population estimates( Reference McLean 46 ).
Additionally, there was no association between Na intake and all-cause mortality in the current meta-analysis. This finding was also observed even after the subgroup analyses based on the method of Na intake estimation, including 24h urinary Na excretion and dietary intake assessment methods. To the best of our knowledge, there is no systematic review or meta-analysis available investigating the association of dietary Na intake with all-cause mortality among cohorts. However, in line with our findings, a huge body of evidence has failed to find any significant association between dietary Na intake and all-cause mortality( Reference Cohen, Hailpern and Alderman 11 , Reference Geleijnse, Witteman and Stijnen 27 – Reference Horikawa, Yoshimura and Kamada 29 , Reference Kalogeropoulos, Georgiopoulou and Murphy 31 ). Moreover, other meta-analysis studies have also shown inconsistent findings, such that a meta-analysis in 2013 could not find a significant association between lower dietary Na intake and all-cause mortality( Reference Aburto, Ziolkovska and Hooper 47 ), whereas another meta-analysis in 2014 found a significant positive association between higher than normal Na intake and all-cause mortality as well as CVD events( Reference Graudal, Jürgens and Baslund 48 ). However, neither of those studies performed a dose–response meta-analysis; furthermore, few studies were included for the mortality outcome in their analyses. Higher consumption of Na has been linked to a higher risk of all-cause mortality in some other studies( Reference Cook, Appel and Whelton 26 , Reference O’Donnell, Yusuf and Mente 32 – Reference Yang, Liu and Kuklina 34 ). Although these studies found a significant association, the observed increase in the risk of all-cause mortality was often small and it was not adjusted for some important confounders, including dietary intakes of participants. In contrast to these findings, two other studies have shown an inverse association between Na intake and all-cause mortality( Reference Cohen, Hailpern and Fang 36 , Reference Stolarz-Skrzypek, Kuznetsova and Thijs 40 ). However, mean Na intake in these studies was frequently lower than that observed among the rest of the studies.
Na concentration in serum regulates osmotic pressure and thus blood pressure( Reference Seo and Oh 49 ). The increase in Na concentration due to consumption of high-salt diets disturbs normal function of blood vessel endothelium and elevates heart burden( Reference Lother, Fürst and Bergemann 50 ). Accordingly, high Na consumption could be assumed as a risk factor for CVD mortality.
The present study is the first dose–response meta-analysis on the association of dietary Na intake with CVD and all-cause mortality among cohort studies. Including cohort studies with larger sample sizes and long-term follow-ups may result in a firmer conclusion. However, some limitations should be noted. The most of the cohorts included were done in the USA, where the population has specific dietary behaviours different from many other countries. This is important to consider because we know that the study country was a source of heterogeneity in our linear meta-analysis on the association between Na intake and CVD mortality. High between-study heterogeneity is another limitation of the current meta-analysis. Furthermore, considering different confounders may also explain different findings of the included studies. In addition, dietary intake of Na was estimated using an FFQ or a 24h food recall in most of the included studies. Due to the low number of studies using each of these two methods, we could not separately analyse data for them. Moreover, misclassification of participants may occur when using an FFQ, and the latter also might not reflect sufficiently long-term dietary intakes( Reference Naska, Lagiou and Lagiou 51 ). Besides, a unique 24h food recall cannot reflect long-term dietary intakes of participants( Reference Lyu, Hsu and Chen 52 ).
Conclusion
In conclusion, the current dose–response meta-analysis showed a direct association between urinary excretion of Na and CVD mortality which was more considerable at Na intakes higher than 2400mg/d. However, we failed to find a significant association between Na intake and all-cause mortality. Further studies, especially long-term prospective cohorts in different populations, are required to confirm these findings.
Acknowledgements
Financial support: This research received no specific grant from any funding agency in the public, commercial or not-for-profit sectors. Conflict of interest: The authors have no conflicts of interest to declare. Authorship: A.M. and K.D. designed the study. A.M. and S.S.-B. analysed and interpreted the data. A.M. wrote the manuscript. S.S.-B. and K.D. revised the manuscript. Ethics of human subject participation: Not applicable; this study had no human or animal intervention.
Supplementary material
To view supplementary material for this article, please visit https://doi.org/10.1017/S1368980018002112


