


The global prevalence of coronary artery disease was 154 million in 2016, representing 32·7 % of the global burden of CVD and 2·2 % of the overall global burden of disease(1). Assessment of risk for atherosclerotic CVD and primary CVD prevention makes up a significant part of a clinician’s daily practice(Reference Kerut, Hall and Turner2).
The coronary artery calcification (CAC) score is a marker of subclinical atherosclerosis, which is capable of predicting cardiovascular events in individuals with no previous CVD(Reference Benjamin, Virani and Callaway3,Reference Pereira, Gomez and Bittencourt4) . The CAC score detected by cardiac computed tomography is an accurate non-invasive marker used to assess atherosclerosis in the coronary arteries, providing information on underlying pathologic changes within them, and enabling a detailed assessment of the subclinical disease(Reference Budoff, Achenbach and Blumenthal5,Reference Reilly, Wolfe and Localio6) . Coronary events are directly proportional to calcified plaque burden and hence total plaque burden(Reference Kerut, Hall and Turner2), and CAC score categories are associated with CHD and incident stroke, according to two systematic reviews and meta-analyses(Reference Pletcher, Tice and Pignone7,Reference Chaikriangkrai, Jhun and Palamaner Subash Shantha8) .
The CAC score has great potential to guide clinical recommendations and has been applied to regulate the adequate use of anti-atherosclerosis drugs. Moreover, CAC score evaluations in clinical practice have led to the increased use of aspirin, blood pressure and cholesterol therapies, and improved adherence to statin therapy in at-risk patients(Reference Nezarat, Kim and Budoff9).
According to WHO, most CVD can be prevented by addressing behavioural risk factors such as tobacco use, unhealthy diet and obesity. Whilst some studies have investigated the association between CAC and specific beverages (i.e. coffee and sugar-sweetened beverages)(Reference Chun, Choi and Chang10,Reference Miranda, Steluti and Goulart11) and a review reported evidence for micronutrients(Reference Machado, Andrade and Levy12), few studies(Reference Nettleton, Steffen and Schulze13,Reference Bhat, Mocciaro and Ray14) have evaluated the relationship between dietary patterns and CAC. Dietary pattern analysis, which reflects the complexity of dietary intake, accounts for cumulative and interactive effects and reflects actual eating habits and might be useful in the context of prevention of CVD(Reference Schulze and Hoffmann15,Reference Michels and Schulze16) . It is plausible that adherence to a healthy dietary pattern would be positively associated with a low prevalence and severity of subclinical atherosclerosis as measured by the CAC score, a hypotheses supported by the literature(Reference Lloyd-Jones, Hong and Labarthe17,Reference Bhupathiraju and Tucker18) .
The Brazilian Longitudinal Study of Adult Health (ELSA-Brasil) is an ongoing multicentre cohort study focused on chronic diseases, particularly CVD, in a large admixed population. In this context, the objective of this study was to identify dietary patterns that are associated with subclinical atherosclerosis measured as CAC during the baseline examination of ELSA-Brasil participants.
Methods
The ELSA-Brasil was described previously(Reference Aquino, Barreto and Bensenor19,Reference Schmidt, Duncan and Mill20) . Briefly, 15 105 civil servants aged 35–74 years were recruited from five universities and one research institute located in different regions of Brazil. For this cross-sectional analysis of baseline data, only participants living in São Paulo who underwent a CAC score examination were included. The baseline examinations were performed in 2008–2010. The exclusion criteria were current or recent pregnancy (<4 months prior to the first interview), intention to quit working at the institution in the near future, severe cognitive or communication impairment and, if retired, residence outside of a study centre’s corresponding metropolitan area, history of cardiac diagnoses (myocardial infarction, stroke or coronary revascularisation) for whom information was missing for any covariate, or who had an energy intake lower than the 1st percentile or higher than the 99th percentile were excluded(Reference Andrade, Gorgulho and Lotufo21). After exclusions, 4025 individuals were analysed in this study (Fig. 1).
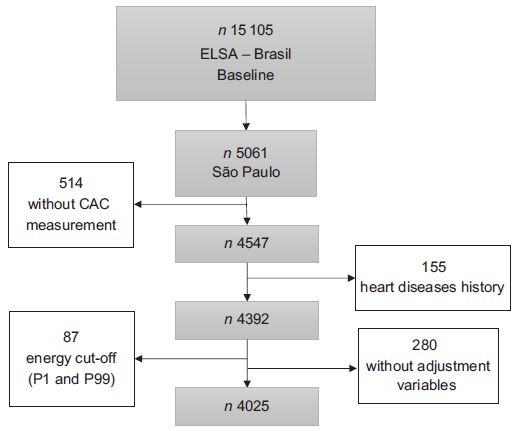
Fig. 1 Sample size and exclusion criteria, Brazilian Longitudinal Study of Adult Health (ELSA-Brasil) 2019
Compared with the Brazilian general population, the ELSA-Brasil participants had higher monthly incomes, high levels of education attainment and better access to health care(Reference Schmidt, Duncan and Mill20). However, they were selected according to the study aims, including a similar number of participants with occupations classified as unskilled, technical/clerical, and faculty and professional staff, permitting a gradient of socio-economic position across the sample. Each participant was interviewed at their workplace and visited the research centre for clinical exams according to standard protocols(Reference Bensenor, Griep and Pinto22). At each site, the interview and clinical examination were performed by trained personnel with strict quality control.
During interviews, the participants answered questions about their sociodemographic information, health and medical history, occupational exposure, family history of disease, reproductive and mental health, health care, psychological factors, body image and weight history, food consumption, smoking, alcohol consumption, physical activity, medication use and cognitive function. The physical examination included measurements of height, weight and blood pressure using standard protocols. Height and weight were measured using a stadiometer (Seca®) and a digital scale (Toledo®)(Reference Schmidt, Griep and Passos23), respectively. Participants at the ELSA-MEC site in São Paulo were invited to undergo a computed tomography examination for the quantification of CAC.
The ELSA-Brasil protocol was approved at all six centres by the respective institutional review boards addressing research in human participants. All participants signed a written informed consent form.
Diet
Dietary data were assessed using a validated FFQ composed of 114 food items applied by interviewers to evaluate each participant’s diet in the past 12 months covering three sections: (1) food products/food preparations; (2) measures of consumed products and (3) consumption frequencies with eight response options including ‘more than 3 times a day’, ‘2 to 3 times a day’, ‘once a day’, ‘5 to 6 times a week’, ‘2 to 4 times a week’, ‘once a week’, ‘1 to 3 times a month’ and ‘never/rarely’(Reference Molina, Faria and Cardoso24,Reference Molina Mdel, Bensenor and Cardoso Lde25) .
The foods in the questionnaire were then classified into the following food groups: processed meat (ham, bacon, hamburger and sausage), snacks, candies, potatoes and tubers, sugar beverages, breads and cakes, eggs, pasta, butter, poultry, fruit, vegetables, oatmeal, milk, yogurt, nuts, cheese, rice, legumes, red meat and fish. These groupings were based on their nutritional content similarities.
Coronary artery calcification measurement
All CAC examinations were performed using a sixty-four-detector row computed tomography scanner (Brilliance 64, Philips Healthcare). After scout images were collected, each patient underwent an electrocardiography-gated prospective CAC score examination with a tube potential of 120 kV and a tube current adjusted to the body habitus. Images were reconstructed in 2·5-mm-thick slices using standard filtered back projection(Reference Bensenor, Goulart and Santos26). Each CAC is expressed in Agatston units(Reference Agatston, Janowitz and Hildner27), and the percentiles were blindly evaluated by an experienced cardiologist using semiautomatic software (Calcium Scoring, Philips Workstation). CAC severity was further categorised into 0, 1–100 and >100 (Agatston units)(Reference Pletcher, Tice and Pignone7,Reference Chaikriangkrai, Jhun and Palamaner Subash Shantha8,Reference Azevedo, Rochitte and Lima28) .
Statistical analysis
In addition to observation of the correlation matrix, principal component factor analysis was used to derive the dietary patterns (factors) based on the frequency consumption of the nineteen food groups categorised according to similar nutritional composition and culinary use(Reference Marchioni, Claro and Levy29). The criteria used to retain the factors were eigenvalue > 1, scree plot shape and interpretability. Varimax rotation was applied to achieve a simpler structure with greater interpretability. The factor labels were assigned to each pattern retained based on an approximate description of the food items that were most highly represented (factor loadings ≥ 0·40). The applicability of the data to the factor analysis was verified using the Kaiser–Meyer–Olkin test considering values > 0·50 as acceptable.
Linear regression models between dietary patterns and cardiovascular risk factors were created for the sample. The dietary intake of nutrients that correlated with the outcome of interest, including total fat, saturated fat, fibre and energy, was also used as adjustment variables. Urinary Na (g/d) was used as a proxy for iodine consumption(Reference McLean30).
Multinomial regression models were used to evaluate the association between CAC severity categories and dietary patterns similar to those applied in other studies of the CAC score(Reference Mamudu, Subedi and Paul31,Reference Mayer, Lieb and Radke32) . In this way, the dependent variable was categorised as CAC 0, CAC 1–100 and CAC ≥ 100. The models were adjusted by the dietary variables used in the linear regression models plus: age (35–59 years or 60+ years); sex (male or female); self-reported race/colour (white or not white); education length (≤8 years or 9+ years); smoking status (non-smoker, ex-smoker or smoker) and sporadic excessive alcohol consumption dichotomised (yes or no) according to the amount ingested per week (men ≥ 210 g; women ≥ 140 g); level of physical activity during leisure classified as low, moderate or vigorous according to the International Physical Activity Questionnaire (≥150 min/week of moderate activity or ≥75 min/week of vigorous activity)(Reference Craig, Marshall and Sjostrom33,Reference Matsudo, Araújo and Matsudo34) ; anthropometric status by BMI in kg/m2 (low weight, eutrophic, overweight or obese) according to the cut-off points recommended by the WHO (overweight: BMI ≥ 25·0–29·9 kg/m2; obese: BMI ≥ 30 kg/m2)(35); hypertension (yes or no) according to a systolic blood pressure ≥ 140 mmHg and/or diastolic blood pressure ≥ 90 mmHg, or use of drugs for treating hypertension; diabetes (yes or no) obtained from data on post-prandial glycaemia, glycated Hb, use of medications for treating diabetes and previous diagnosis of diabetes; and dyslipidaemia (yes or no) obtained from a previous diagnosis of the disease or the use of lipid-lowering medications.
All analyses were performed using Stata Statistical Software (release 14, 2015, StataCorp LP), and the level of significance was set at 5 %. For all situations, a proportional odds model for each dietary pattern was used.
Results
Among the 4025 respondents, around 10 % (292 men and 96 women) had a CAC score >0, suggesting the presence of some CAC. The sample description by CAC score classification is shown in Table 1.
Table 1 Sample description by Coronary Artery Calcium Score, São Paulo (SP), Brasil, 2019
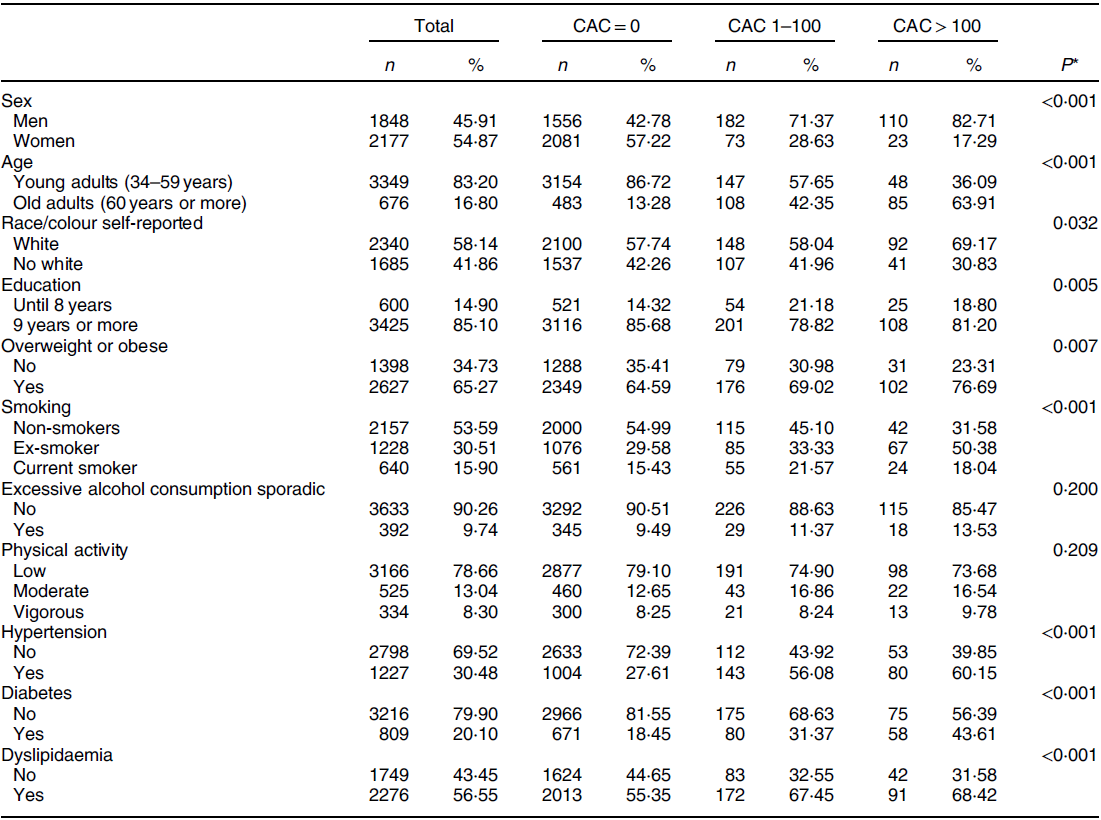
* Chi-square test.
In relation to food consumption, three dietary patterns were retained, representing 32 % of accumulated variance, with a Kaiser–Meyer–Olkin of 0·70 (Table 2). The first pattern was positively characterised by convenience foods (processed meat, snacks, candies, potatoes and tubers, sugary beverages, breads and cakes); the second was positively characterised by plant-based and dairy foods (fruits, vegetables, oatmeal, milk, yoghurt and nuts) and the third was positively characterised by rice, legumes and red meat. Table 3 shows the observed associations between dietary patterns and cardiovascular risk factors.
Table 2 Dietary patterns factor loadings, São Paulo (SP), Brasil, 2019
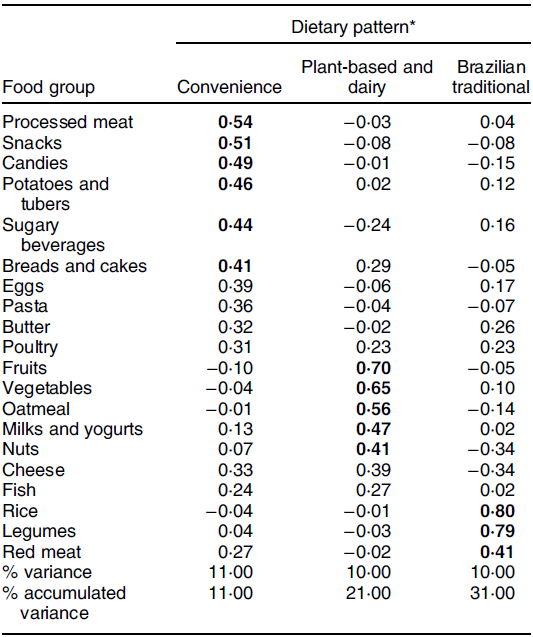
Bold values indicate a factor loading ≥ 4·0.
* Kaiser–Meyer–Olkin 0·70.
Table 3 Linear regression models between dietary patterns and cardiovascular risk factors, São Paulo (SP), Brasil, 2019
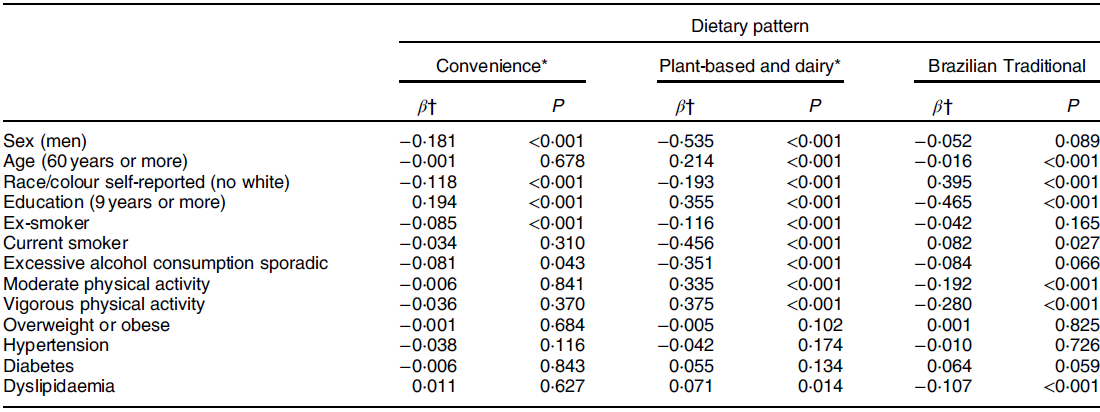
* A proportional odds model for each dietary pattern.
† Model adjusted by energy, dietary intake of total fat, saturated fat and fibre, and urinary sodium.
The multinomial regression model suggested that increased adherence to the convenience foods dietary pattern was associated with an increased risk of developing CAC. For each increase in the dietary pattern score, the odds of having a CAC score > 100 increased by 33 % (OR 1·33; 95 % CI 1·02,·1·74, P = 0·036) in the complete model (model 6). In contrast, high adherence to the Brazilian traditional dietary pattern decreased the odds of having a CAC score >100 (OR 0·76; 95 % CI 0·60,·0·97, P = 0·027), indicating that it is a possible protective factor (Table 4).
Table 4 Multinomial regression models between Coronary Artery Calcium Score and dietary patterns. São Paulo (SP), Brasil, 2019
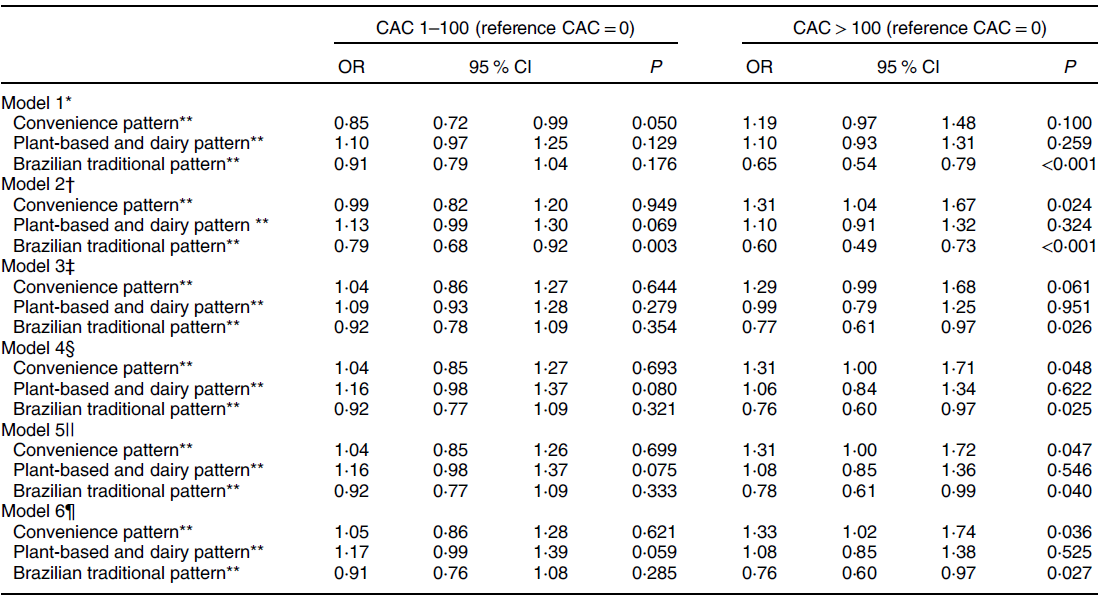
* Model adjusted by energy.
** A proportional odds model for each dietary pattern.
† Model adjusted by energy, dietary intake of total fat, saturated fat and fibre, and urinary Na.
‡ Model adjusted by all variables used in model 2 plus sex, age, race/colour and education.
§ Model adjusted by all variables used in model 3 plus smoking, alcohol consumption and physical activity.
|| Model adjusted by all variables used in model 4 plus BMI.
¶ Model adjusted by all variables used in model 4 plus BMI, hypertension, dyslipidaemia and diabetes.
Discussion
In this cross-sectional analysis of an adult population that participated in the ELSA-Brasil, a higher adherence to the dietary pattern characterised by the consumption of processed meat, snacks, candies, potatoes and tubers, sugary beverages, and bread and cakes was positively associated with a higher CAC score, while a higher adherence to the dietary pattern characterised by rice, legumes and red meat was inversely associated with CAC score.
Although the relationship between dietary patterns and CAC score has been little explored, similar studies have investigated this association. A cross-sectional study identified that a dietary pattern derived by reduced rank regression, which was high in processed meat, fats and oils, and soda, similar to the convenience dietary pattern of the current study, was associated with the presence of CAC (CAC score > 1) in a multi-ethnic population aged 45–84 years. In the same study, a similar dietary pattern derived by factor analysis was not associated with CAC score(Reference Nettleton, Steffen and Schulze13). A cross-sectional study of middle-aged Spanish adults found a dietary pattern characterised by the consumption of red and processed meat, pre-made foods, snacks, alcohol and sugar-sweetened beverages increased the odds of presenting with subclinical atherosclerosis (CAC score ≥ 1) by 31 % compared with subjects following a Mediterranean diet(Reference Penalvo, Fernandez-Friera and Lopez-Melgar36). Considering the presence of the sugary beverage food group in the convenience dietary pattern, we highlight a cross-sectional study of Korean workers that reported a 27 % higher odds of a CAC score > 0 for individuals with the highest consumption of sugary beverage consumption (≥5 drinks/week) v. non-consumers. This study also indicates that individuals with a higher intake of sugar-sweetened beverages were more likely to consume larger amounts of energy, fruits, vegetables, red and processed meat, sugary foods and alcohol(Reference Chun, Choi and Chang10).
Direct comparisons between these studies should be made with caution since the respective dietary patterns were identified using different methodological approaches. Even so, our findings and those of the aforementioned studies suggest that individuals with higher adherence to a dietary pattern marked by processed meat, foods and beverages with high levels of saturated fat and sugar, which are poor in fibre and micronutrients, had a greater chance of presenting with subclinical atherosclerosis. A longitudinal study conducted by Canhada et al. (Reference Canhada, Luft and Giatti37) also reported that a greater consumption of ultra-processed foods (NOVA classification) was associated with a higher risk of large weight (27 %) and waist circumference gains (33 %) in the ELSA-Brasil population(Reference Canhada, Luft and Giatti37).
Our results also showed an inverse association between the traditional Brazilian dietary pattern and CAC score. This may be explained by the presence of legume food groups in this dietary pattern. In Brazil, legumes are traditionally consumed with rice and the nutritional value and accessibility of this combination are recognised(Reference Sichieri, Coitinho and Monteiro38). Although white rice is a refined processed carbohydrate associated with an increased risk of type 2 diabetes and cardiometabolic diseases, combined rice and beans have an attenuated glycaemic response compared with rice alone(Reference Mattei, Hu and Campos39,Reference Thompson, Winham and Hutchins40) .
Legumes are rich in fibre, both insoluble and soluble, low in fat, and a good source of digestible protein, indicating that this nutrient profile can be responsible for health benefits(Reference Havemeier, Erickson and Slavin41), as well as improving the lipid profile(Reference Soliman42). There is no clear evidence of the relationship between legume consumption and CAC score, and we have inconclusive results regarding their dietary intake(Reference Viguiliouk, Glenn and Nishi43). However, some studies have identified benefits for cardiovascular health, including a systematic review that found a protective role of this food group against CHD(Reference Viguiliouk, Blanco Mejia and Kendall44).
Another cross-sectional study identified out-of-home eating patterns in the Brazilian population and its relationship with the overall nutritional quality of the Brazilian diet, independent of energy consumption, sociodemographic and socio-economic characteristics. It was observed that the fifth quintile of adherence to a dietary pattern carried on rice, legumes and meat was associated with a decrease in energy density, percentage of energies from carbohydrates, saturated fat, trans-fat, free sugar and Ca(Reference Andrade, da Costa Louzada and Azeredo45). This can explain the inverse association between the traditional Brazilian dietary pattern and CAC score considering that an excessive intake of saturated fat and trans-fat increases the risk of CVD mortality(Reference Kim, Je and Giovannucci46).
Studies have shown that the Mediterranean dietary pattern may be associated with less CAC progression(Reference Frolich, Lehmann and Weyers47) and a lower incidence of CVD(Reference Tong, Wareham and Khaw48). The protective effect of this diet cannot be attributed to a single food or nutrient, but rather to a combination of nutrients that have beneficial effects(Reference Korakas, Dimitriadis and Raptis49). Similarly, the Brazilian traditional dietary pattern is characterised by the consumption of Brazilian traditional foods, which usually contain compound meals prepared with fresh and less processed foods. Cross-sectional studies conducted in the Brazilian population reported an inverse association between the Brazilian traditional dietary pattern (always combining rice and beans) and BMI and CVD risk factors(Reference Castro, Baltar and Marchioni50–Reference Olinto, Gigante and Horta53). The higher adherence to this dietary pattern could also imply healthier food habits and, consequently, a low consumption of the convenience dietary pattern food groups.
Although studies have shown that a higher intake of fruits and vegetables was associated with a lower risk of CAC progression(Reference Frolich, Lehmann and Weyers47) and a lower prevalence of CAC > 0(Reference Miedema, Petrone and Shikany54), we did not find an association between plant-based and dairy dietary patterns and CAC scores. This lack of an association could be explained by the fact that, although we found a high dietary pattern for vegetables and fruits, the consumption of these food groups is usually low in the Brazilian population(55,Reference Silva and Claro56) .
In this sense, our results reinforce the importance of public health policies targeted to promote, encourage and facilitate the consumption and access to Brazilian traditional and fresh/unprocessed foods. Implementation of these policies is challenging since it involves many sectors and interests in the whole food system. However, the promotion of a healthier food environment through taxation, adequate food labelling, control of publicity and nutritional education are of utmost importance to promote health and prevent diseases.
The strengths of our study include its use of statistical methods, which provide a global analysis of diet, use of a validated FFQ, quality of the data collection and evaluation of CAC score, which provides the best non-invasive exam to predict cardiovascular event risk(Reference Geisel, Bauer and Hennig57). However, this study has some limitations. First, its cross-sectional design made it impossible to establish a temporal relationship between dietary patterns and CAC scores. Second, the factor analysis applied to identify dietary patterns requires an arbitrary decision and subjective interpretation of the factors. Factor analysis requires the researcher to define food groupings, number of factors to retain, and the interpretation and labelling of each dietary pattern. Third, dietary consumption was assessed using an FFQ, a self-reported method that could have introduced some bias, such as memory or social desirability, which could cause data misreporting. Finally, our results must be interpreted with caution when extrapolated to the general Brazilian adult population. Even though socio-economic status was considered in the adjusted analysis, the residual confounding of socio-economic factors cannot be dismissed. These data refer to a population of workers who share similar characteristics that differ from those of the general population of the country since this group had higher education, income levels and socio-economic status(Reference Aquino, Barreto and Bensenor19,Reference Schmidt, Duncan and Mill20) .
Conclusion
Our results showed that a dietary pattern composed of traditional Brazilian foods can play a protective role against CAC, while a convenience dietary pattern was positively associated with this outcome. Higher adherence to this Brazilian traditional dietary pattern could be important to reduce the risk of atherosclerotic calcification and prevent future cardiovascular events independent of sex, age, race/colour, lifestyle and the presence of non-communicable disease.
Acknowledgements
Acknowledgements: The authors thank the staff and participants of the ELSA-Brasil for their important contributions. Financial support: The ELSA-Brasil baseline study was supported by the Brazilian Ministry of Health, the Brazilian Ministry of Science and Technology and the Brazilian National Council for Scientific and Technological Development – CNPq. The research centre of São Paulo was also supported by the São Paulo Research Foundation – FAPESP. The institutions that supported the study had no role in the design, analysis or writing of this article. Conflict of interest: None. Authorship: D.M.M. and B.G. was responsible for study conception. B.G., J.A.T., R.O.S. and M.A.A. and D.M.M. contributed to the analysis and interpretation of data, manuscript drafting and critical manuscript revising. S.A., M.S.B., I.B., P.L. and D.M.M. contributed to critical review of the manuscript for important intellectual content. Ethics of human subject participation: This study was conducted according to the guidelines laid down in the Declaration of Helsinki, and all procedures involving study participants were approved by the Committee of Ethics in Research (approval number 189/2006). Written informed consent was obtained from all subjects/patients.


