


Both among the general population and among children, increasingly common issues worldwide are overweight, obesity and obesity-related health outcomes( Reference Ng, Fleming and Robinson 1 , Reference de Onis, Blössner and Borghi 2 ). Obesity-related outcomes are affected by several individual-level characteristics such as genes( Reference van der Klaauw and Farooqi 3 ), motivation for healthy eating and exercise( Reference Munt, Partridge and Allman-Farinelli 4 ), as well as knowledge about healthy lifestyles( Reference Alexander and Sherman 5 ). However, individual features are not the only factors related to health behaviours: according to the socio-ecological model, social and physical environmental factors, such as family members, peers, pre-schools, neighbourhoods and food marketing, also play a significant role( Reference Story, Kaphingst and Robinson-O’Brien 6 ). Food environments, as part of the physical environment, are especially important regarding food intake.
A food environment involves any opportunity to obtain food( Reference Townshend and Lake 7 ). Food advertising and marketing are parts of a food environment, but also included are the availability and accessibility of foods( Reference Lake and Townshend 8 ). Multiple studies have examined the associations between food availability and health behaviours. For example, the availability of fruits and vegetables in the home has been associated with higher fruit and vegetable intake among children of different ages( Reference Cullen, Baranowski and Owens 9 – Reference Pearson, Biddle and Gorely 13 ). The availability of unhealthy foods at home, however, seems to be negatively linked with fruit and vegetable consumption( Reference Vereecken, Haerens and De Bourdeaudhuij 14 ). The availability of unhealthy foods in the home has been connected to savoury snack consumption among 12–13-year-olds( Reference Campbell, Crawford and Salmon 15 ). Additionally, the availability of chips and sweets in the home was positively associated with a fats and sweets index score in a study of 5–11-year-olds( Reference Wang, Dalton and Schetzina 16 ).
The majority of studies have looked at the associations between home food availability and single foods or food groups( Reference Cullen, Baranowski and Owens 9 – Reference Campbell, Crawford and Salmon 15 ). However, using dietary patterns as a measure of a person’s total diet in epidemiological studies has become more popular in recent years( Reference Tapsell, Neale and Satija 17 ). The use of dietary patterns is beneficial, as single nutrients can be correlated and confounded with each other, and, in addition, the combined effect of a total diet may be stronger than the separate effects of the individual foods and nutrients present in the diet( Reference Willett 18 ). Nevertheless, there are only a few studies examining associations between total diets and home food availability among children. Studies in the USA have linked home food availability to the Healthy Eating Index (HEI) among 10-year-olds( Reference Ranjit, Wilkinson and Lytle 19 ) and to the Dietary Approaches to Stop Hypertension pattern score (DASH score) among 6–11-year-olds. However, a negative association was detected between the availability of unhealthy foods and the DASH score( Reference Couch, Glanz and Zhou 20 ). A Puerto Rican study found no association between the availability of healthy or unhealthy foods and HEI among 12-year-olds( Reference Torres, Serrano and Pérez 21 ).
Previously, we found an association between home food availability and unhealthy, as well as healthy, dietary patterns among a multinational sample of 10-year-olds( Reference Vepsäläinen, Mikkilä and Erkkola 22 ). However, since pre-school children are, compared with 10-year-olds, more dependent on their parents’ food choices, studies examining associations between the home food availability and dietary patterns among 3–6-year-olds are needed. To our knowledge, only one study has investigated these associations: a study from the USA found that children with limited access to unhealthy foods had a lower ‘junk’ food intake score and a higher healthy food intake score( Reference Østbye, Malhotra and Stroo 23 ). In the present study, we had two objectives: (i) to identify dietary patterns among Finnish pre-school children based on food consumption outside pre-school; and (ii) to study the associations between home food availability and dietary patterns. Our study adds to the existing literature by addressing these questions among pre-school children whose food choices are more dependent on their parents.
Methods
Study design, setting and participants
The present analyses are part of the DAGIS study( Reference Määttä, Lehto and Nislin 24 ). In the current paper, we report data from the cross-sectional survey conducted in 2015–2016. In 2015, 169 pre-schools in five municipalities in Southern Finland and three municipalities in Western Finland were invited to participate in the study. The invited pre-schools were randomly selected from all municipal pre-schools and private pre-schools from whom the municipalities purchased education services. The randomization was conducted separately for each of the participating municipalities. Of these pre-schools, sixty-seven (40 %) did not wish to participate and sixteen (9 %) were excluded due to being a 24 h pre-school, operating in a language other than Finnish or Swedish, or not having reduced fees for low-income families. From the eighty-six (51 % of those invited) pre-schools that gave consent, we invited 3592 children and their families, of whom 983 (27 %) consented. Children in pre-schools with a low participation rate (≤30 % in each of the groups for 3–6-year-olds) were further excluded (ninety-one children in twenty pre-schools). The data were collected between September 2015 and April 2016 in sixty-six pre-schools. We received no data from twenty-eight consented children. A total of 864 children aged 3–6 years and their parents or legal guardians participated in the study. The participation rate in the pre-schools under study was 29 %.
Measurements and variables
Home food availability
The questionnaire used to measure the availability of foods was based on a previously published tool( Reference Couch, Glanz and Zhou 20 ) and modified by adding foods and/or drinks considered significant and removing items considered unnecessary to better fit the particular study. The parents or legal guardians of the participating children reported how often (never, rarely, sometimes, often, always) they had specified foods in their homes. The food items included in the questionnaire were: fresh vegetables; fresh fruits or berries; frozen vegetables; frozen fruits or berries; sweets or chocolate; sweet cookies; sweet pastries; cereals or muesli with added sugar; yoghurts with added sugar; other dairy products or similar with added sugar (i.e. puddings or quarks); ice cream; soft drinks with added sugar; juices with added sugar; 100 % fruit juices; and cocoa (drink or cocoa powder with added sugar). A composite score describing the availability of fruits and vegetables was created using the frequencies of the availability of certain foods in the home (for more details, see Table 1). Similarly, a score describing the availability of sugar-enriched foods was created. All variables used in the present analyses are described in more detail in Table 1.
Table 1 Variables used in the analyses
Dietary pattern scores
Food consumption was measured using a forty-seven-item FFQ developed for the DAGIS study. The parents or legal guardians of the participating children were asked to report how many times during the past week the child had consumed different foods at home or in places other than at pre-school. The FFQ included three answer columns: ‘not at all’, ‘times per week’ and ‘times per day’. The instruction was to either tick the ‘not at all’ box or to write a number in one of the other columns. We intentionally restricted the FFQ to not cover municipality-provided foods and drinks consumed during the pre-school hours. Dietary pattern scores based on the FFQ food groups were created for each participant (see ‘Statistical methods’ and Table 1 for more detail).
Confounding variables
The parents or legal guardians reported their educational level (for both parents or legal guardians, if applicable). In the analyses, we used the highest education in the family as a proxy for a family’s educational level (Table 1). In additional analyses, we used relative household income (parent-reported gross household income weighted with the number of household members) as a confounder (data not shown).
Statistical methods
Dietary patterns
To identify existing dietary patterns in the sample, principal component analysis was conducted (using the statistical software package IBM SPSS Statistics version 22). Consumption frequencies (times per week) of the FFQ food items were used as input variables. Only children with complete FFQ (n 756, 88 % of the participants) were included in the principal component analysis. Based on the eigenvalue (minimum value of at least 1·5), scree plot and the interpretability of the components, three components with the highest eigenvalues were chosen. The analysis was then rerun with a forced three-component solution and rotated with an orthogonal Varimax transformation to enhance the interpretation. Standardized principal component scores for these three components, i.e. data-driven dietary patterns, were calculated for each participant by assigning weights to their frequency of use of each food. The obtained dietary pattern scores thus represented how closely the food consumption of each participant reflected each of the empirically derived dietary patterns (a higher score indicating a stronger adherence to a dietary pattern). Factorability of the data was supported by Bartlett’s test of sphericity (χ 2=4230·169, df=1081, P<0·001) and the Kaiser–Meyer–Olkin value of 0·618 indicated sampling adequacy.
Associations between home food availability and dietary patterns
We examined the associations between the availability scores and the dietary pattern scores using multilevel linear mixed models (using the statistical software package SAS version 9.4; PROC MIXED). We treated pre-school as the highest level in the models, to take the clustering of the participants due to the pre-school-based sampling strategy into account. The family level was used as the middle level, because the proportion of children living in the same household was relatively high (the sample involved ninety-seven families with two or three participating children). Individual participants were treated as the lowest level of the three-level model. Since we assumed the data to be nested, i.e. each level to be a subset of the other, we excluded one child from a family whose two children attended different pre-schools. Pre-schools and families nested within them were considered to have fixed effects. We used the Kenward and Roger approximation to calculate the denominator degrees of freedom for statistical tests pertaining to fixed effects( Reference Kenward and Roger 25 ). An unconditional model with no predictors was used to estimate the amount of variance in dietary pattern scores attributable to participating children, their families and pre-schools (intraclass correlation coefficient). Associations between the availability scores and the dietary pattern scores were assessed using multilevel models, with each of the availability scores used separately as predictors (models 1 and 2). In addition, multivariable models were used to identify the possible independent roles of the two different availability scores (model 3). To improve model fit indices, we adjusted models 1–3 for the highest education in the family. In additional analyses, the models were adjusted for relative household income (data not shown). Unadjusted models are presented in the online supplementary material, Supplemental Table 1. Differences between groups were illustrated by calculating the least-square means of the dietary pattern scores in different combinations of the fruits and vegetable and sugar-enriched food availability score quarters (adjusted for the highest education in the family). Interactions between the availability score categories were tested using Wald’s Z test.
Results
Dietary patterns
The three components chosen explained 16·7 % of the variance in total and their eigenvalues were >1·5. The factor loadings of the rotated Varimax solution with absolute values of 0·3 or more, eigenvalues and the proportion of total variance explained are shown in Table 2. The first component was labelled ‘sweets-and-treats pattern’ based on its high loadings of e.g. sweet biscuits and cereal bars; chocolate; ice cream; sweets; and soft drinks. The second component was characterized by high loadings of e.g. nuts; natural yoghurt; berries; egg; and wholegrain porridge, non-sweetened breakfast cereals and muesli, and was thus named ‘health-conscious pattern’. Finally, we named the third component ‘vegetables-and-processed meats pattern’ based on the high loadings of e.g. fresh vegetables; cold cuts; fresh fruit; flavoured yoghurt; and wholemeal bread. The dietary pattern scores did not differ between genders.
Table 2 Characteristics of the three dietary patterns found in Finnish pre-school children aged 3–6 years, DAGIS study, September 2015–April 2016
Altogether nineteen foods (skimmed milk; berry, fruit and chocolate porridge; reduced-sugar juices and soft drinks; puddings; white bread; 1 % fat and semi-skimmed milk; flavoured or sweetened milk- or plant-based drinks; low-fat cheese; jams, marmalades and sweetened spreads; added sugar, honey and syrup; fish; berry and fruit fools and thickened soups; rye bread, crispbread and thin rye crackers; whole milk; white rice and pasta; white meat; canned and frozen fruit; potato; red meat) did not load with an absolute value of 0·3 or more to any of the three patterns identified and are not shown in the table. Loadings with an absolute value of 0·3 or more are shown in bold.
Participants
In the final analyses we included 714 children (83 % of the children with any data) with at least one of the two availability scores and educational level data (models 1–2) and 711 children (82 % of the children with any data) with complete availability scores and educational level data (model 3). The children were from sixty-six pre-schools, had a mean age of 4·7 (sd 0·89) years and 49 % of them were girls. Less than 4 % of the parents reported speaking a language other than Finnish or Swedish (the official languages of Finland) with the participating child, making the sample fairly homogeneous in terms of ethnicity. Furthermore, in only 7 % of the cases did the parents belong to opposite educational level categories (secondary school or lower v. master’s degree or higher). Table 3 presents the characteristics of the participating children, their families and the availability scores of fruits and vegetables as well as sugar-enriched foods. In addition, Table 3 shows the dietary pattern scores in parental education categories. Children from parents with a higher educational level had lower sweets-and-treats as well as vegetables-and-processed meats pattern scores and higher health-conscious pattern scores compared with children from parents with a lower educational level. Higher educated families had higher fruits and vegetables availability scores compared with families with lower educational level. The children excluded from the current analyses were mostly boys (60 %, χ 2 test P=0·043) and their parents were less educated compared with the children with complete data (χ 2 test P=0·001). In terms of age, availability scores and dietary pattern scores, the excluded children did not differ from the participants included in the analyses.
Table 3 Age of the participating children, home food availability scores and dietary pattern scores, by parental education, among Finnish pre-school children aged 3–6 years, DAGIS study, September 2015–April 2016
* The P value shows the result of ANOVA to compare availability scores and dietary pattern scores between the three parental education levels.
† A composite score describing the availabilities of fresh vegetables, fresh fruits or berries, frozen vegetables, frozen fruits or berries, and 100 % fruit juices in the home, range 5–25.
‡ A composite score describing the availabilities of sweets or chocolate, sweet cookies, sweet pastries, ice cream, soft drinks and juices with added sugar in the home, range 6–30.
§ Scores derived for every participant by principal component analysis by assigning weights to each participant’s food consumption frequency. Higher pattern score indicates stronger adherence to the dietary pattern in question.
Home food availability and dietary pattern scores
Judging by the unconditional model, most of the variance in the dietary pattern scores was attributable to the family level: the intraclass correlation coefficient was 0·93 for sweets-and-treats as well as for health-conscious pattern scores, whereas for the vegetables-and-processed meats pattern score, the intraclass correlation coefficient was 0·90. The variance attributable to the pre-school level was 1·5 % for the sweets-and-treats pattern score, 3·3 % for the health-conscious pattern score and 0 % for the vegetables-and-processed meats pattern score. These percentages remained nearly unchanged when the availability factors were added to the models, as shown in Table 4.
Table 4 Associations between home food availability scores and dietary pattern scores, adjusted for highest education in the family, among Finnish pre-school children aged 3–6 years, DAGIS study, September 2015–April 2016
ICC, intraclass correlation coefficient; AIC, Akaike information criterion (smaller is better); BIC, Bayesian information criterion (smaller is better).
* Composite score consisting of the availability frequencies of fresh vegetables, fresh fruits, frozen vegetables, frozen fruits or berries and 100 % fruit juices in the home.
† Composite score consisting of the availability frequencies of sweets and chocolate, sweet cookies, sweet pastries, ice cream, soft drinks and juices with added sugar in the home.
Model 1 (Table 4) shows the associations between the availability of fruits and vegetables and dietary pattern scores, whereas Model 2 shows the associations between the availability of sugar-enriched foods and dietary pattern scores. Both models were adjusted for parental education. Model 3 shows the aforementioned associations with both availability scores simultaneously in the model. The availability of fruits and vegetables was positively associated with the health-conscious pattern score, whereas the availability of sugar-enriched foods was positively associated with the sweets-and-treats pattern score. We also found an inverse association between the fruits and vegetables availability score and the sweets-and-treats pattern score. Similarly, the availability of sugar-enriched foods was inversely associated with the health-conscious pattern score. In addition, the availability of fruits and vegetables was positively associated with the vegetables-and-processed meats pattern score, whereas the inverse association between the sugar-enriched foods availability score and the vegetables-and-processed meats pattern score was borderline significant. Models adjusted for relative household income yielded similar results (data not shown). Figures 1–3 illustrate dietary pattern scores in quarters of fruits and vegetables and sugar-enriched foods availability scores. Statistically significant interactions between fruits and vegetables and sugar-enriched availability scores were detected for all dietary pattern scores.
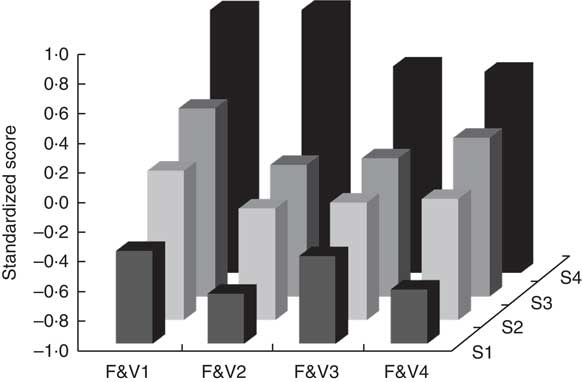
Fig. 1 Sweets-and-treats pattern scores in quarters of fruits and vegetables availability scores (horizontal axis, F&V1–F&V4) and sugar-enriched foods availability scores (vertical axis, S1–S4) among Finnish pre-school children aged 3–6 years (n 711), DAGIS study, September 2015–April 2016. Interaction between availability scores was statistically significant (P<0·0001)
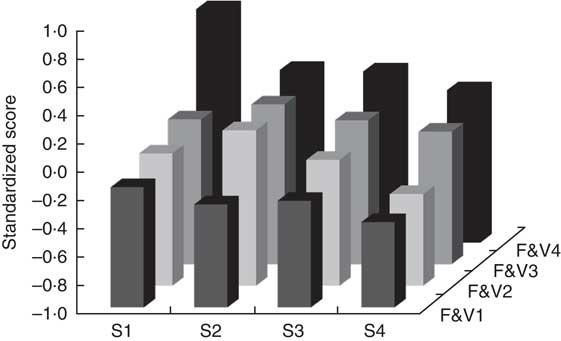
Fig. 2 Health-conscious pattern scores in quarters of sugar-enriched foods availability scores (horizontal axis, S1–S4) and fruits and vegetables availability scores (vertical axis, F&V1–F&V4) among Finnish pre-school children aged 3–6 years (n 711), DAGIS study, September 2015–April 2016. Interaction between availability scores was statistically significant (P=0·0185)
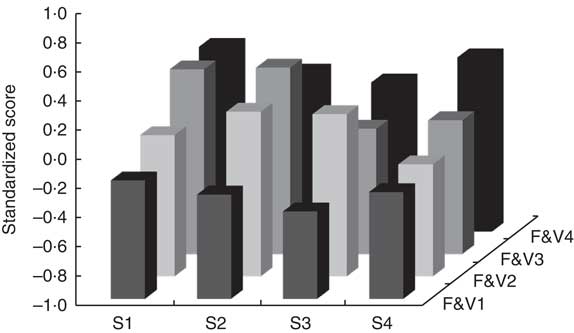
Fig. 3 Vegetables-and-processed meats pattern scores in quarters of sugar-enriched foods availability scores (horizontal axis, S1–S4) and fruits and vegetables availability scores (vertical axis, F&V1–F&V4) among Finnish pre-school children aged 3–6 years (n 711), DAGIS study, September 2015–April 2016. Interaction between availability scores was statistically significant (P=0·0219)
Discussion
Key results
In this sample of Finnish pre-school children, we identified three dietary patterns named sweets-and-treats, health-conscious and vegetables-and-processed meats. The availability of fruits and vegetables was associated with lower sweets-and-treats pattern scores and higher health-conscious and vegetables-and-processed meats pattern scores. However, the availability of sugar-enriched foods was associated with higher sweets-and-treats and lower health-conscious pattern scores. In addition, considering the sweets-and-treats pattern, the role of the sugar-enriched foods was greater than that of the fruits and vegetables. High availability of fruits and vegetables in the home did not seem to protect the children from the effect of the sugar-enriched foods. The unique feature of the present study was the use of dietary patterns as an outcome in a sample of 3–6-year-olds.
Interpretation and generalizability
Only a few studies have investigated dietary patterns among pre-school children. Since principal component analysis requires multiple subjective decisions, several different results are possible and acceptable, and consistencies are difficult to evaluate. However, quite commonly, two or three dietary patterns are identifiable, and the most frequently emerging patterns among children of pre-school age have been characterized as ‘healthy’ and ‘unhealthy’( Reference Smithers, Golley and Brazionis 26 ). The fact that we arrived with dietary patterns very similar to these commonly found patterns suggests that the FFQ is an adequate tool to assess dietary behaviour among pre-school children outside pre-school hours. A sample of British 4-year-olds( Reference Northstone and Emmett 27 ) and 5-year-old Brazilian pre-schoolers revealed relatively similar patterns( Reference Nobre, Lamounier and Franceschini 28 ). Since the vegetables-and-processed meats pattern consisted of both healthy and unhealthy foods, we had difficulties in naming it. However, we feel that the pattern represents a true situation: a diet with mixed choices, some healthier than others. In fact, a similarly mixed dietary pattern has previously been found among 3–6-year-old French children( Reference Lioret, Touvier and Lafay 29 ). Other studies have also reported mixed patterns with high intakes of both meat and vegetables( Reference Northstone and Emmett 27 , Reference Nobre, Lamounier and Franceschini 28 ). Despite differences in cultural backgrounds, children may express fairly similar dietary patterns: for example, in a geographically and culturally diverse sample of 10-year-olds we have identified two almost-identical dietary patterns in twelve countries( Reference Mikkilä, Vepsäläinen and Saloheimo 30 ).
Home availability or accessibility is one of the determinants most consistently associated with fruit and vegetable consumption among children and adolescents( Reference Rasmussen, Krølner and Klepp 31 ). Our study supports the suggestion that the availability of fruits and vegetables in the home promotes healthy dietary patterns. This is consistent with several previous studies, although only a few studies involved the participation of children of pre-school age( Reference Wyse, Campbell and Nathan 10 , Reference Østbye, Malhotra and Stroo 23 ). In our study, having sugar-enriched foods at home seemed to be associated with an unhealthy dietary pattern, even when fruits and vegetables were also present. Previously, we obtained similar results in a large sample of school-aged children( Reference Vepsäläinen, Mikkilä and Erkkola 22 ), who probably have access to foods both inside and outside the home and are generally less dependent on their parents than the pre-school children in the present study. Our study also supports the well-established association between parents’ higher education and healthy dietary habits in children( Reference Rasmussen, Krølner and Klepp 31 ).
It is obvious that children eat what their parents buy and have in the home; however, factors affecting food purchasing in families are complex. For example, in an Australian interview study, parents of 5–6-year-olds thought that their children’s diets were influenced by the foods they had available in the home but, conversely, they tended to offer their children foods based on their children’s tastes and preferences( Reference Campbell, Crawford and Hesketh 32 ). Many parents also shop with their children and compared with older children, pre-school children may initiate more food requests while in a grocery store( Reference Calderon, Ayala and Elder 33 ). Calloway et al. reported that pre-school children initiated on average 5·7 requests per shopping trip, of which a little less than one-third were considered healthy( Reference Calloway, Ranjit and Sweitzer 34 ). In the same study, the parents granted an average of 46 % of these requests. Thus, it can be argued that pre-school children can affect the foods available in the home.
In the present paper, we did not investigate the social food environment. Sociocultural factors (such as role modelling and parental restriction) have proved to be crucial influences. As van der Horst et al. have shown, these factors are even more consistently associated with dietary behaviour than home availability or accessibility( Reference van der Horst, Oenema and Ferreira 35 ). It is, however, hard to compare the roles of the physical and social home food environments due to their probable interdependence( Reference Ray, Määttä and Roos 36 ). Regarding the social food environment, previous studies have, for instance, found either no association( Reference Wyse, Campbell and Nathan 10 , Reference Pearson, Biddle and Gorely 13 , Reference Wang, Dalton and Schetzina 16 , Reference Couch, Glanz and Zhou 20 ) or an inverse association( Reference Shim, Kim and Lee 11 ) between restrictive food practices and children’s fruit and vegetable intake. Furthermore, it has been stated that restricting access to desired foods (‘overt’ control which is visible to the child( Reference Ogden, Reynolds and Smith 37 )) may lead to an increase in children’s eagerness to consume those foods( Reference Fisher and Birch 38 ). Thus, it can be concluded that not all restriction techniques are recommendable. Nevertheless, as Rosenkranz and Dzewaltowski noted, by controlling the home food availability (‘covert’ control which the child cannot detect( Reference Ogden, Reynolds and Smith 37 )), parents have the opportunity to influence the diets of their children without excessively restricting them( Reference Rosenkranz and Dzewaltowski 39 ). Our results support this claim as a lack of sugar-enriched foods in the home was associated with healthier diet among pre-school children.
In our sample, only a small amount of variance in dietary pattern scores was attributable to the pre-school level, probably due to the FFQ measuring only foods eaten outside pre-school. However, families living in the same area may have somewhat similar food practices and consumption norms, both influencing children’s dietary patterns. In addition, the neighbourhood socio-economic status may be associated with the children’s food behaviour. The policies and practices at the pre-schools can also affect children’s food intake in the home, justifying the use of multilevel analyses in our study. We intentionally measured only foods eaten outside pre-school hours, since most of the differences in the diets of Finnish pre-school children are probably due to foods eaten at home because of the municipally organized pre-school catering. In addition, the parents of the participating children would not have been able to assess the foods the children had eaten at pre-school. The positive impact of a healthy home food environment might also reach beyond the home: research indicates that adolescents who had more fruits available in their homes ate a more balanced school lunch( Reference Tilles-Tirkkonen, Suominen and Liukkonen 40 ). In addition, a healthy home food environment might also be associated with a lower BMI through its positive effects on a child’s diet( Reference Ong, Ullah and Magarey 41 ). Thus, future interventions and health promotion campaigns should emphasize the home food environment as a factor associated with healthy eating and health in general. In addition, these health promotion campaigns should offer parents the means to cope with food requests initiated by children while shopping with them and emphasize the importance of limiting the availability of unhealthy foods in the home.
Limitations
To our knowledge, no culturally appropriate FFQ with more detailed measurement of fruit and vegetable as well as sugar-enriched food intakes among 3–6-year-olds were available. Thus, we used a non-validated FFQ to measure food behaviour. However, since we used dietary pattern scores instead of single foods or food groups as outcomes, the effect of the possible misreporting is not likely to be substantial. Nevertheless, it is possible that misreporting, especially under-reporting, can attenuate possible associations between the exposure and the outcome, even though the dietary patterns themselves are not significantly altered by misreporting( Reference Markussen, Veierød and Ursin 42 ). Previously, parents’ income level has been found to be associated with misreporting of their children’s food consumption, with misreporting more frequent in low- and medium-income groups than in the high-income group( Reference Börnhorst, Huybrechts and Ahrens 43 ). In addition, socio-economic status may be associated with home food availability( Reference Zarnowiecki, Dollman and Parletta 44 ). The present study sample was quite highly educated which might have introduced some bias in our results. Furthermore, the sample eligible for analyses was somewhat more educated than the excluded participants and there were more boys among the excluded participants. This suggests that our data were not missing at random, which might have influenced the results. However, we adjusted for the family’s educational level in our models.
In the present study, we measured the home food availability with self-reported questions about the frequency of availability of fruits and vegetables as well as sugar-enriched foods. As van der Horst et al. stated, most of the studies reporting associations between the home food environment and dietary behaviours rely on self-reported data, making it hard to judge the validity and reliability of the results( Reference van der Horst, Oenema and Ferreira 35 ). However, the availability scores used in the present paper had acceptable Cronbach’s α (0·62 and 0·72) suggesting at least some reliability( Reference Lytle 45 ), although its validity could not be tested. In our study, the fruits and vegetables availability score was not associated with the sweets-and-treats pattern when entered in the model alone and became significant only when entered together with the sugar-enriched availability score. Such a change (increase in magnitude of the association between the independent and dependent variable after the statistical removal of a confounding effect) could indicate suppression( Reference MacKinnon, Krull and Lockwood 46 ). Hence, it may be concluded that they both are important dimensions of food availability and should be included in studies investigating food availability. Objective measurements of the home food availability would be somewhat challenging to arrange, taking account of the large and geographically diverse sample in the present study. One solution would be to use a proxy of home food availability by using purchase data from large national grocery store chains and their loyalty cards. This would also allow a wider approach when composing home food availability scores compared with our scores that were restricted to only two food categories: vegetables and fruits and sugar-enriched foods. Nevertheless, this kind of approach has its own pitfalls: it does not necessarily cover everything that is available in the home and the samples derived from customers of specific grocery store chains may be prone to selection bias.
Conclusions
In the present study, home food availability was associated with dietary patterns among Finnish children of pre-school age. In particular, the availability of sugar-enriched foods was associated with the sweets-and-treats pattern, whereas the availability of fruits and vegetables was associated with the health-conscious and vegetables-and-processed meats patterns. These results suggest that it is important to encourage families to build healthy home food environments, and especially to limit the availability and accessibility of sugar-enriched foods in the home.
Acknowledgements
Acknowledgements: The authors thank the pre-schools, the pre-school personnel and the families for their participation in the DAGIS study and the staff for data collection. Financial support: This work is part of the DAGIS Consortium Project funded by the Academy of Finland (decision numbers 285439, 288038, 287195 and 287288), Cultural Foundation/South Ostrhobothnia Regional Fund, Folkhälsan Research Center, Juho Vainio Foundation, Päivikki and Sakari Sohlberg Foundation, Signe and Ane Gyllenberg Foundation, Finnish Foundation for Nutrition Research and Finnish Food Research Foundation, and University of Helsinki. H.V.’s work was funded by Doctoral Programme in Population Health (DocPop), University of Helsinki. The funders had no role in study design; in the collection, analysis and interpretation of the data; in the writing of the report; or in the decision to submit the article for publication. Conflict of interest: Author L.Kor. is a board member of TwoDads Ltd; the authors declare no other relationships or activities that could appear to have influenced the present work. Authorship: H.V., L.Kor., R.L., C.R., K.N., E.R. and M.E. conceived the study and/or contributed to the planning and the design of the study. H.V., L.Kor., R.L., C.R., K.N. and E.S. collected the data and/or conducted data manipulation and analyses. V.M., M.F. and M.E. contributed to the statistical analyses. H.V. wrote the manuscript. L.Kor., V.M., R.L., C.R., K.N., E.S., M.F., L.Koi., E.R. and M.E. supplied comments. All authors read and approved the final manuscript. Ethics of human subject participation: This study was conducted according to the guidelines laid down in the Declaration of Helsinki and all procedures involving human subjects were approved by the University of Helsinki Review Board in the Humanities and Social and Behavioural Sciences in February 2015. A parent or legal guardian of each participant provided written informed consent.
Supplementary material
To view supplementary material for this article, please visit https://doi.org/10.1017/S1368980017003871


