


The metabolic syndrome (MetS) is a cluster of interrelated risk factors including hypertension, obesity, hyperglycaemia, hypertriacylglycerolaemia and low HDL-cholesterol( Reference Grundy, Brewer and Cleeman 1 ). A rapid increase in the prevalence of MetS from 24·9 % in 1998 to 37·0 % in 2012 has been found in Korea, becoming a major health issue( Reference Won, Chang and Niinuma 2 ). Besides, recent a cross-sectional study by Choi et al. reported that the prevalence of MetS was 11·4 % in Korean women( Reference Choi, Woo and Lee 3 ). In China, parallel with the development of the economy, the prevalence of MetS has also increased considerably from 13·7 % in 2000–2001 to 27·4 % in 2009–2010( Reference Song, Zhao and Liu 4 ). It is well known that MetS is a multifactorial disorder that may be associated with some risk factors, such as alcohol consumption, high salt intake, genetic factors and dietary factors( Reference Ambrosini, Huang and Mori 5 , Reference He, Li and Lai 6 ).
An emerging body of evidence has shown that diet plays an important role in developing MetS. Over the past several decades, some epidemiological studies have examined the association of MetS with the intakes of specific food groups, individual foods and nutrients( Reference Esmaillzadeh, Mirmiran and Azizi 7 , Reference Lim, Kim and Wang 8 ). However, nutrients or foods are not consumed in isolation but in numerous different combinations. In this context, dietary pattern analysis, which reflects the complexity of dietary intake, has emerged as an alternative and complementary approach to reporting the association of diet with the risk of chronic diseases that considers the complexity of overall diet and facilitates nutritional recommendations( Reference Zheng, Shu and Si 9 ).
Until now, many studies have been performed to verify the associations between dietary patterns and the risk of MetS worldwide( Reference Song, Zhao and Liu 4 , Reference He, Yang and Zhang 10 , Reference Gadgil, Anderson and Kandula 11 ). However, studies on the association between dietary pattern and the risk of MetS have reported inconsistent findings. Besides, to the best of our knowledge, data on dietary patterns in relation to the risk of MetS are sparse in China( Reference He, Yang and Zhang 10 , Reference Xu, Qiao and Huang 12 ), particularly among a middle-aged Chinese population. Therefore, the purpose of the present study was to identify the major dietary patterns existing in a Chinese population aged 45–59 years and to evaluate their associations with the risk of MetS.
Participants and methods
Study population
During August 2014 to December 2016, the current cross-sectional study was performed to collect data in a representative sample of Chinese adults aged 45–59 years selected by a multistage cluster random-sampling method. The participants were from Linyi, a prefecture-level city of Shandong Province, China, with a population of 11 million. The present study sample was taken from three areas (Lanshan, Luozhuang and Hedong) and nine counties (Lanling, Junan, Qishui, Tancheng, Mengyin, Pingyi, Feixian, Yinan and Linshu). We chose two residential villages or communities from each of these areas and counties, according to residents’ health records. Each participant provided written informed consent prior to enrolment. A total of 2374 eligible participants were invited to attend health screening examinations at the Medical Center for Physical Examination, Linyi People’s Hospital, where the participants were interviewed face-to-face by a trained interviewer using written questionnaires. First, 206 participants with a history of diabetes, CVD or stroke were excluded because of possible disease-related changes in diet. In addition, we also excluded the participants with missing information on dietary intake and anthropometric information, and who were taking medications that would affect serum lipoprotein concentrations, blood pressure and carbohydrate metabolism (n 250). Finally, a total of 1918 individuals (996 men and 922 women) remained for the present analysis of the associations between dietary patterns and MetS. The study protocol was approved by the Ethics Committee of Linyi People’s Hospital.
Assessment of dietary intake
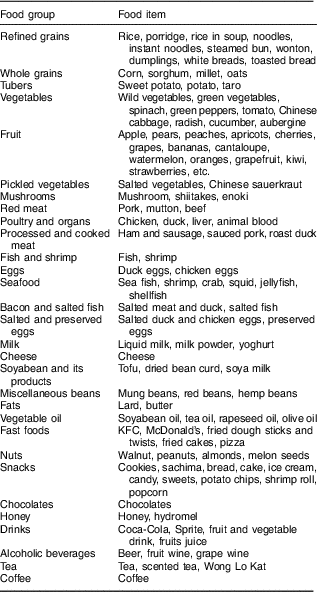
Face-to-face interviews were used to assess dietary intake using a validated semi-quantitative FFQ in which most foods consumed in Shandong Province were covered. The validity of the FFQ was evaluated by a pilot survey within a middle-aged Chinese population by comparison with three 24 h dietary recalls prior to the present study. The correlation coefficients between the FFQ and means from the 24 h dietary recalls ranged between 0·51 and 0·76 for major food groups. In brief, these data indicated that the FFQ provided reasonably valid measurements of dietary intakes. Participants were asked to report their frequency of consumption of a given serving of each food item during the previous year. Briefly, participants were asked to recall the frequency of consumption of each food item in the previous 12 months and the estimated portion size, using local weight units (e.g. 1 liang=50 g) or natural units (cups). For instance, the frequency response for food consumption included nine categories, as follows: never, less than once/month, 1–3 times/month, 1–2 times/week, 3–4 times/week, 5–6 times/week, 1 time/d, 2 times/d and 3 times/d; subsequently, individual food items were converted into a mean daily consumption. The 138 food items listed in the FFQ were divided into thirty food groups, each of which was based on the similarity of nutrients (Table 1).
Table 1 Food grouping used in the dietary pattern analyses
Identification of dietary patterns
The 138 food items in the FFQ were aggregated into thirty predefined food groups based on similarity of type of food and nutrient composition. The Kaiser–Meyer–Olkin measure of sample adequacy and the Bartlett test of sphericity were used to assess data adequacy for factor analysis. Factor analysis (principal component) was used to derive the major dietary patterns in the population based on the frequency of consumption of the thirty predefined food groups. The factors were rotated by an orthogonal transformation (varimax rotation) to achieve simpler structure with greater interpretability using the statistical software package IBM SPSS Statistics version 20.0. The number of retained factors was determined according to eigenvalue, scree plot and the interpretability of the factors( Reference Yakub, Iqbal and Iqbal 13 ). After evaluating the eigenvalues, scree plot and factor interpretability, factors with an eigenvalue of ≥1·5 were retained. In the present study, individual food items with an absolute factor loading of ≥0·4 were considered to contribute significantly to the pattern. Factor scores were categorized into quartiles (Q1 represented a low intake of this pattern; Q4 represented a high intake of this pattern).
Assessment of blood pressure
For blood pressure measurement, the participant was first asked to rest for 10 min. Then, a trained nurse measured the participant’s blood pressure three times using a standard mercury sphygmomanometer with the participant in the sitting position. Thereafter, the mean of three measurements was considered as the participant’s blood pressure.
Assessment of biomarkers
Blood samples were obtained after 12 h of fasting overnight. After blood was collected, the sample was allowed to clot at room temperature for 1–3 h and the serum was separated by centrifugation for 15 min at 3000 rpm. Then serum samples were analysed in the Medical Center for Physical Examination of Linyi People’s Hospital for fasting plasma glucose, total cholesterol, TAG, HDL-cholesterol, LDL-cholesterol, uric acid, alanine aminotransferase and aspartate aminotransferase using a Hitachi 7180 auto-analyser (Hitachi, Tokyo, Japan).
Assessment of anthropometric measurements
Each participant’s weight in light clothes and without shoes was measured using a digital scale to the nearest 100 g. Height was measured to the nearest 0·1 cm with the participant standing without shoes. BMI was calculated as weight (in kilograms) divided by the square of height (in metres). Waist circumference was measured halfway between the lower rib edge and the upper iliac crest by means of a metric measure with an accuracy of 1 mm( Reference Shu, Zheng and Zhang 14 ). All measurements were performed by nurses trained to use standardized procedures.
Assessment of other variables
Data on participants’ physical activity levels were obtained by using the International Physical Activity Questionnaire (IPAQ)( Reference Yu, Shu and Shen 15 ). The physical activity levels were expressed as metabolic equivalents of task (MET) hours per week, in which activities with different MET levels were ranged on a scale from sleep/rest (0·9 MET) to high-intensity physical activities (>6 MET). We calculated the physical activity level by multiplying the MET level of each reported activity by its duration (hours) in a week. The values obtained for various reported activities were added together and expressed as MET-h/week, which was then grouped into light, moderate and heavy( Reference Shu, Zheng and Zhang 14 ). Additional information such as smoking habits (never, current, former smoker), educational level (<high school, high school, >high school) was obtained with questionnaires. Besides, total energy intake was estimated through the FFQ, expressed in kilocalories per day and categorized according to quartile.
Definition of metabolic syndrome
According to the 2009 International Diabetes Federation criteria( Reference Alberti, Eckel and Grundy 16 ) and the Chinese-specific abdominal obesity standard in adults( Reference Xu, Qiao and Huang 12 ), participants who met at least three of the following conditions were defined as having MetS: (i) high TAG (i.e. serum TAG≥1·7 mmol/l); (ii) low HDL-cholesterol (i.e. serum HDL-cholesterol<1·0 mmol/l for males and <1·3 mmol/l for females); (iii) hypertension (i.e. systolic blood pressure ≥130 mmHg and/or diastolic blood pressure ≥85 mmHg or a history of hypertension); (iv) hyperglycaemia (i.e. fasting plasma glucose≥5·6 mmol/l or a diagnosis of type 2 diabetes mellitus); and (v) central obesity (i.e. waist circumference≥90 cm for males or ≥85 cm for females).
Statistical analyses
The general characteristics of study participants across quartile categories of the dietary pattern scores were calculated. Data are presented as mean values and standard deviations for continuous variables, and numbers and percentages for categorical variables. One-way ANOVA with Tukey’s post hoc comparison was performed to evaluate significant differences in general characteristics (e.g. gender, age, economic income, education level and physical activity) across quartile categories of the dietary pattern scores. Besides, we used the χ 2 test to assess the difference in categorical variables. After adjustment for potential confounders, OR and 95 % CI for MetS were calculated across the quartiles of dietary pattern scores using multivariate logistic regression analysis models. Model 1 was adjusted for sex and age; Model 2 was further adjusted for education level (<high school, high school, >high school), physical activity level (light, moderate, heavy), smoking status (never, current, former); Model 3 was additionally adjusted for total energy intake. All analyses were conducted using IBM SPSS Statistics version 20.0 and a two-tailed P<0·05 was considered statistically significant.
Results
Overall prevalence of MetS in our study population was 23·6 %, with 13·2 % among males and 10·4 % among females. General and clinical characteristics of participants with and without MetS are shown in Table 2. There were significant differences between participants with and without MetS according to age, education, economic income and prevalence of obesity and hypertension (P<0·05).
Table 2 General and clinical characteristics of middle-aged adults (n 1918) with and without metabolic syndrome (MetS) in the city of Linyi, Shandong Province, China, August 2014–December 2016
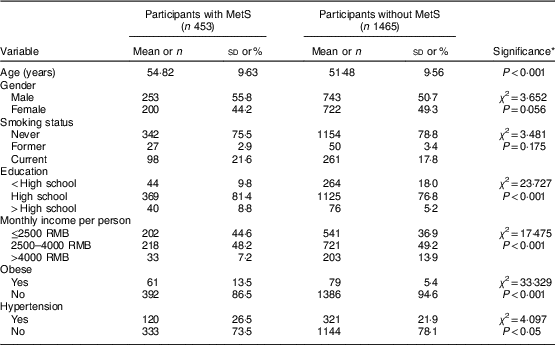
Continuous variables are presented as mean and standard deviation; categorical variables as number and percentage.
* P values are calculated using ANOVA for continuous variables; the χ 2 test for categorical variables.
Both the Kaiser–Meyer–Olkin index (0·703) and Bartlett’s test (P<0·001) indicated that the correlation among the variables was sufficiently strong for a factor analysis( Reference Shu, Zheng and Zhang 14 ). We identified three major dietary patterns by using factor analysis: the traditional Chinese dietary pattern (high in whole grains, tubers, vegetables, fruit, pickled vegetables, mushrooms, bacon and salted fish, salted and preserved eggs, soyabean and its products, miscellaneous beans, vegetable oil and tea), the animal food dietary pattern (high in red meats, poultry and organs, processed and cooked meat, fish and shrimp, eggs, seafood, alcoholic beverages and coffee) and the high-energy dietary pattern (high in refined grains, milk, cheese, fats, fast foods, nuts, snacks, chocolates, honey and drinks), which accounted 10·3, 7·5 and 5·2 % of the dietary intake variance, respectively. The factor loading matrices for these dietary patterns are shown in Table 3.
Table 3 Factor loading matrix for the three dietary patternsFootnote * found among middle-aged adults (n 1918) in the city of Linyi, Shandong Province, China, August 2014–December 2016
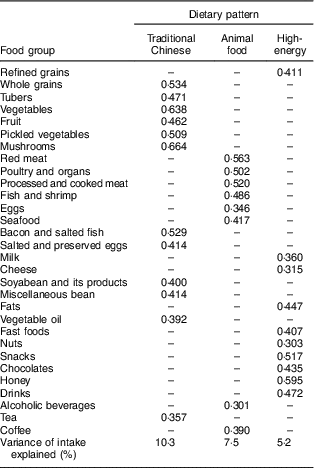
* Absolute values <0·4 were excluded for simplicity.
General characteristics of study participants across quartiles of the major dietary pattern scores are presented in Table 4. Compared with participants in the lowest quartile, those in the highest quartile of the traditional Chinese dietary pattern were more likely to be female, older, non-smokers, have a lower prevalence of obesity, hypertension and MetS, with a lower BMI, waist circumference and waist-to-hip ratio, and higher income. Moreover, in comparison with the participants from the lowest quartile of the animal food dietary pattern, those in the highest quartile were more likely to be younger, male, smokers, have a higher prevalence of obesity, hypertension and MetS, with a higher BMI and waist circumference. Similarly, participants who belonged to the highest quartile of the high-energy pattern were more likely to be younger, male, smokers, with a higher education level and prevalence of obesity than those in the lowest quartile.
Table 4 General characteristics of the middle-aged adults (n 1918) across quartile categories of the major dietary pattern scores, city of Linyi, Shandong Province, China, August 2014–December 2016
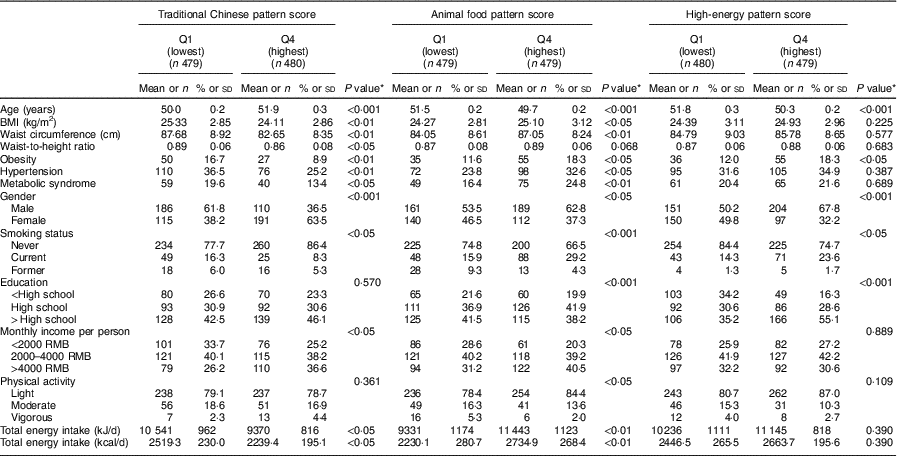
Continuous variables are presented as mean and standard deviation; categorical variables as number and percentage.
* P values are calculated using ANOVA for continuous variables; the χ 2 test for categorical variables.
OR for MetS across quartile categories of dietary pattern scores are shown in Table 5. After adjustment for several confounding factors, participants in the highest quartile of the traditional Chinese dietary pattern score had lower odds of MetS (OR=0·72, 95 % CI 0·596, 0·952, P<0·05) than those in the lowest quartile, whereas those in the highest quartile of the animal food dietary pattern score had greater odds of MetS (OR=1·28, 95 % CI 1·103, 1·697, P<0·05) than did those in the lowest quartile. However, no statistically significant association was observed between the high-energy dietary pattern and MetS.
Table 5 Multivariable-adjusted OR and 95 % CI for metabolic syndrome in the middle-aged adults (n 1918) across quartile categories of dietary pattern scores, city of Linyi, Shandong Province, China, August 2014–December 2016
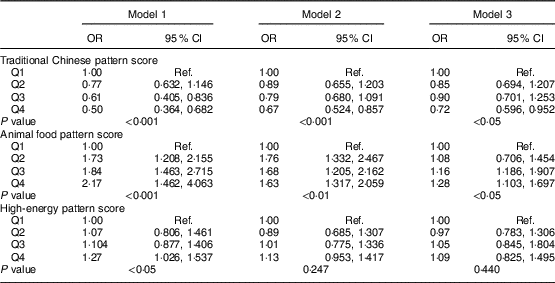
Q1, lowest quartile of dietary pattern score; Q4, highest quartile of dietary pattern score; Ref., reference category.
Model 1 adjusted for sex and age; Model 2 further adjusted for education level (<high school, high school, >high school), physical activity level (light, moderate, heavy), smoking status (never, current, former); Model 3 additionally adjusted for total energy intake.
Discussion
Overall prevalence of MetS in our study population was 23·6 %, with 13·2 % among males and 10·4 % among females. As stated in above, three major dietary patterns were identified in the present study population: the traditional Chinese, the animal food and the high-energy dietary patterns. The results indicated that the animal food pattern is associated with an increased risk, whereas the traditional Chinese pattern is associated with a decreased risk of MetS. Besides, no significant association was observed between the high-energy pattern and risk of MetS. To the best of our knowledge, the present study is the first among a middle-aged Chinese population to comprehensively evaluate the associations between major dietary patterns and the risk of MetS.
The traditional Chinese pattern identified in our analyses was associated with a significantly lower prevalence of MetS. Our findings are in line with previous studies( Reference Baik, Lee and Jun 17 ) which reported the favourable effect of the healthy dietary pattern on the prevention of MetS. The inverse association between the traditional Chinese pattern and risk of MetS could be attributed to this pattern’s healthy constituents (e.g. whole grains, fruits and vegetables). Higher intakes of whole grains, vegetables and fruits may increase the amount of dietary fibre. A number of studies in recent years have found that dietary fibre is inversely associated with insulin resistance, an important risk factor for MetS( Reference Musso, Gambino and De Michieli 18 ). Moreover, most foods (e.g. whole grains, tubers, vegetables, fruits and beans) in the traditional Chinese dietary pattern have a low glycaemic load, which has been documented to be associated with reduced risk of insulin resistance( Reference McKeown, Meigs and Liu 19 ). Furthermore, high intake of fruits and vegetables reducing the risk of MetS may be the result of lower C-reactive protein concentrations( Reference Williams, Prevost and Whichelow 20 ). Previous studies have shown that C-reactive protein concentrations are significantly associated with the risk of MetS( Reference Esmaillzadeh, Kimiagar and Mehrabi 21 ). The final possible mechanism for the protective effect of this pattern against MetS is that its constituents are good sources of antioxidants. Previous studies have indicated that antioxidants such as vitamin C, vitamin E and carotenoids that are abundant in fruits and vegetables can help to prevent oxidative stress, which is involved in the progression of MetS( Reference Kim and Choi 22 ).
In the present study, we found a positive association between the animal food pattern and risk of MetS. This finding is consistent with a previous study which indicated that the Western dietary pattern is associated with an increased risk of MetS( Reference Hosseini-Esfahani, Mirmiran and Daneshpour 23 ). Besides, a cross-sectional study performed in South Korea also demonstrated that the meat dietary pattern was significantly associated with increased MetS risk( Reference Woo, Shin and Kim 24 ). There are several possible explanations for the positive association. First, high consumption of meat containing large amounts of saturated fat and cholesterol is positively associated with obesity, hypertension and dyslipidaemia, all of which factors have been shown to be associated with the risk of MetS( Reference Shu, Zheng and Zhang 14 ). Second, red meat intake is related to the storage of Fe, while Fe overload has been documented to be associated with increased risk of insulin resistance( Reference Sun, Franco and Hu 25 ). Previous studies indicated that individuals with MetS had a significantly higher prevalence of Fe overload than those without MetS( Reference Bozzini, Girelli and Olivieri 26 ). Moreover, higher meat consumption may also be related to inflammation( Reference Azadbakht and Esmaillzadeh 27 ), which appears to be involved in pathophysiology of MetS( Reference Welty, Alfaddagh and Elajami 28 ). Some authors have reported that inflammation markers (e.g. IL-6 and C-reactive protein) are associated with an elevated risk of MetS( Reference Yan, Ma and Ding 29 , Reference Wickramatilake, Mohideen and Pathirana 30 ). Third, processed meat often contains large amounts of salt. An emerging body of evidence has proved that high salt intake is associated with an elevated risk of hypertension( Reference Brown, Tzoulaki and Candeias 31 ). Furthermore, the animal food pattern may be closely related to a high intake of alcohol in the present study. In a prospective cohort study of 3833 males and females in Korea, heavy drinking has been reported to be positively associated with MetS and its components( Reference Baik and Shin 32 ).
In our analyses, we did not observe a significant association between the high-energy dietary pattern and MetS. Our results are not in agreement with previous studies, which demonstrated a significant relationship between the high-salt and energy pattern and risk of MetS( Reference Xu, Qiao and Huang 12 ). There are several possible explanations for the null association between our high-energy dietary pattern and the risk of MetS. First, some foods (e.g. refined grains, snacks, chocolates and honey) in this pattern have a high glycaemic index, which has been reported to be associated with an increased risk of MetS( Reference Juanola-Falgarona, Salas-Salvado and Buil-Cosiales 33 ). Second, high carbohydrate intake may also contribute to excess energy, which has been documented to be related to insulin resistance( Reference Feng, Du and Chen 34 ). Nevertheless, in contrast to other studies, the participants in the present study were a group of Chinese adults aged between 45 and 59 years, who consumed less of these foods, especially the high-energy diet. Furthermore, the null association could also be due to reverse causality. In health screening examination, study participants with risk of MetS may have been advised to change their dietary habits and lifestyles, such as limiting the intake of high-energy foods. These possibilities cannot be excluded in the present cross-sectional study.
Strengths and limitations
The present study holds several strengths. First, to our knowledge, it is the first study to report the association between major dietary patterns and the risk of MetS among middle-aged adults in the city of Linyi, Shandong Province, China. It underscores a potential role of dietary modification in the prevention of MetS. Second, face-to-face interviews were used to assess dietary intake using a validated semi-quantitative FFQ, in which most foods consumed in Shandong Province were covered. This tool enabled us to capture more reliable information on usual dietary intake of individuals during the past year. However, several limitations of our study warrant mention. First, due to the cross-sectional study design, a cause-and-effect relationship cannot be established from the findings of the present study. Besides, the limitations of the cross-sectional study design in nutrition research, such as recall and selection bias, warrant caution in interpreting the results. Hence, our findings should be verified in a future prospective study. Second, the principal component analysis require some subjective decisions (e.g. determining the number of factors to be retained, food grouping methods and the labelling of dietary patterns)( Reference DiBello, McGarvey and Kraft 35 ). Third, although some confounding factors have been adjusted for in our analyses, we cannot rule out unmeasured or residual confounding. Finally, our findings may not be generalizable to other age groups because our study population included only middle-aged Chinese.
Conclusions
Regardless of these limitations, our findings indicate that the traditional Chinese pattern is associated with reduced risk, while the animal food pattern is associated with a greater risk of MetS in a middle-aged Chinese population. Nevertheless, additional prospective studies are needed to confirm the associations between dietary patterns and MetS.
Acknowledgements
Acknowledgements: The authors thank all participants from the Department of Endocrinology, Linyi People’s Hospital, for their assistance and support. They also acknowledge the Medical Center for Physical Examination, Linyi People’s Hospital, for its important contributions to collection of data in this study. Financial support: This research received no specific grant from any funding agency in the public, commercial or not-for-profit sectors. Conflict of interest: The authors declare that there is no conflict of interests. Authorship: Z.-Y.W. and Y.-Y.Z. contributed to the study design. J.-J.L., X.-M.Z. and H.-M.F. performed the statistical analysis for the manuscript and drafted the paper. All authors contributed to a critical review of the manuscript during the writing process. Ethics of human subject participation: This study was conducted according to the guidelines laid down in the Declaration of Helsinki and all procedures involving human subjects were approved by the Ethics Committee of Linyi People’s Hospital. Written informed consent was obtained from all subjects prior to enrolment.


 Open access