


Dietary fat is an essential macronutrient in our diet which plays an important role within the body. It acts as an energy substrate, facilitates the absorption of fat-soluble vitamins, is a vital component of cell membranes and provides protection and insulation of internal organs(Reference Calder1,Reference Berg, Tymoczko and Stryer2) . Nevertheless, imbalances in the amount and types of dietary fat consumed have been associated with an increased risk of chronic diseases such as CVD, type 2 diabetes mellitus and some cancers(Reference Schwab, Lauritzen and Tholstrup3). Although presented later in life, many of these chronic diseases stem from prolonged unhealthy dietary behaviours which may have developed in childhood(Reference Birch, Savage and Ventura4).
The evidence surrounding dietary fat and its association with chronic disease risk is widely recognised and as such, dietary fat guidelines have been established by public health organisations to aid public health campaigns in disease prevention(5–7). However, dietary recommendations specific to children are not so clear. The variation in cut-offs for dietary fat recommendations between countries creates a challenge when trying to assess and compare global dietary fat intakes and compliance in children. The FAO of UN and WHO recommend that total fat intakes should be between 25 and 35 % of total energy (% TE) intake for children from 2 years of age onwards(5). They also recommend that SFA and trans fat should be < 8 and 1 % TE, respectively, whereas PUFA should be more than 11 % TE. While the European Food Safety Authority have set a similar range for total fat intakes in children (20–35 %), they suggest that intake of SFA and trans fat should be as low as possible(6). In addition, they provide no recommendation for total PUFA intakes, but they have set a combined recommendation of 250 mg/d for n-3 fatty acids, EPA and DHA(6).
Even though differing guidelines are widely used, many studies have shown that children rarely adhere to recommendations in terms of dietary fat. Harika et al. published a comprehensive review comparing dietary fat intakes in children and adolescents across thirty countries worldwide, revealing that of the countries surveyed, 90, 93 and 70 % did not meet the recommendations for total fat, SFA and PUFA, respectively(Reference Harika, Cosgrove and Osendarp8). These compliance rates are similar to those previously reported in Irish children in 2005, with greater compliance noted for total fat (88 %), whereas SFA and PUFA adherence was low at 6 and 47 %, respectively(Reference Joyce, Wallace and McCarthy9).
Such deviations have led to a number of public health campaigns and government-industry partnerships to help improve consumers’ dietary fat profile(10,11) . For example, reformulation approaches have been carried out to reduce trans fat intakes in the Irish population(12). Since it is unknown whether some of these past initiatives have successfully influenced children’s fat consumption, it is essential to examine dietary intakes to assess compliance with current dietary guidelines. This will help to identify areas for improvement and subsequently develop focused interventions for those at high risk of developing poor dietary habits(Reference van der Velde, Nguyen and Schoufour13). Therefore, the aims of this study were to first examine current intakes of total fat and fatty acid constituents; second, to measure compliance with recommendations and lastly to compare with previous data in order to examine changes in dietary fat intakes over time.
Methods
Study design and populations
This analysis is based on data from two cross-sectional national nutrition surveys which examined the habitual food and beverage intake of Irish children aged 5–12 years residing in the Republic of Ireland. The NCFS (2005) and the NCFS II (2019) are composed of data from 594 (293 boys, 301 girls) and 600 (300 boys, 300 girls) children, respectively(14,15) . Recruitment was carried out for the NCFS between March 2003 and March 2004 and for the NCFS II between April 2017 and May 2018. The selection and recruitment process were based on the relevant national population census data(16,17) , and participants were recruited from primary schools drawn from the Department of Education and Skills’ database(18). Pupils in the schools were randomly selected to be contacted about the surveys. The overall response rates for the NCFS and NCFS II were 63 and 65 %, respectively. The rates refer to the percentage of respondents who completed the study upon invitation. There were no exclusion criteria aside from being a sibling to another participant. Analysis of the demographic profile of participants of both surveys demonstrated a representative sample of Irish children with respect to age, gender and geographical location(16,17,19) (see online supplementary material, Supplemental Table 1). The NCFS was representative of social class; however, the NCFS II sample contained a higher proportion of children of professional workers and a lower proportion of children of semi-skilled and unskilled workers than the national population. Therefore, statistical weighting was applied to all data in the NCFS II to account for these social class differences.
Data collection
A consecutive 7-day (NCFS) and 4-day (NCFS II) weighed food diary was used to collect food and beverage intake data. Data collection protocol was identical across both surveys, with the 4-day food diary requiring the inclusion of at least one weekend day in order to account for differences in children’s eating habits between weekdays and weekends. Participants were visited by a researcher in their home on approximately three occasions during the recording period. Training was given during the initial visit to ensure accuracy of the food records. They were provided with a weighing scales and asked to record detailed information regarding the amount and types of all food and beverage intake, including nutritional supplements consumed. The parents and/or guardians typically recorded the food and beverages consumed on behalf of their child. Although, some of the older children recorded their own consumption with assistance from their parents and/or guardians. A food quantification protocol was established by the Irish Universities Nutrition Alliance and adapted for both the NCFS and NCFS II(Reference Harrington, McGowan and Kiely20). Information such as cooking methods, brand names of foods, recipe details, eating locations and participant definitions of eating occasions was recorded. Food packaging was also collected to provide additional information of the foods consumed. This level of detail meant that most meals consumed outside of the home could be traced back to the supplier for further information, i.e. ingredients, nutritional information and food weight. For unweighted and non-branded foods, a food atlas was utilised to estimate portions of the food consumed. Further details about this protocol can be found on www.iuna.net. The remaining visits were to review the food diary to ensure completion of the 7-day or 4-day food diaries, respectively, and to check for overall survey completeness.
Food intake data in the NCFS were analysed using WISP© (Tinuviel Software, Anglesey, UK). WISP© contains data from McCance and Widdowson’s The Composition of Foods, fifth(Reference Holland, Welch and Unwin21) and sixth(22) editions plus all nine supplemental volumes(Reference Holland, Unwin and Buss23–Reference Chan, Brown and Church31) to generate nutrient intake data. In the NCFS II, food intake data were analysed using Nutritics (Nutritics, Dublin, Ireland) which contains data from McCance and Widdowson’s The Composition of Foods, sixth(22) and seventh(Reference Finglas, Roe and Pinchen32) editions. Food composition databases were generated from each survey, listing each individual food item consumed by participants. Each food item was listed with its corresponding nutrient composition. Modifications were made to the food composition database to include recipes of composite dishes, nutritional supplements, generic Irish foods that were commonly consumed, reformulated foods and new foods on the market.
Estimation of fatty acid composition
Updates were required for the fatty acid of certain foods contained in the NCFS and NCFS II food intake databases, due to outdated concentrations of certain fatty acids composition (total fat, SFA, MUFA, PUFA, trans fat, n-6, n-3, alpha-linolenic acid (ALA), EPA and DHA). The databases were updated by means of a comprehensive methodology providing reliable estimates of dietary intakes of the fatty acids. A similar protocol was utilised in previous Irish national surveys(Reference Leite, Hearty and Nugent33). An SPSS database was created containing all foods consumed, including recipes. Each food was assigned a unique food code. All food codes, including recipes, were examined and a fatty acid concentration was assigned to each. A number of data sources were used to update the concentrations such as current published food composition tables (56·8 %), published papers (1·2 %) and brand information (0·8 %)(22,Reference Finglas, Roe and Pinchen32–36) .
Calculating fatty acid intakes in Irish children
Total fat, SFA, MUFA, PUFA, n-6, n-3, EPA, DHA and trans fat values [grams (g)/100 g] were estimated in 1945 foods and recipes for NCFS (2005) and 2046 foods and recipes for NCFS II (2019). ALA values were not available for NCFS and therefore were only estimated for NCFS II. All estimated entries were rechecked by the researcher and, subsequently, a random selection was rechecked by another researcher to reduce the chance of error. Each fatty acid concentration was converted from g/100 g of food to the actual amount of fatty acid consumed per day (g/d). Usual intakes of nutrients were estimated using the validated NCI method(Reference Tooze, Kipnis and Buckman37) with SAS Enterprise Guide© software, version 7.1 (www.riskfactor.cancer.gov/diet/usualintakes/macro.html).
Statistical analysis
Statistical analyses were conducted using SPSS® V24.0 for Windows™ (SPSS Inc.). Descriptive statistics including mean and sd were calculated in both surveys for daily total fat, SFA, MUFA, PUFA, n-6, n-3, trans fat, ALA, EPA and DHA intakes (g/d and %TE) for the total population and by gender and age group. Independent sample t tests were performed to compare fatty acid intakes between groups such as survey, gender and age. Compliance with UK(7,38) and European Food Safety Authority(6) dietary fat intake recommendations was assessed using the approach described by Wearne and Day(Reference Wearne and Day39). Each food was aggregated into one of twenty-six food groups, based either on its predominant fat profile or associated food-based dietary guidelines(Reference Krebs-Smith, Kott and Guenther40,Reference Li, McNulty and Tiernery41) (see online supplementary material, Supplemental Table 2). The percentage contribution of each food group to total fat and fatty acid constituents was then calculated. The Bonferroni correction method for multiple comparisons was utilised and significance for all statistical analyses was classified as P ≤ 0·05.
Results
Intakes of dietary fat
Table 1 presents the mean intakes of total fat and constituent fatty acids (g/d and % TE) from the NCFS II in 2019. Intakes of total fat, SFA, MUFA and trans fat (% TE) in the total population were 33·3, 14·0, 13·6 and 0·5 %, respectively. The % TE from PUFA was 5·6 %, of which 3·6 % was contributed by n-6 and 0·7 % by n-3. Within n-3 fatty acids, ALA, EPA and DHA were 0·6, 0·03 and 0·04 % TE, respectively. Significant differences between gender and age group were also identified across all fatty acids in g/d and % TE with higher intakes of all fats (g/d) being consumed by the older cohort (9–12 years) and by boys of all ages (P < 0·001).
Table 1 Intakes of total fat intake (g or mg/d and % of total energy (% TE)) and its constituent fatty acids in Irish children in 2019
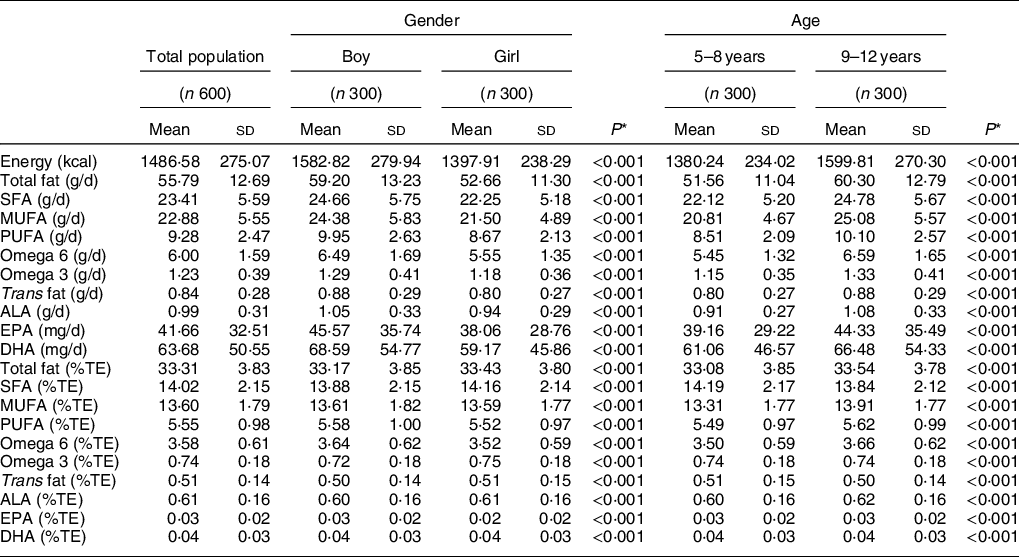
n, number of participants; n-6; omega 6; n-3, omega 3; ALA, alpha-linolenic acid; g/d, grams per day; %TE – percentage of total energy.
* Independent samples t test for comparison of means between gender and age, adjusted P value using Bonferroni correction method for multiple comparisons was also utilised.
Comparisons between intakes of total fat and constituent fatty acids (g/d and % TE) in the NCFS (2005) and NCFS II (2019) are displayed in Table 2. Overall, no significant changes were apparent for intakes of total fat, which remained similar at 34 and 33 % TE between 2005 and 2019, respectively. Intakes of SFA and trans fat decreased slightly from 14·5 to 14·0 % and 0·53 to 0·51 % TE, respectively, whereas MUFA, PUFA, n-6, n-3, EPA and DHA presented significant increases of 2·1, 0·6, 0·5, 0·1, 0·02 and 0·02 % TE, respectively. Similar trends were observed across gender.
Table 2 Comparison of total fat intake (g or mg/d and % of total energy (% TE)) and its constituent fatty acids in Irish children in 2005 and 2019 by gender
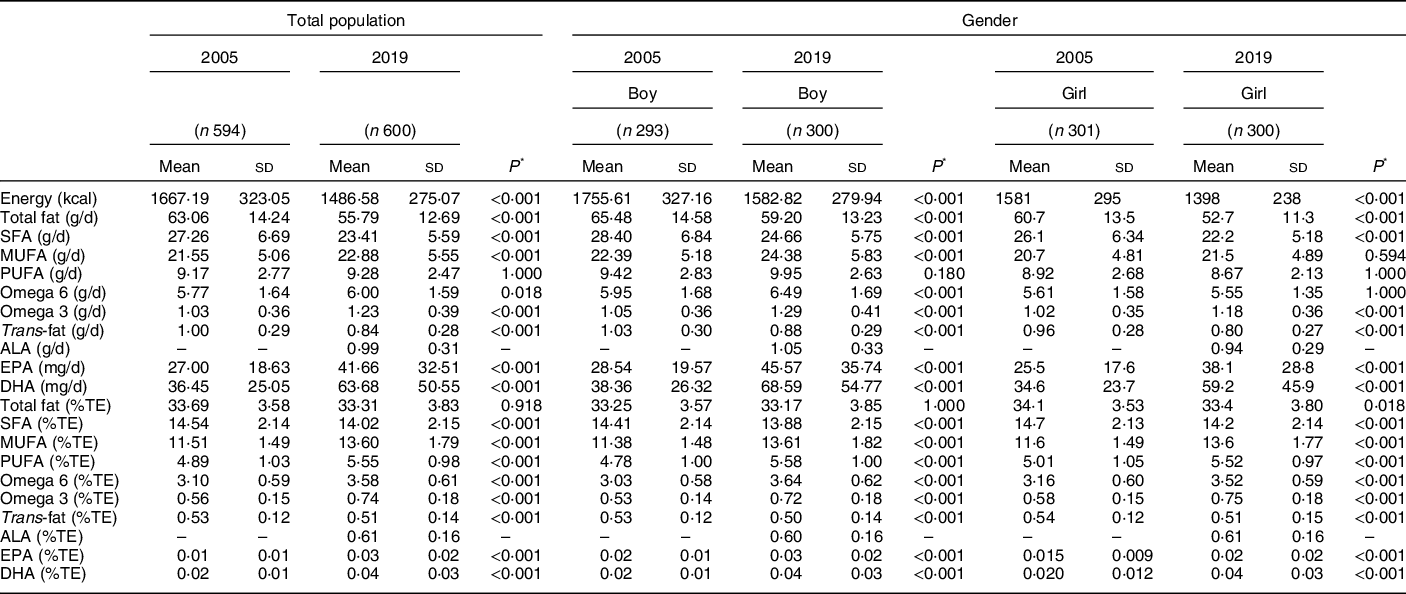
n, number of participants; n-6, omega 6; n-3, omega 3; ALA, alpha-linolenic acid; g/d, grams per day; %TE – percentage of total energy.
* Independent samples t test for comparison of means between 2005 and 2019 split by gender, adjusted P value using Bonferroni correction method for multiple comparisons was also utilised.
Percentage contribution of food groups to dietary fat
The percentage contribution of food groups to dietary fat is presented in Tables 3a and b. In 2019, ‘meat products’, ‘biscuits cakes, pastries and buns’ and ‘whole milk’ were among the top sources of total fat, SFA and MUFA, contributing overall 31·5, 27·9, and 27·3 %, respectively. Whilst similar in 2005, these collective contributions from the food groups were slightly higher at 38·0, 32·3, and 31·3 %, respectively (Table 3). The top contributors to PUFA intake in both 2005 and 2019 were ‘breads and rolls’ (10·9 %) and ‘meat products’ (9·8 %). Current major food sources of EPA and DHA are ‘fish, fish products and fish dishes’ (25·3 %), ‘fresh meat’ (19·3 %) and ‘whole milk’ (11·8 %), which has remained consistent since 2005 (Table 4). Nutritional supplements featured as a source of EPA and DHA; however, they did not make a substantial contribution to intakes (1·9 %). Primary sources of trans fat intakes were ‘meat dishes’, ‘whole milk’ and ‘cheeses’ in 2005 and 2019 with overall contributions from these food sources increasing from 33·1 to 38·7 % over time. ‘Meat products’ (10·9 %) were the greatest contributing foods to ALA intakes in 2019, as well as ‘spreading fats and oils’ (10·1 %). Of note, significant reductions in the contribution of dairy products to fatty acids are observed from 2005 to 2019, particularly for ‘whole milk’, ‘low-fat spreads’ and ‘ice-cream and creams’. Despite these reductions, ‘whole milk’ still remains one of the top contributors across a number of the fatty acids examined, contributing from 6·9 to 15·5 % TE to total fat, SFA, MUFA, EPA, DHA and trans fat intakes. In contrast, ‘low fat, skimmed and fortified milks’, ‘cheeses’ and ‘butter’ presented significant increases in their contributions, ranging from 0·1 to 14·4 %. Furthermore, the contribution of ‘biscuits, cakes, pastries and buns’ also significantly increased across all fatty acids over time.
Table 3 Percentage contribution of food groups to total fat, SFA, MUFA and PUFA intakes in Irish children in 2005 and 2019
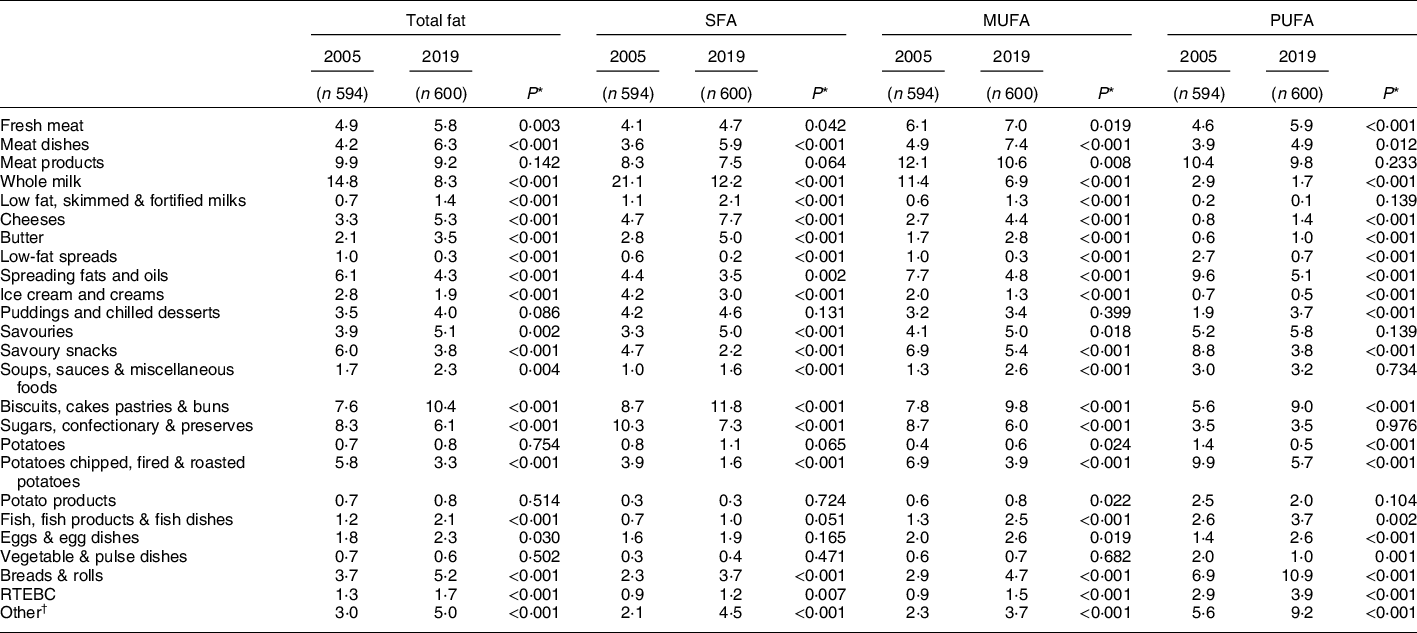
n, number of participants; RTEBC, ready-to-eat breakfast cereals.
* Independent samples t test for comparison of means between 2005 and 2019.
† Other food groups include rice, pasta, flours, grains, other breakfast cereals, non-alcoholic beverages, nuts and seeds, herbs and spices, fruit, vegetables, other milk and milk-based beverages.
Table 4 Percentage contribution of food groups to alpha-linolenic acid (ALA), EPA, DHA and Trans fat intakes in Irish children in 2005 and 2019
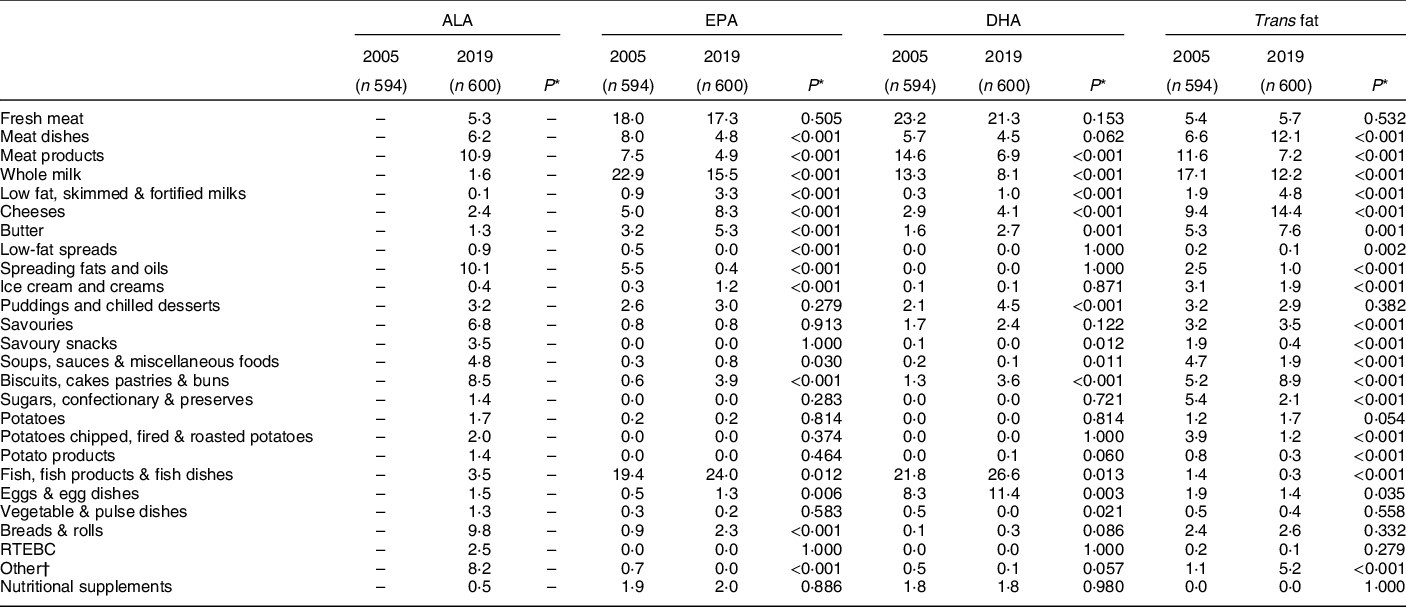
n, number of participants; RTEBC, ready-to-eat breakfast cereals.
* Independent samples t test for comparison of means between 2005 and 2019.
† Other food groups include rice, pasta, flours, grains, other breakfast cereals, non-alcoholic beverages, nuts and seeds, herbs and spices, fruit, vegetables, other milk and milk-based beverages.
The percentage of Irish children adhering to dietary fat recommendations at a population level
The proportion of children adhering to dietary fat recommendations (% TE) for each fatty acid as a percentage of the total population is illustrated in Fig. 1. In 2005, a high level of population compliance with the recommendations for total fat (100 %) and trans fat (100 %) was observed, which continued in 2019. Compliance with MUFA recommendations has shown improvements from 81 to 100 %. SFA adherence in 2005 was low at 4 % showing only a slight improvement at 7 %. Although the level has improved, the current rate still remains low at 7 % in 2019. The proportion of children meeting PUFA recommendations was 71 % in 2019 which is an increase of 36 % since 2005. Adherence to EPA and DHA recommendations in the overall population increased from 2 to 16 % between 2005 and 2019. When stratified by gender, compliance across all fatty acids examined was similar to that reported in the total population.

Discussion
Over the last 14 years, improvements to the overall dietary fat profile in Irish children have been observed. The current findings demonstrate that Irish children continue to achieve total fat and trans fat recommendations (100 %), while adherence to MUFA recommendations has successfully improved to 100 %. However, despite these improvements, deviations from the recommendations for SFA, PUFA, EPA and DHA remain with only 7, 71 and 16 % of the population adhering to these recommendations, respectively.
Changes in the dietary fat intakes of Irish children in the current study are in line with those observed in other European countries(Reference Pot, Prynne and Roberts42,Reference Libuda, Alexy and Kersting43) . In a cross-sectional study of German children, dietary fat intakes examined over a 10-year period noted a slight decrease in total fat and SFA, decreasing from 35 to 34 % and from 16 to 15 %, respectively, whilst MUFA and PUFA intakes remained stable at 14 and 5 %, respectively(Reference Libuda, Alexy and Kersting43). However, compliance with SFA and PUFA recommendations was extremely low (3 and 8 %, respectively), similar to the findings in the current analysis. In contrast, temporal trend analysis carried out in a cohort of Chinese children observed dietary fat intakes steadily increased between the years 1991 and 2009, as well as the proportion of energy from fat(Reference Cui and Dibley44). The authors suggest that these increases may be the result of an accelerated nutrition transition to a high-fat, Western diet. However, it is important to note that these intake data were collected over 10 years ago and therefore, dietary fat intakes may have since changed further.
SFA intakes in Irish children (14 % TE) are similar to intakes in children across Europe and America(6,45) . The highest SFA intakes in Europe were found in Danish girls aged 4–5 years at 16 % TE, whereas Italian males aged 7–9 years had the lowest at 9·4 % TE(6). A comprehensive review which investigated compliance to dietary fat recommendations by children across the WHO European region found that children in all eighteen countries examined exceeded the WHO SFA recommendation of < 10 % TE(Reference Rippin, Hutchinson and Jewell46). SFA compliance in neighbouring UK children was reported by Pot et al. who demonstrated that the proportion of children aged 4–10 years meeting the UK SFA guideline of < 11 % TE was 14 %(Reference Pot, Prynne and Roberts42). To note, although this is higher than the compliance rate reported in Irish children (7 %), it remains extremely poor. Moreover, if the authors examined SFA compliance based on current SFA cut-offs (< 10 % TE), compliance would undoubtedly be lower in UK children. The evidence linking elevated SFA intakes to CVD risk is irrefutable and the extreme low levels of SFA compliance observed in children across the globe highlights the severity of the issue. Therefore, it is imperative that strategies are devised to reduce SFA intakes in children in order to reduce the risk of CVD and other chronic diseases in later life.
The main food sources of SFA in Irish children continue to be ‘whole milk’, ‘biscuits, cakes, pastries and buns’, ‘meat products’ and ‘cheeses’, which are similar to the food sources of SFA in Irish adolescents, as well as ‘sugars, confectionary and preserves’(Reference Joyce, Wallace and McCarthy9). In addition to ‘cheeses’ and ‘meat products’, the top sources contributing to Irish adult SFA intakes include ‘fresh meat’ and ‘spreading fats and oils’(Reference Li, McNulty and Tiernery41). Dairy and meat products are among the overall top contributors of SFA across many European countries and the USA, which is in agreement with the current findings(Reference Reedy and Krebs-Smith47–Reference Eilander, Harika and Zock49). Despite a 9 % reduction in SFA from whole milk since 2005, it remains the top contributor to SFA intakes in Irish children. Nevertheless, this decrease observed in the contribution of whole milk and the increase observed in low-fat milk across all fatty acids may reflect a change in dietary habits. Potentially, adherence to dietary guidelines advocating the consumption of low-fat over whole milk has improved. Although, given the body of evidence in support of the dairy food matrix, whereby interactions between its food components are thought to potentially alter the properties of the nutrients, SFA from dairy products may not be a cause for concern as emerging evidence suggests it could be beneficial in terms of cardiovascular health(Reference Thorning, Tholstrup and Astrup50). On balance, intakes of overall milk have reduced and whole milk intakes have not been compensated for despite increases in low-fat milk(15), which could have implications for intakes of other nutrients such as calcium and iodine.
The current intakes of trans fat have decreased by 0·02 % TE since 2005 and remain within the recommendation of less than 2 % TE(7,38) . Few countries provided data for trans fat intakes in children; of the countries that have (n 4), intakes ranged between 0·6 and 1·8 % of TE(6) which is higher than the 0·5 % reported in the present study but still within the general recommendation. As expected, the main contributions to trans fat in the diet of Irish children are derived from animal-based products such as dairy and meat. However, an increase in the contribution of ‘biscuits, cakes, pastries and buns’ has resulted in this food group becoming the 4th contributor. While there is the possibility that the trans fat composition of these food products has increased, the considerable efforts over the years to reduce industrial sources of trans fat in Ireland deem this unlikely(12). As the increase is reflected across all fatty acids, it is more likely due to increases in the consumption of these products.
The intakes of PUFA in Irish children (5·6% TE) are similar to European intakes (4–9 % TE)(6) and although the adherence level to PUFA intake recommendations has increased from 60 to 71 %, further improvement is warranted. Some of the main food sources of PUFA in Irish children include ‘biscuits, cakes, pastries and buns’ and ‘meat products’, which are also significant contributors of SFA intakes. Therefore, promoting a reduction in these foods to improve SFA intakes could have unfavourable consequences for PUFA intakes. This demonstrates the complexities of devising strategies to improve the dietary fat profile within a population. In addition, EPA and DHA intakes (105 mg/d combined), which includes intake from nutritional supplements, are considerably lower than the adequate intake of 250 mg/d proposed by European Food Safety Authority(6). Similar low adherence was found in children from other European countries such as France (6–10 years; 154 mg/d), Belgium (4–6 years; 75 mg/d) and Germany (4–12 years; 62–85 mg/d)(Reference Sioen, Huybrechts and Verbeke51–Reference Guesnet, Tressou and Buaud53). Given the health benefits of EPA and DHA such as supporting brain function and cognitive development in children(Reference Uauy and Dangour54), as well as their potential role in CVD prevention(Reference Guesnet and Alessandri55), this pattern of low adherence to EPA and DHA guidelines may signify a greater global issue of insufficient n-3 intakes in children. The two major contributors to EPA and DHA intakes in the current study were ‘fish, fish products and fish dishes’ and ‘fresh meat’, which are in line with the main contributors reported in Irish adults(Reference Li, McNulty and Tiernery41), as well as those reported in the UK(Reference Pot, Prynne and Roberts42) and other countries(Reference Sioen, Huybrechts and Verbeke51,Reference Guesnet, Tressou and Buaud53,Reference Rahmawaty, Charlton and Lyons-Wall56,57) . However, the consumption of these foods, in particular fish, is typically below the recommended dietary guidelines(Reference Sichert-Hellert, Wicher and Kersting52,Reference Kranz, Jones and Monsivais58) . This can be due to cultural food practices and preferences, denoting that other dietary sources may be required to increase EPA and DHA intakes.
Although intakes of particular subtypes of dietary fat are deemed inadequate, namely SFA and overall PUFA, total fat intakes remain in line with total fat recommendations. The mean total fat intake in Irish children is 33 % TE, with no significant changes in intake noted since 2005. These intakes are similar to the total fat intakes reported in children and adolescents across Europe, which range between 28 and 42 % TE(6). Rippin et al. found that total fat compliance to recommendations for intake of total fat was particularly poor in Europe, as children in only two of the eighteen European countries examined had intake levels below the WHO recommended maximum value of ≤ 30 % TE(Reference Rippin, Hutchinson and Jewell46). Furthermore, in the UK, only 47 % of children complied with UK recommendations of total fat intake (≤ 33 % TE)(Reference Pot, Prynne and Roberts42). However, as the most recent cut-off stands at ≤ 35 % TE, increases in the percentage of UK children complying with the current recommendation are likely(6,38) . It is worth noting that if the UK or WHO guidelines were used as the cut-off in the current study, the mean intake of total fat in Irish children would exceed both recommendations.
The current analysis has many strengths such as the high quality of dietary data derived from weighed food records collected for both national food consumption surveys. Furthermore, data were obtained from current food composition tables and databases, brand information and published papers to ensure the most up-to-date fatty acid concentrations were assigned to all foods contained in the food consumption database and to achieve the most accurate estimates of fatty acid intake. Further considerations to assess usual intakes in this paper also provided more accuracy for estimating nutrient intakes. This method of estimation observes the long-term nutrient and dietary intake rather than the reported intake over a few days. Therefore, this method permits direct comparative analysis across the two surveys, irrespective of the different number of recording days (7-day and 4-day) without compromising the study results. However, due to the self-reporting nature of these dietary assessments, this study may be limited due to under-reporting. Albeit the levels of under-reporting have decreased from 33 % in 2005 to 20 % in 2019 (data not shown), under-reporters were not excluded from the analysis. Although the methodologies in both surveys are similar due to their cross-sectional design, the comparative data are limited for evaluating the effectiveness of public health initiatives compared with longitudinal trend analysis.
In conclusion, improvements have been made to the dietary fat profile of Irish children over the last number of years, with slight reductions observed in SFA and trans fat intakes and increases detected across all reported unsaturated fats. Nevertheless, while progress has been made, adherence to SFA, PUFA, EPA and DHA recommendations remains inadequate and, therefore, improvements need to be made to the quality of dietary fat consumed. In the past, food reformulation has played a significant role in the success of limiting the consumption of trans fat. Therefore, further considerations to reformulate foods could have a positive impact on fatty acid intakes, particularly in the context of SFA and PUFA. Considerations should also be made to promote foods containing a more favourable dietary fat profile. However, caution is warranted when considering strategies to promote individual nutrient recommendations and perhaps a holistic dietary approach would be more effective.
Acknowledgements
Acknowledgements: The authors gratefully thank all participants who took part in this study and all IUNA team members and colleagues who contributed to survey data collection and entry. Financial support: This study was funded by the Irish Department of Agriculture, Food and the Marine (DAFM) under the 2015 Food Institutional Research Measure (FIRM) awards (grant no. 15/F/673). Conflict of interest: None. Authorship: A.O’C. and B.M.N. analysed and interpreted the data and wrote the manuscript. M.B. and L.K. prepared the data for analysis. A.N., A.F., J.W., J.K. and B.M.N. contributed to survey design and data collection. J.W. and B.M.N. were principal investigators for NCFS II. All authors approved the final version of the draft before publication. Ethics of human subject participation: This study was conducted according to the guidelines laid down in the Declaration of Helsinki, and all procedures involving research study participants were approved by the University College Cork Clinical Research Ethics Committee of the Cork Teaching Hospitals and the Human Ethics Research Committee of University College Dublin [ECM 4 (aa 07/02/2017)]. Written informed consent was obtained from all participants.
Supplementary material
For supplementary material accompanying this paper visit https://doi.org/10.1017/S1368980020004255


