


Food composition database information with relevant local foods is required to assess nutritional intake. Indeed, evidence-based nutrition policies needed to improve population nutrition-related health may be lacking without the analysis of individual energetic and nutrient intake(Reference Greenfield, Southgate, Burlingame and Charrondiere1). However, few countries hold accurate and up-to-date food composition tables. Many low- and middle-income regions lack these data and use other countries’ food composition tables as a proxy(Reference Rippin, Hutchinson and Evans2).
To investigate population food intakes, methods include 24-h recall studies, food diaries and FFQ, though all methods are prone to substantial measurement error(Reference Gibson and Ferguson3). The 24-h recall is the most common nutritional assessment method in low- and middle-income countries(Reference Gibson and Ferguson3). It is frequently used to obtain energetic and nutritional intake measurements and assess dietary quality in individuals and populations across a range of cultural contexts(Reference Kigutha4–5). Nowadays, electronic, automated systems have been validated and used to reduce costs and time of data collection(Reference Carter, Albar and Morris6–Reference Wark, Hardie and Frost12).
All methods to collect food intake data must be underpinned by food composition databases appropriate for the study population. However, those are often inadequate, especially in highly food-insecure contexts where the type and quantity of ingredients in a recipe can change depending on food availability (in submission). Engaging with the community and local nutritionists can be the key to getting more accurate food data and to understanding the evolution of populations’ dietary patterns overtime. Such information can also enrich the level of details that we need to develop relevant food composition tables in low-income and food-insecure settings (in submission).
Food composition databases representing food consumed by Indigenous communities are scarce. We contribute to this knowledge gap by constructing an online database of locally consumed foods with complete nutrient information for two vulnerable populations in south-western Uganda, the Batwa and Bakiga. Like other low-income countries, no food composition tables are available for south-western Uganda. The only existing food database was designed for central and eastern Uganda(Reference Hotz, Abdelrahman and Sison13) and does not include all common recipes and local foods eaten by the Batwa and Bakiga communities (Scarpa et al., 2020, in submission).
We created a framework to collect unique and relevant food and recipes data for a specific population by engaging with the local community, and we formulated the following steps to develop the food composition database: (1) to identify foods for inclusion in the database; (2) to clean initial data and remove duplicate items; (3) to link foods to existing food composition tables; (4) to map and calculate nutrient content of recipes and foods; (5)to allocate portion sizes and accompanying foods; (6) to perform quality checks with local and international nutritionists and (7) to translate food items into relevant local languages.
Methods
Study region and population
The Batwa community, self-identified as Indigenous, lives in south-western Uganda and represents a minority group in Kanungu District(Reference Sauer, Berrang-Ford and Patterson14). The Bakiga community resides in the same area and constitutes the majority population in the district(Reference Kulkarni, Garrod and Berrang-Ford15,Reference Patterson, Berrang-Ford and Lwasa16) . The Batwa were originally hunter-gathers until their displacement in 1991 from the forest, now known as Bwindi Impenetrable National Park(Reference Barnard17). They became a sedentary population frequently employed by the Bakiga in agriculture. However, many Batwa still rely on humanitarian aid to survive(Reference Rand, Pennington and Murphy18). Conversely, the Bakiga are traditionally farmers whose income comes primarily from food crops(Reference Patterson, Berrang-Ford and Lwasa16). Both populations are highly vulnerable to food insecurity, malnutrition (especially stunting), acute gastrointestinal diseases (including vomiting, diarrhoea and associated symptoms) and malaria(Reference Berrang-Ford, Dingle and Ford19).
Study design
The food database construction for south-western Uganda follows the framework in Fig. 1. The framework aimed at constructing food composition tables for low-income areas. It is composed of two stages: the first stage comprised fieldwork and a mixed methodology to collect a list of foods consumed, along with recipes and portion sizes (Scarpa et al., 2020, in submission). To develop the online south-western Ugandan database, we used six steps for food composition database creation previously used by other researchers(Reference Carter, Albar and Morris6,Reference Albar, Alwan and Evans20) . The data on foods and recipes were collected by the local research team, and the food database was created by the PI (GS) in collaboration with local nutritionists and myfood24 team in UK.
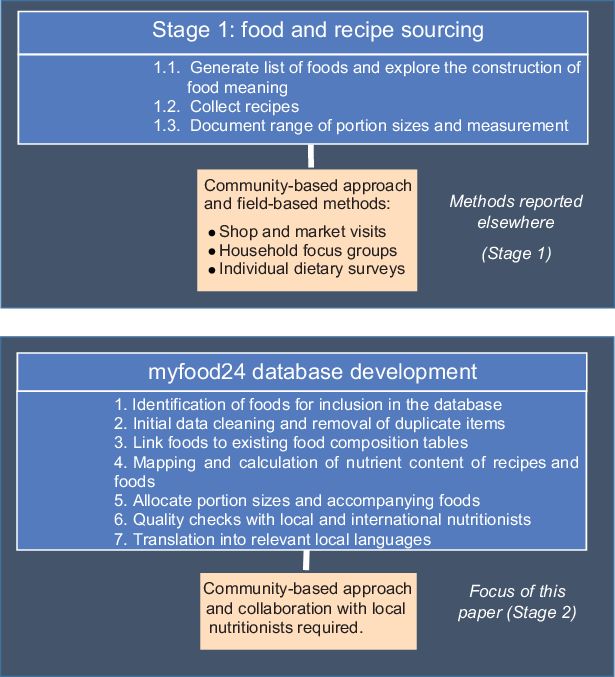
Fig. 1 Framework used to characterise the south-western Ugandan food database. This paper documents the methods and results from Stage 2
Stage 1
Detailed methods and results from Stage 1 are presented elsewhere (Scarpa et al., 2020, in submission), with this paper focusing primarily on Stage 2. In the first stage, food and recipe data were collected through market and shop assessment (n 4 markets and 10 shops visited in total), focus group discussions (n 8 in total) and individual dietary survey (n 76) from July to October 2019 (see online Supplemental material, Appendix 1). A male local researcher supported by a Batwa and a Bakiga female researcher conducted the fieldwork. The data were collected in the local Rukiga language and then translated in English by the local researcher (Scarpa et al., 2020, in submission).
For the individual dietary survey and focus groups (74 participants in total, 36 Batwa and 38 Bakiga), four settlements among Batwa and four adjacent (geographically matched) Bakiga settlements were sampled, ensuring a representative sample of people of different age and sex. To explore the range of foods in different geographical areas, data were collected in four different Batwa and Bakiga communities: close to the markets and shops, far from the markets and shops, mid-way between the two zones and close to the forest. Individuals participating in the study were randomly selected from village lists (Scarpa et al., 2020, in submission)(Reference Gibson and Ferguson3).
Stage 2
Stage 2 was comprised seven steps summarised in Fig. 1.
Identification of foods for inclusion in the database
We identified the most common foods and dishes consumed among the Batwa and Bakiga communities and we removed non-edible items (e.g. cigarettes). Additionally, a food photo album briefing was created with the pictures of local foods taken by a local nutritionist. It consisted of a description of the most frequently eaten foods and local recipes, and associated images of tools used to measure portion sizes. This supported the development of the food database by giving background information to non-local nutritionists on traditional foods consumed by the Batwa and Bakiga.
Initial data cleaning and removal of duplicate items
We cleaned the data and removed duplicates. We included all different cooking methods and ingredients for each food and dish eaten in south-western Uganda. Unit conversions were computed to match myfood24 database values; for example, some micronutrients were converted from grams to milligrams. Additionally, some missing values such as kilojoules were calculated using mathematical formulae (e.g. we used the value of the kilocalories and we divided it by 4·184).
Linking foods to existing food composition tables
Four existing food composition tables(Reference Hotz, Abdelrahman and Sison13,Reference Lukmanji, Hertzmark and Mlingi21–Reference Pinchen, Powell and Weiner23) from Uganda, Kenya, Tanzania and the UK were identified as relevant for the creation of the local food table.
The Ugandan database was created in 2012, and it includes 728 foods and recipes. No foods were chemically analysed for nutrients in the Ugandan table, except for orange sweet potato(Reference Hotz, Abdelrahman and Sison13). Most of the food items were sourced from the USDA(24) food composition table. The Tanzanian and the Kenyan food composition tables(Reference Lukmanji, Hertzmark and Mlingi21) and myfood24 database were consulted if a dish or item was not available in the Ugandan food database. The Tanzanian food composition database was developed in 2008 and comprises over 400 foods and recipes, while the Kenyan food composition table was created in 2018 and contains 509 foods(Reference Mwai, Kimani and Mbelenga22). The myfood24 database includes UK, German, Danish, and Australian foods and recipes, both branded and generic products. The data on nutritional content in the British food table come from the UK Composition of Foods Integrated Database (COFID)(Reference Pinchen, Powell and Weiner23) for generic products and back-of-pack nutrition labels for branded items which are mapped to similar generic products in COFID to allocate nutrient values for the remaining nutrients.
We used back-of-pack labels of packaged foods identified in Uganda to collect nutritional content information when this was not available in existing food composition tables. The estimated portion sizes were derived from focus group discussions which we held in the first stage of this study.
Mapping and calculation of nutrient content of foods and recipes
Recipes were collected during the Stage 1 of the study. In the case of beans-based dishes, two versions of the same recipe, one with fresh and the other with dried beans, were used, as both were cooked and eaten by the communities in similar amounts.
When possible, we matched the south-western Ugandan foods with the items already available in the myfood24 database (Table 1). This database is more complete in terms of nutritional content analysed than the other food composition tables. It contains 120 nutrients available for each food item(Reference Carter, Albar and Morris6). The decision to keep a food item already available in myfood24 was made by three independent researchers, including at least one Ugandan nutritionist.
Table 1 Example of matched foods for creating the online south-western Ugandan myfood24 database

Cooked ingredients were used for nutrient information for the majority of the recipes. Nutritional and energetic content was available from existing African food databases. Therefore, we did not add water nor calculate the cooking factor as those elements were already included in the cooked food items. Only in the case of two dishes, firstly we converted the raw ingredients of the recipes to percentages, to facilitate allocation of nutrients to each composite food per 100 g(Reference Carter, Albar and Morris6). Secondly, we applied cooking factors to calculate the quantity of cooked items(Reference Rand, Pennington and Murphy18). Lastly, we calculated water evaporation or absorption as required(Reference Greenfield, Southgate, Burlingame and Charrondiere1).
To determine the ingredients’ quantity in the dishes, we used an average of each ingredient described by the participants for every recipe; then, we created nutrient values for each recipe using the percentage of each ingredient in the recipe.
Allocate portion sizes and accompanying foods
Each food and dish was associated with portion size measures (Scarpa et al., 2020, in submission). For example, for quantifying boiled dried beans, we included in the database the portions expressed in grams and in soup spoons.
Additionally, we added a list of ‘accompanying foods’ which automatically appears on myfood24 when a food item that is commonly consumed with another one is selected. For example, milk and sugar were identified as ‘accompanying ingredients’ for ‘porridge’.
Quality checks with local and international nutritionists
A team composed of two nutritionists in Uganda and two nutritional researchers in the UK conducted quality checks after the first stage of fieldwork. Subsequently, two independent researchers and the myfood24 team checked the calculation of the recipes and the mapping of foods to ensure nutrient values were sensible.
Translation into relevant local languages
Translation of food names was performed by a local nutritionist and checked by the second Rukiga speaker. Synonyms of foods were added to facilitate searching in the database.
Data analysis
The data were analysed using Excel® for calculating the recipe ingredients and for basic descriptive statistics. MS Access® was used to create a database for inclusion into myfood24. This included all foods and nutrients, along with standard portion size information, prompts for foods commonly consumed with dishes and mispellings or different names to indicate foods if necessary.
Results
South-western Ugandan foods and dishes available in myfood24 database
The south-western Ugandan food database contains 148 of the most consumed foods among the Batwa and Bakiga communities living in Kanungu District, with complete information on 120 micronutrients and macronutrients. The foods were collected through the focus group discussions (collected information on 139 foods), individual dietary surveys (collected information on 69 foods), and shops and markets assessment (collected information on 95 foods). Some foods identified by the communities through one method (e.g. focus group discussions) were repeated in another method (e.g. market and shop assessments or individual dietary survey). We identified 303 food items using the three methods, representing 148 unique items after duplicate removal.
As shown in Fig. 2, the sources for developing the south-western Ugandan food composition database were multiple. Fifty-six per cent (82 items) of the foods were already available in the myfood24 database from the generic UK COFID tables, while the other 43 % (64 items) were added from African food composition tables (26 %) and generated recipes (18 %). Only 1 % (2 items) of the nutrients in foods included in the composition database were extracted from back-of-pack labels.

Fig. 2 Sources used to develop the south-western Uganda myfood24 database (n 148 items). ![]() , myfood24;
, myfood24; ![]() , African food composition tables;
, African food composition tables; ![]() , food labels;
, food labels; ![]() , generated recipes
, generated recipes
The south-western Ugandan myfood24 database included 43 % (64 of 148) of fruit and vegetable items and dishes, 26 % (38 of 148) of cereals items and cereal-based dishes (including dishes with higher percentages of cereals than vegetables), 14 % (20 of 148) of meat and fish dishes, and 5 % (7 of 148) of eggs and diary. Only 3·5 % (5 of 148) of products were sugary or sweet-based and 3 % (5 of 148) were included in oils, fats and condiments (Table 2). Some cooking oils and fats were branded, while the majority of the other food items did not have any brand. Soft drinks (4 %, i.e. 6 of 148) and alcoholic beverages (1·5 %, i.e. 2 of 148) corresponded to 4·5 % of the foods included in the database.
Table 2 Sources of the food list and the food database (myfood24 database, African food composition tables, back-of-pack labels products and generated recipes)
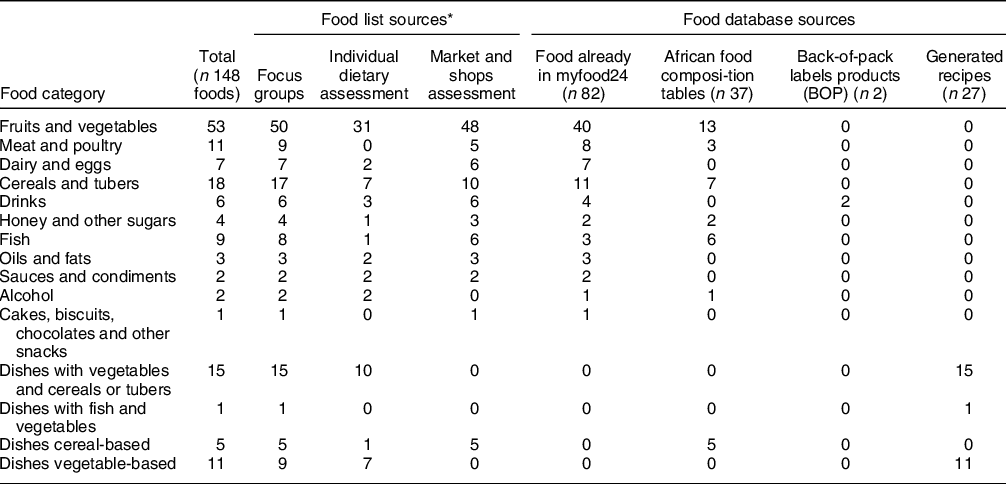
* The total of foods collected through focus group discussions, individual dietary surveys and shop and market assessments is not equal to 147, but it is higher. However, some foods and recipes were repeated using different methods.
The composite foods (including recipes already available in other food composition tables and new generated recipes) were mostly bean- and vegetable-based (9 of 32) or bean- and cereal-based (10 of 32) (Table 2). Thirty-one of thirty-two composite foods did not contain any animal protein. We inserted in our composition database five recipes (5 of 32) that were already available in the Ugandan food composition table. A selection of nutrients calculated for the twenty-seven generated recipes is reported in Table 3 and shown as per 100g of the cooked dish (the complete information can be found in Supplementary material-Appendix 2). The food products used for cooking were fresh or dried, and no recipes for preparing soups were mentioned. A high proportion of foods that needed to be cooked before consumption were boiled, except for some items such as fish and meat which were either boiled or fried. Sauces and condiments were prepared at home, while biscuits and sweets were packaged and bought from the markets and shops.
Table 3 Description of south-western Ugandan generated recipes (for 100 g of each cooked dish)
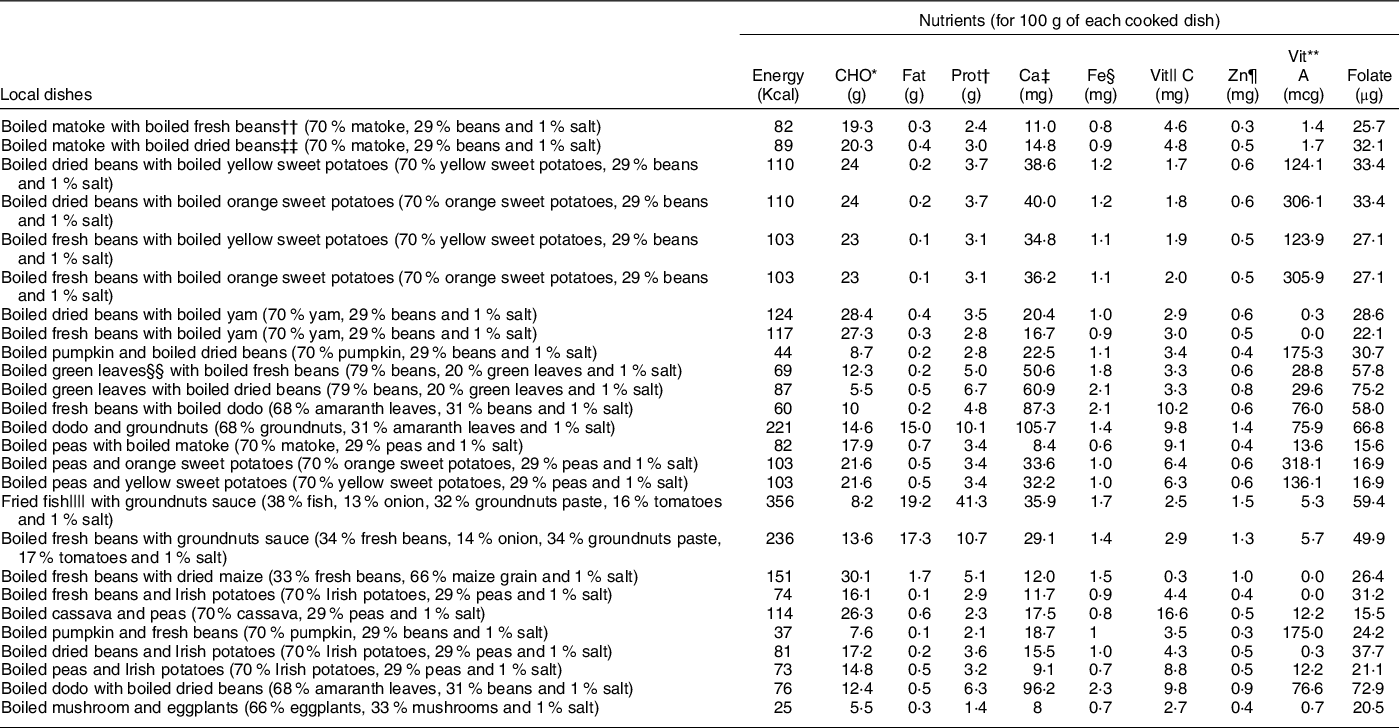
* Carbohydrates.
† Proteins.
‡ Ca.
§ Fe.
|| Vitamin C.
¶ Zn.
** Vitamin A.
†† Fresh beans: fresh kidney beans.
‡‡ Dried beans: mix of dried blackeye beans, dried haricot beans and dried red kidney beans.
§§ Green leaves: different green leaves, including amaranth leaves, eggplants leaves and cabbage leaves.
|||| Fish: tilapia.
Many identified generic fruit and vegetable items were already available in the myfood24 database (45 of 58 items). The new vegetables items added to the online database contained various types of wild leafy vegetable and fruit (thirteen new items).
Local fish and meat, commonly consumed in south-western Uganda, were also added to the database (e.g. goat meat). Their nutritional content was derived from the Ugandan and UK food composition tables.
The identified branded products had incomplete nutrient content information on the back-of-pack label and therefore had to be matched to similar foods from the myfood24 database which held complete nutritional data. The products, reported in Table 4, are mostly produced in Uganda or in Africa, and one is an international item.
Table 4 Branded products missing some important nutritional information that required mapping of nutrients

Discussion
We created an online food database with the most common foods and dishes consumed by the Batwa and Bakiga communities. Recognising the importance of collecting information on food meanings and social and environmental factors that affect individual food consumption, we used multiple fieldwork techniques and a community-based approach (Scarpa et al., 2020, in submission). We also believe that gaining knowledge on communities’ food systems can increase the understanding of local nutrition practices and facilitate the collection and analysis of local food intake data. Designing a locally relevant food composition database may be useful for monitoring the prevalence of undernutrition and identifying individuals potentially at risk of nutritional deficiencies (e.g. Fe)(25). It can also inform nutrition policies and future health intervention towards the third Sustainable Development Goal, ‘Zero Hunger’(26).
Challenges in developing the south-western composition database
We used different food composition tables to calculate the nutritional content of foods such as the Ugandan food composition database containing data from USDA (United States Department of Agriculture) and UK food composition tables. As a result, the nutrient content of foods analysed in high-income settings may not fully represent the nutritional values of an Indigenous meal as those vary according to the geographical position, but also food colour, species and season(Reference Greenfield, Southgate, Burlingame and Charrondiere1,27–Reference Scarpa, Berrang-Ford and Zavaleta-Cortijo30) . Therefore, relying on Western food analysis may lead to miscalculation of the real nutritional content(31). Although we are aware of possible limitations, before inserting any food in the myfood24 database, the Ugandan and UK teams evaluated the existing nutritional content. We thus included the most accurate nutritional values for each food according to existing knowledge. Indeed, we compared the macronutrient and micronutrient content in four databases (African and UK myfood24 databases), and if the nutritional values of African food composition tables were similar to those in myfood24 database, we choose to insert myfood24 values as they contained detailed analysis of over 120 nutrients.
Data on food labels were missing as in many low-income countries(Reference Dunford, Guggilla and Ratneswaran32–Reference Urban, Dallal and Robinson35); therefore, we could not extract information on nutrients except for two food items. In addition, we could not include some leafy vegetables consumed by the communities to cure specific diseases, due to lack of information on nutritional content in the scientific literature. We recommend further research to analyse the nutritional value of local plants and traditional herbs to be inserted in the south-western Ugandan food database. Including local foods also underpins a focus on Indigenous justice and the importance of recognising and valuing Indigenous food systems and practices, which in many contexts have been found to have nutritional and environmental benefits for communities(Reference Kuhnlein, Erasmus and Spigelski36).
Portion sizes were also challenging to measure as the Batwa and Bakiga often ate from the same plate. The participants in the focus group discussions did not like the potential to illustrate portions of dishes consumed through pictures(37), a medium often used in high-income countries to support food portion size estimation(Reference Timon, van den Barg and Blain38,Reference Coates, Colaiezzi and Bell39) . Household measurements were used to quantify food portions not only for the composition database of south-western Uganda but also for other African and South-Asian countries such as Burkina Faso and Vietnam(Reference Coates, Colaiezzi and Bell39). A more precise method may be needed to assess individual portion sizes. The use of wearable cameras was investigated by Bulungu et al. (Reference Bulungu, Palla and Priebe40) in Eastern Uganda to explore type of foods consumed and nutrition practices; however, further research is required to assess the reliability of this method to measure food portions in extremely low-income contexts.
Recipes and foods low in energies and poor in nutrients
As in other lower-income countries, economic constraints caused low consumption of foods rich in proteins and fats in south-western Ugandan populations(41). In previous focus group discussions (Scarpa et al., 2020, in submission), Batwa and Bakiga participants argued that in the past, when they lived in the forest, they used to hunt and often ate wild meat. Evidence suggests that hunting saved from starvation of different Indigenous communities, for example, the Inuit in the Arctic(Reference Pearce, Ford and Willox42). However, the study participants reported that now their diet is low in animal proteins, and the consumption of vegetable- and beans-based dishes is higher due to the high cost of meat in the markets.
The energetic level of the Batwa and Bakiga dishes is, in fact, generally low, and some micronutrients including Fe content may not be adequate to satisfy nutritional requirements, particularly of children and pregnant women. In vegetable protein-based dishes, non-haem Fe absorption varies between 5 % and 12 %. The variation depends on individual Fe status and other factors such as food preparation and Ca content(Reference Erdman, Macdonald and Zeisel43–45). Phytate and other inositol phosphates, which are present in many edible plants, may also inhibit Fe absorption(Reference Gillooly, Bothwell and Torrance46–Reference Hallberg, Rossander-Hulthen and Brune48). Conversely, if the Fe intake comes from mixed diets (animal and vegetable-based dishes), the quantity of Fe absorbed is between 14 % and 18 %, and the influence of inhibitors of Fe absorption is reduced, with a smaller effect on individual’s Fe status(Reference Erdman, Macdonald and Zeisel43,Reference Hurrell and Egli44) .
Most of the local dishes collected had a total of kilocalories between 25 and 236 per 100 g. Only the intake of the fish-based dish had more than 350 kilocalories per 100 g. As an example, we calculated the amount of matoke with fresh beans required by a male child aged 1 year. Indeed, this is one of the most consumed dishes used during the complementary feeding period (Scarpa et al., 2020, in submission). According to FAO guidelines, a 1-year-old boy needs 770 kcal/d(49). Therefore, if this is all that is available, nearly 1000 g of matoke with fresh beans are required to satisfy his energy needs based on the recipes obtained locally. This is a large quantity of food for a 1-year-old boy, with insufficient nutritional content. Also, the Fe intake from vegetable foods (8 mg for 1 kg of matoke with beans) would be much lower than the standard requirement (50–100 mg for 1-year-old boy(49)) as well as the vitamin A content (14 mcg for 1 kg of matoke with beans compared to 400 mcg standard FAO requirement(49)). Conversely, if the meals consumed included fish or meat, the amount of food to be eaten would have been lower. For example, 100 g of a fish-based dish already contains half of the energies that a 1-year-old infant has to consume daily. The foods used for complementary feeding practices in Western countries are much higher in terms of energy density, even for vegetarian diets(Reference Weder, Hoffmann and Becker50). Therefore, further research is needed to explore infant and young child nutrition to provide clear guidance on complementary feeding and weaning practices among the south-western Ugandan Indigenous communities.
The limitation of myfood24 use in south-western Uganda
We believe that the use of myfood24 with a local food database can ease the assessment of the food intake in less time and burden compared to the traditional interview-led approach. However, the level of literacy of Batwa and Bakiga is generally low, and accessibility to mobile phones or other computers is limited(Reference Patterson, Berrang-Ford and Lwasa16,Reference Berrang-Ford, Dingle and Ford19) ; therefore, self-recording of foods is challenging. Local researchers may play an important role to collect the data on the myfood24 database for the participants who do not have a mobile phone. Further research would be needed to investigate the usability of myfood24 in extremely low-income settings, as this is the first database created for Indigenous populations.
Additionally, as the myfood24 system only functions with internet connection, more work is needed to make it available offline. This would facilitate the data collection in rural settings, avoiding the use of paper-based methods to record the data and reducing working hours and transcription errors.
Conclusion
We developed the first online food composition database for an Indigenous population in an extremely low-income context. We used multiple fieldwork techniques, we engaged with the local communities and nutritionists, and we applied a novel framework to collect locally relevant information on foods and recipes. This database can be used in research to assess food intake of individuals’ vulnerable to malnutrition in south-western Uganda.
Acknowledgements
Acknowledgements: We are very thankful to the Batwa and Bakiga communities who shared their recipes and local foods with us, making the creation of the south-western Ugandan online food database possible. This work is dedicated to Grace Asaasira, IHACC researcher, who conducted many studies for the Batwa communities with passion and competence. She passed away last year and we missed her a lot. Financial support: G.S. was financed by a scholarship from the Canadian Institute of Health Research. This is part of a larger project on Indigenous Health and Adaptation to Climate (IHACC) with field study sites in Uganda, Peru and Canada. Financial support for that project is provided by the International Development Research Centre, Tri-Council Initiative on Adaptation to Climate Change, IHACC, IDRC. The funding sources had no role in the study design, data collection, analysis and interpretation of data. C.Z.-C. was supported by the National Institute for Health Research (NIHR) (using the UK’s Official Development Assistance (ODA) Funding) and Wellcome [218743/Z/19/Z] under the NIHR Wellcome Partnership for Global Health Research. The views expressed are those of the authors and not necessarily those of Wellcome, the NIHR or the Department of Health and Social Care. Conflict of interest: J.E.C. is Director of Dietary assessment Ltd, and S.B. and G.W. work in Dietary assessment Ltd. Authorship: G.S. prepared the first draft of the manuscript, coordinated the methodological design and conducted the data analysis. L.B. and J.C. provided input on the methodological design and data analysis. S.T. coordinated the fieldwork with P.K., E.N. and C.K and translated the data in Rukiga. All reviewers read, commented and approved the final manuscript. Ethics of human subject participation: This study was conducted according to the guidelines laid down in the Declaration of Helsinki and all procedures involving research study participants were approved by the University of Leeds Research Ethics Board (AREA 18-156), the Ugandan National Council for Science and Technology (SS5164), and the Makerere University Research Ethics Committee (MAKS REC 07.19.313/PR1). Written informed consent was obtained from all subjects.
Supplementary material
For supplementary material accompanying this, paper visit https://doi.org/10.1017/S1368980021001397


 Open access