BMI is a widely used measure of nutritional status in adults. The WHO has established global BMI cut-offs for adults >20 years of age with the range <18·5 kg/m2 indicating underweight. Although several recent and large pooled and meta-analytic studies show a shift in focus towards examining the adverse health effects of high BMI levels, these studies continue to show elevated morbidity and mortality in the lowest ranges of BMI(Reference Aune, Sen and Prasad1–Reference Whitlock, Lewington and Sherliker5). In many resource-limited or emergency settings, accurate measurements of BMI may be difficult to obtain due to a lack of access to properly maintained equipment (weight scales and stadiometers). In addition, health workers must be trained to read relatively complicated charts to convert weight and height measurements to BMI.
Mid-upper arm circumference (MUAC) is a potential alternative measure to BMI to screen for adult underweight. MUAC is a measure of the circumference of the upper arm at the midpoint between the tip of the elbow (olecranon process) and the tip of the shoulder blade (acromion process)(Reference Gibson6). While MUAC measurements are generally a reflection of both muscle and subcutaneous fat, in undernourished individuals who tend to have smaller amounts of subcutaneous fat, MUAC measurements can reflect chronic energy deficiency(Reference Gibson6). MUAC measurements are linear and can be taken with a simple tape measure. With appropriate MUAC cut-offs, the assessment could be performed by anyone with minimal training using even a simple paper strip that designates the cut-off values using colour codes.
In 2013, we completed a systematic review examining low MUAC as an indicator or predictor of nutrition and health outcomes in adults and adolescents(Reference Tang, Dong and Deitchler7). Our review has found that MUAC correlates well with BMI in adult populations and that people with low MUAC (variably defined by the original studies) are significantly more likely to have low BMI (<18·5 kg/m2)(Reference Ferro-Luzzi and James8–Reference Collins11). Low MUAC was also shown to be a significant predictor of short-term mortality(Reference Liu, Spiegelman and Semu12–Reference Gustafson, Gomes and Vieira14). Yet, globally recognised MUAC cut-offs have not been established to classify underweight among adults. Within the past decade, countries and programmes, particularly those working in the fields of HIV and TB, have tried to establish their own MUAC cut-offs to determine eligibility for programme services, but there is limited evidence that these cut-offs are optimal for identifying individuals who are undernourished and who are at a higher risk of morbidity or mortality(15–17).
To date, there is no guidance from the WHO about what MUAC cut-off should trigger further action in adults. However, WHO has recommended a MUAC cut-off of <11·5 cm as a screening tool for acute malnutrition in children 6–60 months of age(18). This cut-off has become a globally recognised standard for the identification and management of severe acute malnutrition in children and is often used to determine eligibility for, and to monitor progress in, facility-based and community-level nutritional interventions(18). Global MUAC cut-offs for adults could also serve to strengthen and harmonise programming across various sectors, including HIV, TB and broader community health and nutrition activities.
To determine the potential for developing standardised MUAC cut-offs to identify adults at risk of undernutrition, we undertook an individual participant data meta-analysis (IPDMA) to examine the diagnostic accuracy of various MUAC cut-offs for identifying underweight (BMI < 18·5 kg/m2) among men and non-pregnant women, henceforth referred to simply as ‘non-pregnant adults.’ In our systematic review, BMI < 18·5 kg/m2 was the outcome most consistently found to be associated with low MUAC. The decision to conduct meta-analyses using individual-level data rather than study-level (published) data was primarily dictated by the fact that most of the published studies did not examine or provide data on the sensitivity or specificity of various MUAC cut-offs(Reference Tang, Dong and Deitchler7). An original report that included seventeen studies was published online in June 2017(Reference Tang, Chung and Dong19). The current paper extends the findings of this report by including three additional datasets obtained after the report was finalised.
Methods
Prior to seeking datasets, eligibility criteria and an analysis plan were established and approved through our technical advisory group (TAG), which consisted of members from the National Institutes of Health, the United States Agency for International Development (USAID) and the WHO. To be eligible for the IPDMA, datasets had to include non-pregnant adults over the age of 18, with a minimum sample size of 100, and be collected on or after the year 2000. We chose the year 2000 because that was the year that antiretroviral therapy for HIV became widely accessible to people living with HIV in low-resource settings. In addition, investigators had to be willing to share participant-level data. The following minimal set of variables was requested: MUAC, height and weight (or BMI), sex and age.
Of the thirteen studies that were included in our systematic review(Reference Tang, Dong and Deitchler7), three were not eligible for this IPDMA: one was conducted prior to 2000(Reference Ferro-Luzzi and James8) and two had sample sizes <100(Reference Lemmer, Badri and Visser20,Reference Gourlay, van Tienen and Dave21) . We attempted to contact the researchers from the remaining ten studies and ultimately received datasets from two of them. One researcher provided two eligible datasets (GUI-HIV and GUI-TBC), and another research group provided six eligible datasets (IND-BKW, IND-FSD, IND-MSD, IND-ORA, IND-SDW and IND-UNI). We then put out a call for datasets through our TAG and updated our literature search. Through these methods, we were able to obtain six additional datasets (BAN, MAL-HNW, MAL-HWW, SAF, VIE-FEM and ZAM). We also included six eligible datasets from the Tufts team commissioned to conduct the IPDMA (ARG, IND-IDU, NAM, USA-IDU, USA-HIV and VIE-IDU). Thus, the present analysis includes data from twenty unique datasets. Data from four studies (IND-UNI, MAL-HNW, NAM and ZAM) were unpublished at the time this manuscript was written. Table 1 provides a brief summary of the studies included in this IPDMA. The twenty studies represent the target populations that would most likely use an established low MUAC cut-off to determine the eligibility for limited health and nutrition services, that is, people living with HIV and/or TB, low-resource and development settings and individuals at risk of undernutrition (e.g. injection drug users).
Table 1 Characteristics of included studies

ART, antiretroviral therapy; IDU, injection drug user; MUAC, mid-upper arm circumference.
* This refers to the total number of observations with MUAC measurements. Missing values on individual variables (e.g. BMI) may slightly reduce the numbers for analysis. Total N 13 835.
† Study has not been published yet. See online Supplemental Table 1 for complete descriptions of unpublished studies.
Statistical analyses
All datasets were converted and analysed using the Stata statistical software (StataCorp). Each dataset was assessed against published manuscripts or original research protocols to create an overview of the included participants and study procedures. For each dataset, we performed data checks of all variables received, ensuring that units, categories, coding and labels were consistent across studies. Investigators were contacted to confirm missing data, to check extreme or invalid values and to obtain clarification of study variables and procedures.
To better understand the data from each individual study and the degree of potential heterogeneity between studies, basic descriptive statistics were calculated for each study. These variables included age, sex, education level, HIV status, MUAC, height, weight and BMI. The collection of information on education was not consistent across studies. Some studies asked for the number of years of schooling, while others collected data in predetermined categories that were not equivalent between studies. For the purposes of summarising and comparing education levels across studies, we created three general categories: no education, education at or up to the primary school level (grades 1–8, 1–8 years of schooling or less than high school), and education at or above the secondary school level (grades 9 to ≥12, ≥9 years of schooling, completion of high school or beyond).
MUAC was measured to the nearest 0·1 cm in all studies except for GUI-TBC, where MUAC was measured to the nearest 0·2 cm. Histograms of MUAC and BMI were constructed to determine the distribution of these measurements for each study separately and for all datasets combined (online Supplemental Figs 1–4). Scatterplots of BMI by MUAC were examined to determine the association between the two variables, for each study separately and for all datasets combined (online Supplemental Figs 5 and 6). Pearson correlation coefficients between MUAC and BMI were calculated for each study separately and for all studies combined. The outcome of low BMI was defined as BMI < 18·5 kg/m2, consistent with the cut-off for underweight recommended by the WHO(22).
We then examined the diagnostic accuracy of MUAC in predicting low BMI, using MUAC cut-offs in increments of 0·5 cm over the range of 19·0–26·5 cm. For each MUAC cut-off, we constructed a 2 × 2 table showing the cross-tabulation of BMI category (BMI < 18·5 v. ≥ 18·5) and MUAC (above or below the specified cut-off). We computed sensitivity (SENS), specificity (SPEC), positive predictive value (PPV) and negative predictive value (NPV) over the range of MUAC cut-offs for each of the twenty datasets. We also obtained the area under the receiver operating characteristic curve (AUROC) for each study. Next, we combined the datasets into one pooled dataset and created a unique participant identification number and study identifier variable to identify participants within studies. We estimated SENS, SPEC and positive and negative likelihood ratios (LR+ and LR–) for each MUAC cut-off value using the user-written metandi and midas commands in Stata(Reference Harbord and Whiting23,Reference Dwamena24) . These commands perform a bivariate (or joint) meta-analysis of SENS and SPEC using a two-level mixed-effects logistic regression model with MUAC as the only independent variable predicting low BMI. At the first level, within-study variability is accounted for by modelling the counts of the 2 × 2 tables within each study. At the second level, between-study variability (heterogeneity) is accounted for, allowing for the non-independence of SENS and SPEC across studies. We also obtained the AUROC for the pooled dataset.
Results
The number of participants in each study ranged from 182 (ZAM) to 4926 (VIE-FEM) (Table 1 Reference Nguyen, Ramakrishnan and Katz36– Reference Carter, Pan and Rai38). The VIE-FEM dataset was by far the largest, with nearly five times the number of participants as the second largest dataset (GUI-HIV, with n 1055).
Table 2 shows the demographic characteristics of participants by individual study and for all studies combined. Overall, the mean age was 32·6 ± 12·1 years, with ages ranging from 18 to 91 years. The average age for each study was predominantly in the thirties, with a few exceptions. Three studies targeted slightly younger populations (BAN, IND-UNI and VIE-FEM), and two studies included slightly older participants (USA-IDU and USA-HIV). One study (SAF) specifically targeted an elderly population and thus had a mean age of 71·5 ± 7·9 years.
Table 2 Participant characteristics by individual study and for all studies combined

* Number of participants missing data on age: MAL-HNW (n 4), MAL-HWW (n 1), SAF (n 5), USA-IDU (n 9), VIE-FEM (n 23), VIE-IDU (n 1).
† Number of participants missing data on sex: MAL-HNW (n 1).
‡ Number of participants missing data on education: IND-SDW (n 1), NAM (n 1), USA-IDU (n 4), VIE-FEM (n 2).
§ For USA-IDU, categories are <high school, some high school, >high school.
‖ For NAM, HIV status based on self-report; for VIE-IDU, n 1 missing data on HIV status.
¶ Statistics for the combined datasets for education and HIV status exclude studies that did not collect data on these variables.
Nearly two-thirds of participants in the pooled dataset were female (64·4 %). Two studies (IND-FSD and VIE-FEM) included only female participants and five studies (IND-BKW, IND-MSD, IND-ORA, IND-IDU and VIE-IDU) included only male participants.
Six of the seventeen studies did not collect data on education status. Of the remaining eleven studies, education level differed widely between studies. Two studies (IND-BKW and IND-FSD) included a majority of participants that had no schooling. Two studies (ARG and IND-IDU) included a majority of participants with primary school education, and six studies (GUI-TBC, IND-UNI, NAM, USA-HIV, VIE-FEM and VIE-IDU) included a majority with secondary school education or above.
HIV status was not ascertained in half of the studies. Five studies (GUI-HIV, MAL-HNW, MAL-HWW, USA-HIV and ZAM) included HIV-positive participants only and the remaining five studies (ARG, IND-IDU, NAM, USA-IDU and VIE-IDU) included both HIV-positive and HIV-negative participants.
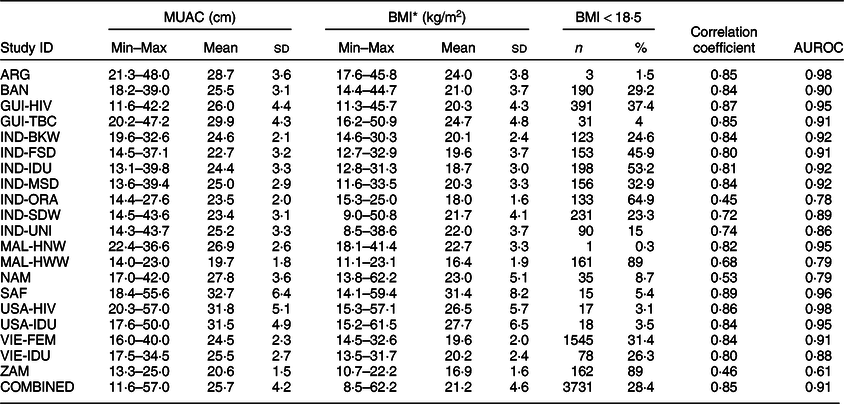
Table 3 shows the MUAC and BMI measurements by individual study and for all studies combined. MUAC measurements ranged from a low of 11·6 cm in GUI-HIV to a high of 57·0 cm in USA-HIV. The average MUAC measurement varied between studies, ranging from 19·7 cm in MAL-HWW to 32·7 cm in SAF. Overall, 28·4 % of participants had low BMI (<18·5 kg/m2). The prevalence of low BMI ranged from approximately ≤5 % in six studies (ARG, GUI-TBC, MAL-HNW, SAF, USA-HIV and USA-IDU) to 89 % in two studies (MAL-HWW and ZAM). Online Supplemental Figs 5 and 6 show the scatterplots of BMI by MUAC for each study separately and combined. Correlations between BMI and MUAC were strong and statistically significant for all studies, ranging from 0·45 (IND-ORA) to 0·89 (SAF). Fourteen of the twenty studies had correlation coefficients at or above 0·80. For the pooled dataset, the correlation coefficient was 0·85 (P < 0·00001). The ROC for the pooled dataset (Fig. 1) indicates clear discrimination between the distributions of MUAC measurements among those with low BMI compared to those with normal to high BMI. The ROC approaches the upper left-hand corner of the graph, indicating high SENS is achieved with high SPEC. AUROC ranged from 0·61 (ZAM) to 0·98 (ARG and USA-HIV), with thirteen of the twenty values being ≥0·90 (Table 3). AUROC for the pooled dataset was 0·91.
Table 3 Mid-upper arm circumference (MUAC), BMI, Pearson’s correlation coefficients and area under the receiver operating characteristic curve (AUROC) by individual study and for all studies combined

* Number of participants missing data on BMI: GUI-HIV (n 10), GUI-TBC (n 3), IND-IDU (n 2), MAL-HWW (n 5), NAM (n 3), SAF (n 4), USA-IDU (n 1), VIE-FEM (n 2).

Fig. 1 Receiver operating characteristic curve for all studies included in the individual participant data meta-analysis (IPDMA) combined. Area under the receiver operating characteristic curve = 0·91
Online Supplemental Tables 2–17 compare SENS, SPEC, PPV and NPV for predicting low BMI across studies for each MUAC cut-off from 19·0 to 26·5 cm, in increments of 0·5 cm. As shown, the values of SENS, SPEC, PPV and NPV at each MUAC cut-off varied widely between studies.
Table 4 shows the summary estimates of SENS, SPEC, LR+ and LR– derived from the bivariate random-effects model. SENS and SPEC ranged from 4·9 and 99·7 %, respectively, at a MUAC cut-off of 19·0 cm, to 98·0 and 51·0 %, respectively, at a MUAC cut-off of 26·5 cm. The MUAC cut-off with the highest SENS at or above a SPEC of 70 % was 25·0 cm. However, cut-offs with lower (but still acceptable) SENS values and higher SPEC values could extend down to 23·0 cm. For example, a cut-off of 23·0 cm would misclassify 35 % of those with BMI < 18·5 kg/m2 as being adequately nourished, and 7 % of individuals with BMI ≥ 18·5 kg/m2 as being undernourished. Based on the LR, a person with BMI < 18·5 kg/m2 is 9·7 times more likely to have a MUAC ≤ 23·0 cm than an individual with BMI ≥ 18·5 kg/m2, and a person with BMI < 18·5 kg/m2 is 60 % less likely to have a MUAC > 23·0 cm than a person with BMI ≥ 18·5 kg/m2. A higher cut-off of 25·0 cm would correctly classify 93 % of individuals with low BMI as being undernourished but would misclassify approximately 27 % of those with BMI ≥ 18·5 kg/m2. Based on the LR, a person with BMI < 18·5 kg/m2 is 3·5 times more likely to have a MUAC ≤ 25·0 cm, and 90 % less likely to have a MUAC > 25·0 cm than an individual with BMI ≥ 18·5 kg/m2.
Table 4 Summary estimates of sensitivity (SENS), specificity (SPEC), positive likelihood ratio (LR+)* and negative likelihood ratio (LR–)† at selected MUAC cut-offs for all studies combined

MUAC, mid-upper arm circumference; CI, confidence interval.
* LR+ denotes the ratio between the probability of MUAC ≤cut-off given BMI < 18·5 kg/m2 and the probability of MUAC ≤cut-off given BMI ≥ 18·5 kg/m2 = SENS/(1–SPEC).
† LR– denotes the ratio between the probability of MUAC >cut-off given BMI < 18·5 kg/m2 and the probability of MUAC >cut-off given BMI ≥ 18·5 kg/m2 = (1–SENS)/SPEC.
Table 5 compares the results obtained from various sensitivity and subgroup analyses that we conducted. Nine studies had either a low prevalence (<10 %) of individuals with BMI < 18·5 kg/m2 or a low prevalence (<11 %) of individuals with normal to high BMI, resulting in less stable estimates of SENS and SPEC. We conducted a sensitivity analysis excluding these nine studies and found that, compared to the full dataset, SENS increased and SPEC decreased across all MUAC cut-offs. We obtained very similar results when excluding five upper-middle- or high-income countries (ARG, NAM, SAF, USA-HIV and USA-IDU) from the analyses. Subgroup analyses by sex and HIV status found that SENS was higher and SPEC lower in females and people living with HIV than their male or HIV-negative counterparts.
Table 5 Comparing false-negative (FN) and false-positive (FP) rates between various subgroups of participants and studies

LMIC, low- and middle-income countries; MUAC, mid-upper arm circumference.
* Excludes studies with low (<10 %) prevalence of individuals with BMI < 18·5 kg/m2 (ARG, GUI-TBC, MAL-HNW, NAM, SAF, USA-HIV and USA-IDU) or a low prevalence (<11 %) of individuals with normal to high BMI (MAL-HWW, ZAM).
† Excludes the following upper-middle- and high-income countries: ARG, NAM, SAF, USA-HIV and USA-IDU.
‡ FN = percentage of individuals with BMI < 18·5 kg/m2 who are missed using the MUAC cut-off.
§ FP = percentage of individuals with BMI ≥ 18·5 kg/m2 who are referred for further screening.
Discussion
The purpose of this IPDMA was to determine whether a global MUAC cut-off could be recommended as a screening tool to assess underweight in non-pregnant adults. Currently, the screening tool most commonly used to determine underweight is low BMI (<18·5 kg/m2). However, the measurement of BMI requires equipment (weight scales and stadiometers) that needs to be properly set up and maintained, and skilled individuals to measure the height and weight and calculate the BMI. For these reasons, in settings where obtaining accurate measurements of BMI is not feasible, a simple identification of low MUAC could serve as a surrogate for low BMI. Using twenty compiled datasets from various parts of the world, we found that MUAC has an excellent ability to discriminate between individuals with low BMI (<18·5 kg/m2) and those with normal to high BMI (≥18·5 kg/m2). The results remained robust across the various sensitivity and subgroup analyses we performed. We found that, although individual measures of SENS and SPEC at each of the MUAC cut-offs varied between studies, the diagnostic accuracy of MUAC for identifying adults with low BMI was consistently high. The AUROC ranged from 0·61 to 0·98 for individual studies, with most studies having values ≥0·90. The AUROC was 0·91 for all studies combined, which is considered to be in the ‘excellent’ range based on the general interpretations for AUROC(Reference Carter, Pan and Rai38). Results of the meta-analysis showed that MUAC cut-offs in the range of 23·5–25·0 cm could potentially serve as an appropriate indicator for low BMI, with acceptable levels of SENS and SPEC at each of these cut-offs for the purpose of initial screening for underweight in the community or clinical setting. MUAC cut-offs in the range of 24·0–25·0 cm provided optimal levels of SENS and SPEC for many of the subgroups analysed.
The selection of the optimal MUAC cut-off for identifying moderate and severe undernutrition in non-pregnant adults must take into consideration the trade-off between failing to capture the entire population in need of services (false-negative rate) and referring too many individuals who are not in need of services to the healthcare system or programme (false-positive rate). At a MUAC cut-off of 24·0 cm, SENS was 84 % and SPEC was 83 %. At this cut-off, the false-negative and false-positive rates would be 16 and 17 %, respectively. Lowering the MUAC cut-off to 23·5 cm would increase the false-negative rate to 25 % and decrease the false-positive rate to 11 %. At a MUAC cut-off of 25·0 cm, SENS increased to 93 % and SPEC decreased to 73 %, lowering the false-negative rate to 7 % but increasing the false-positive rate to 27 %.
The recommendation for a MUAC cut-off (or a range of cut-offs) based on this IPDMA is only a first step towards determining a standardised and global MUAC cut-off to identify undernutrition among non-pregnant adults. While many countries and programmes currently use low MUAC as a tool for assessing nutritional status and determining the eligibility for limited nutrition interventions, the lack of a standardised cut-off makes it difficult to compare studies internationally and to evaluate the effect of nutritional interventions in larger contexts. The widespread collection and reporting of outcomes based on a single standardised MUAC cut-off would facilitate better understanding of the effectiveness of MUAC as a screening tool for adult underweight in various contexts and settings. It is important to note that the purpose of nutrition assessment is to identify individuals who are at risk of malnutrition and who would benefit from nutrition and/or clinical intervention. WHO defines malnutrition as ‘deficiencies, excesses or imbalances in a person’s intake of energy and/or nutrients’(39). Others have defined malnutrition as ‘a subacute or chronic state of nutrition in which a combination of varying degrees of over- or under-nutrition and inflammatory activity have led to a change in body composition and diminished function’(Reference Soeters, Reijven and van Bokhorst-de van der Schueren40). A comprehensive nutrition assessment, therefore, requires several elements, including: (1) evaluation of an individual’s history and clinical diagnoses; (2) physical examination for signs of malnutrition (e.g. oedema or specific nutrient deficiencies) and/or clinical indicators of inflammation (fever, hypothermia, tachycardia); (3) anthropometric data, such as weight, BMI, skinfolds or circumferences; (4) evaluation of usual dietary intake; (5) laboratory indicators if available (e.g. C-reactive protein, leucocytes, glucose); and (6) functional outcomes such as strength and mobility(Reference Jensen, Hsiao and Wheeler41). As it is not feasible to conduct a complete nutrition assessment on every individual in a community, or even on every individual who enters a healthcare facility, valid screening tools that are simple, quick, acceptable and inexpensive are needed. Ideally, low MUAC would be used as a screening tool in community or clinic settings to accurately identify individuals who are at the highest risk of undernutrition leading to impaired function and poor clinical outcomes, and for whom intervention would improve their nutritional status and clinical outcomes and restore function. It is important to keep in mind that no one screening tool is optimal for all individuals in all situations. Each has its strengths and limitations in different contexts, and each can be affected by an individual’s clinical status. Therefore, screening tools such as low MUAC should only be used as an initial step that triggers further and more detailed nutrition assessment, followed by intervention if appropriate. Although programmes and policymakers will need to consider available resources when deciding on the optimal MUAC cut-off, we propose that in the context of initial screening under ideal situations, a high SENS (low false-negative rate) is more critical than a high SPEC (low false-positive rate).
This study had some limitations. Our initial systematic review identified ten potentially eligible datasets of which we were only able to obtain two for the IPDMA. The remaining datasets in this analysis were obtained from our own research studies, through referrals from our TAG and through further solicitation of studies in the literature that included MUAC as a continuous measure (our systematic review included only studies that analysed MUAC as a binary/categorical variable). Therefore, in the end, we were unable to use a formal systematic process for identifying all the datasets included in this analysis. In addition, although a large variety of geographical regions and settings were represented in this analysis, the datasets we obtained may not be representative of those regions or settings. Unfortunately, national nutrition surveys that would be representative of our target population, such as the Demographic Health Surveys, do not routinely collect MUAC in adults. Furthermore, readers should use caution when interpreting the results, which may be affected by confounders, both measured and unmeasured. For example, the presence of oedema, which was not measured in most datasets, is a likely confounder in the association between MUAC and BMI.
We posited that the applicability of our IPDMA results may be limited due to the heterogeneity in population characteristics, specifically the wide variability in the prevalence of low BMI. Leeflang et al.(Reference Leeflang, Bossuyt and Irwig42,Reference Leeflang, Rutjes and Reitsma43) have proposed several contexts in which SENS and SPEC can vary with disease prevalence (contrary to what is commonly taught in epidemiology courses), including the use of an imperfect reference standard, such as low BMI. We used meta-regression techniques to explore the extent to which this may have occurred in our IPDMA using MUAC cut-offs of 24·0 and 25·0 cm as examples. For both cut-offs, we found that very little of the variability in SENS was due to the variation in the prevalence of low BMI (adjusted R 2 = 5·3 % for MUAC ≤ 24·0, and 1·9 % for MUAC ≤ 25·0 (online Supplemental Fig. 7)). However, nearly one-third to one-half of the variation in SPEC was due to the variation in low BMI prevalence (adjusted R 2 = 48·3 % for MUAC ≤ 24·0, and 31·9 % for MUAC ≤ 25·0). In sensitivity analyses removing the nine studies with a low prevalence of BMI < 18·5 kg/m2 or ≥ 18·5 kg/m2, the proportion of variability in SPEC due to the variation in low BMI prevalence was reduced to 0 % for both MUAC cut-offs (online Supplemental Fig. 8). The remaining variability, which is larger for SPEC than for SENS, is due to unknown factors.
One of the unknown factors contributing to this variability could be ethnicity. Much of the literature examining ethnic differences in body composition has focused on the associations between BMI, adiposity and health risks associated with overweight and obesity(44–Reference Misra47). Ethnic differences in the effect of undernutrition on the relative loss of fat from the limbs and trunk is largely unknown. To our knowledge, very little is published on ethnic differences in MUAC measurements, particularly among undernourished adults. In children 6–60 months of age, one study suggests that the association between MUAC < 11·5 cm and mortality may be modified by ethnicity(Reference Gupta, Tielsch and Khatry48). It is quite possible that the association between MUAC cut-offs and low BMI differs by ethnicity; however, our dataset was not robust enough to examine this. Readers can examine differences by countries and geographic regions in the supplementary tables provided, but we were not able to compare different ethnicities within or across datasets. Large-scale studies in each population or country would be required to determine whether a low MUAC cut-off might differ by ethnicity. In addition, further consideration should be given to the implications of establishing different cut-offs for different subgroups (whether it be by ethnicity, age or disease group) as this would hinder comparisons across countries and would be impractical for community-level screening.
Based on our results, we propose that a MUAC cut-off of 24·0 cm meets the criterion for optimising SENS and SPEC across various subpopulations when assessed against low BMI. A meaningful MUAC cut-off would be one below which function and clinical outcomes deteriorate. Whether a MUAC cut-off of 24·0 cm fits this criterion needs to be tested and validated in future longitudinal studies. Comparisons of MUAC against measures such as lean body mass or grip strength would provide further evidence that a global MUAC cut-off could be valuable as a screening tool for undernutrition. As a valid and reliable screening tool, the use of MUAC in place of BMI would reduce the amount of time and technical skill required for nutrition screening in community settings, resulting in a larger number of individuals who would benefit from further nutrition assessment and intervention. We stress that the proposed MUAC cut-off is currently only intended for use as a screening tool to trigger referral for further assessment; it is not recommended to be used for diagnosis or as an entry criterion into food or nutrition supplementation programmes until further validation studies with clinical outcomes have been conducted.
Finally, although the focus of this report is on adult underweight, we do acknowledge the growing global burden of overweight and obesity at both individual and population levels, and the need for screening tools to help prioritise the limited services that are available in low-resource settings. Therefore, future studies should also explore MUAC as a potential screening tool for overweight and obesity.
Acknowledgements
Acknowledgements: The authors would like to thank the members of the TAG for their help in guiding the development of the analysis plan, identifying eligible datasets and providing input on the interpretation of the results. The authors would especially like to thank the participants of all the studies included in this analysis – without the time and sacrifices made to participate in these studies, we would not have been able to conduct this analysis. Financial support: This study is made possible by the generous support of the American people through the support of the Office of Health, Infectious Diseases and Nutrition, Bureau for Global Health, USAID, under terms of Cooperative Agreement No. AID-OAA-A-12-00005, through the Food and Nutrition Technical Assistance III Project, managed by FHI 360. The funders contributed to the conceptualisation of the study and the preparation of the manuscript. Conflicts of interest: None. Authorship: A.M.T. formulated the research question, designed the study, collected and analysed the data and wrote the manuscript; M.C. designed the study, analysed the data and edited the manuscript; K.R.D. collected and analysed the data and provided feedback on the manuscript; P.B., K.B., R.C., K.C., P.D., M.G., M.I.H., P.N., C.B.P. and T.S. each contributed datasets and provided feedback on the manuscript; M.D. and Z.M.-M. conceived the idea and provided feedback on the manuscript. Ethics of human subject participation: This study has been deemed non-human subjects-related research by the Health Sciences Institutional Review Board of Tufts University.
Supplementary material
For supplementary material accompanying this article visit https://doi.org/10.1017/S1368980020000397