


It is well established that those with lower levels of income and education make food choices less consistent with dietary guideline recommendations compared with their more affluent or educated counterparts( Reference Giskes, Avendaňo and Brug 1 – Reference Giskes, Turrell and Patterson 3 ). The resulting poorer dietary profile of those of low socio-economic position (SEP) may contribute to their higher rates of morbidity and mortality for many health conditions, including type 2 diabetes( Reference Robbins, Vaccarino and Zhang 4 , Reference Mozaffarian, Kamineni and Carnethon 5 ), heart disease( Reference Bennett 6 – Reference Matthews, Kiefe and Lewis 8 ), obesity( Reference Vernay, Malon and Oleko 9 – Reference McLaren 11 ) and stroke( Reference Bennett 6 , Reference Avendano and Glymour 12 ).
Those of low SEP generally demonstrate lower levels of nutrition knowledge than those of high SEP( Reference Hendrie, Coveney and Cox 13 – 17 ). This is evident regardless of whether education( Reference Turrell and Kavanagh 14 – Reference McLeod, Campbell and Hesketh 16 ), occupation( Reference De Vriendt, Matthys and Verbeke 15 , 17 ), employment status( Reference Hendrie, Coveney and Cox 13 , Reference De Vriendt, Matthys and Verbeke 15 ) or area-level SEP( Reference Hendrie, Coveney and Cox 13 ) is considered. Nutrition knowledge represents an attractive target for improving the diet of the population due to the many avenues available for intervention and its importance in food choices( Reference Harnack, Block and Lane 18 , Reference Wardle, Parmenter and Waller 19 ). Strategies to target nutrition knowledge include the use of various media sources (print media, television and the Internet), product labelling, in-store displays, through formal and informal training, and through direct contact with nutrition and medical professionals( Reference Nayga 20 ). Despite nutrition knowledge being consistently associated with SEP, little is known about how it contributes to inequalities in food choices. An examination of the various facets of nutrition knowledge would enable interventions to be refined to focus on those aspects of nutrition knowledge most relevant to inequalities in food choices.
Measurement of nutrition knowledge is contentious( Reference Parmenter and Wardle 21 , Reference Worsley 22 ); however, this construct is commonly reported to comprise at least the following three components: (i) an awareness of the relationship between diet and disease (e.g. an awareness of the relationship between saturated fat intake and heart disease( Reference Parmenter, Waller and Wardle 23 )); (ii) knowledge of which foods contain particular nutrients (e.g. knowledge of which foods contain fibre( Reference Parmenter, Waller and Wardle 23 )); and (iii) an understanding of the nature of healthy dietary practices (hereafter referred to as ‘knowledge of dietary guidelines’; e.g. knowledge that a recommended diet should include a variety of fruits and vegetables( Reference Kolodinsky, Harvey-Berino and Berlin 24 – Reference Sims 26 )). Some authors differentiate these components further; for example, by assessing comprehension of specific terms such as ‘cholesterol’, assessing knowledge of the energy (calorie) content of foods or by evaluating practical knowledge regarding the implementation of recommended dietary practices( Reference Wardle, Parmenter and Waller 19 , Reference Parmenter, Waller and Wardle 23 ). The current paper focuses on the (aforementioned) three commonly acknowledged broad components of nutrition knowledge (knowledge of the relationship between diet and disease, knowledge of the nutrient content of foods and knowledge of dietary guidelines). These factors have all been noted as essential for dietary change( Reference Sims 26 ) and are included in current Australian health promotion( 27 – 29 ).
Studies of the general population generally combine two or more components of nutrition knowledge to form a composite measure. In this format, higher levels of nutrition knowledge are commonly( Reference Harnack, Block and Lane 18 , Reference Wardle, Parmenter and Waller 19 , Reference Kolodinsky, Harvey-Berino and Berlin 24 ), although not always( Reference Worsley 22 , Reference McPherson and Turnbull 30 ), associated with healthier food choices. Composite measures of nutrition knowledge are also found to mediate socio-economic differences in food choices in the few studies in which they are considered( Reference McLeod, Campbell and Hesketh 16 , Reference Wardle, Parmenter and Waller 19 , Reference Ball, Crawford and Mishra 31 ). However, no known study has examined the contribution of specific components of nutrition knowledge to mediating socio-economic inequalities in food choices. This information would be valuable for appropriately directing health promotion and policy. The current investigation addresses this knowledge gap by conducting an analysis of mediation to assess the extent to which three components of nutrition knowledge individually and collectively contribute to inequalities in food purchasing choices.
Methods
Study design
The Brisbane Food Study (BFS) was a multilevel, observational study designed to assess socio-economic differences in the extent to which household food purchasing choices were consistent with dietary guidelines. The stratified two-stage clustered sampling procedure has been described in detail elsewhere( Reference Turrell, Patterson and Oldenburg 32 ). In brief, the sampling process first involved ranking all 1517 Brisbane Census Collectors Districts (CCD) in terms of their area-level disadvantage using the Australian Bureau of Statistics’ Index of Relative Socioeconomic Disadvantage (IRSD) scores( 33 ). These 1517 ranked areas were then divided into deciles, and five CCD were randomly selected from each decile using without-replacement probability-proportional-to-size sampling. Households within each CCD were identified using Brisbane City Council cadastre maps. From each of the fifty CCD selected, approximately twenty households were selected using simple random sampling. Only a single member of each household was invited to participate and this person had to identify as being a main food purchaser for their household.
The BFS was devised in accordance with a socio-ecological perspective( Reference Stokols 34 ) wherein health inequalities are acknowledged to arise from factors related to the individual and their societal and environmental contexts. As such, the BFS considered both environmental (e.g. food store proximity and prices) and psychosocial (e.g. nutrition knowledge, weight concerns, taste preferences and cost concerns) determinants of food purchasing inequalities( Reference Turrell and Kavanagh 14 ). Data were collected by face-to-face interviews conducted in respondents’ homes (n 1003, response rate 66·4 %).
Outcome measures
Food purchasing
Three food purchasing variables represented the outcome measures of the present study. Respondents were asked to indicate which types of each of the sixteen grocery foods they usually chose; for example, for milk whether they selected trim, skimmed, full-cream milk or any of a range of other options. Multiple options of each grocery food could be selected according to which types were usually purchased.
Each grocery food type was classified by the research team as ‘regular’ or ‘recommended’ according to dietary guidelines concerning salt, sugar, fat and fibre. For example, reduced-fat milk choices such as trim and skimmed milk were classified as ‘recommended’, whereas full-cream milk was classified as a ‘regular’ grocery option. For each of the sixteen grocery foods respondents were assigned a score of ‘3’ if they selected only ‘recommended’ options, ‘1’ if they selected only ‘regular’ options and ‘2’ if they selected a mixture of ‘regular’ and ‘recommended’ options. Scores were summed and divided by the total number of grocery foods purchased (out of a possible sixteen). Scores were then re-scaled to range from 0 to 100, with higher scores reflecting grocery purchasing choices more consistent with dietary guidelines (i.e. comparatively lower in fat, salt and sugar and higher in fibre than other choices).
An index was created to reflect the variety of fruit purchased based on reported purchasing of nineteen types of fruit (scaled 0–100). Respondents were asked when food shopping how often they bought each type of fruit. The response options were: ‘always’, ‘nearly always’, ‘sometimes’, ‘rarely’ or ‘never’. For each fruit, respondents who provided a response of ‘always buy’, ‘nearly always buy’ or ‘sometimes buy’ were given a score of ‘1’, while those who responded ‘rarely buy’ or ‘never buy’ achieved a score of ‘0’. In this way, respondents who at least sometimes purchased a particular type of fruit were distinguished from those who purchased it less often. Scores achieved for all nineteen fruits were summed to form an index, index scores were then re-scaled to range from 0 to 100. Higher fruit purchasing scores were reflective of usually purchasing a greater variety of the nineteen fruits represented.
Similarly, an index was created to reflect the variety of vegetables purchased based on reported purchasing of twenty-one types of vegetables (scaled 0–100). The methods for constructing these food purchasing indices are described elsewhere( Reference Turrell and Kavanagh 14 , Reference Turrell, Bentley and Thomas 35 ).
Mediators
Nutrition knowledge
An expert panel of nutritionists and dietitians developed twenty items to measure knowledge regarding food, nutrition and health. The panel was instructed to devise questionnaire items relating specifically to aspects of knowledge relevant to food purchasing choices. These items collectively represented three components of nutrition knowledge as shown in Table 1.
Table 1 The twenty nutrition knowledge items used to assess three components of nutrition knowledge

Each nutrition knowledge item had the response options of ‘true’, ‘false’ or ‘not sure’. Responses were dichotomised into two categories: ‘correct’ (correct response given) or ‘not correct’ (including incorrect response and don't know). This classification of responses is known as a ‘strict’ scoring protocol in that both incorrect and don't know responses are considered equally reflective of a lack of knowledge( Reference Turrell and Kavanagh 14 ). Indices were constructed to reflect three components of knowledge: (i) knowledge of the relationship between diet and disease (seven items); (ii) knowledge of the nutrient content of foods (six items); and (iii) knowledge of dietary guidelines (seven items). The number of correct responses was summed per index and an overall index of nutrition knowledge was also created comprising all twenty items. The overall nutrition knowledge index has been used in previous research( Reference Turrell and Kavanagh 14 ). All nutrition knowledge indices were scaled to range from 0 to 100 with greater values reflecting higher knowledge levels. Consistent with recent Australian findings, nutrition knowledge levels across socio-economic groups were quite high( Reference McLeod, Campbell and Hesketh 16 ) (knowledge of the relationship between diet and disease, mean 80·7, sd 21·3; knowledge of the nutrient content of foods, mean 67·6, sd 18·6; and knowledge of dietary guidelines, mean 79·5, sd 12·7).
Independent variables
Household income
Respondents indicated their total household income by selecting one of fourteen narrow-ranged income categories, providing response options in terms of weekly, fortnightly or annual amounts. The fourteen categories were then collapsed into four groups that each contained approximately one quarter of respondents. This approach maximised statistical power in the absence of established income thresholds of importance in relation to income and food purchasing choices. The resulting income groups were: (i) ≤$AUD 25 999; (ii) $AUD 26 000–51 999; (iii) $AUD 52 000–77 999; and (iv) ≥$AUD 78 000. A small proportion of respondents (n 25, 2·5 %) either refused to answer this question or did not provide adequate information for their household income to be reliably coded. These respondents were excluded from further analysis.
Education
Respondents were asked to indicate their highest level of completed education. Responses were categorised into four groups: (i) bachelor degree or higher (including postgraduate diploma, master's degree or doctorate); (ii) diploma (associate or undergraduate); (iii) vocational (trade or business certificate, or apprenticeship); and (iv) no post-school qualifications. A small proportion of respondents (n 21, 2·1 %) either refused to answer this question or did not provide adequate information for their education level to be reliably coded. These respondents were excluded from further analysis.
Analysis
The relationships between SEP, nutrition knowledge and food purchasing choices were examined using general linear models adjusted for the clustered sampling design, age, gender, household size and household type. The mediation analyses followed the four-step approach first expounded by Baron and Kenny( Reference Hayes 36 ) and later developed by others( Reference Hayes 36 – Reference MacKinnon and Fairchild 38 ). Figure 1 depicts the relationships assessed in the present investigation using a conventional mediation diagram( Reference MacKinnon, Fairchild and Fritz 39 ).
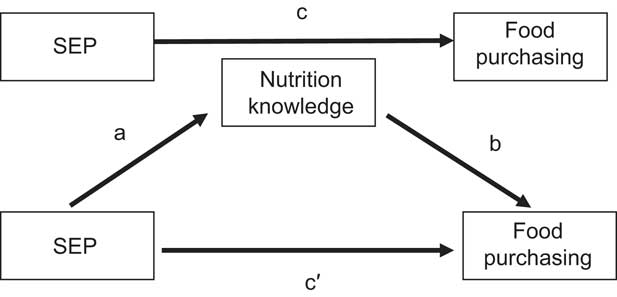
Fig. 1 Relationships examined in the analysis of mediation, including the associations between socio-economic position (SEP) and food purchasing (path c), SEP and nutrition knowledge (path a), nutrition knowledge and food purchasing (path b), and SEP and food purchasing adjusted for nutrition knowledge (path c′)
Models were fitted to examine: path a, the association between SEP and nutrition knowledge; path b, the association between nutrition knowledge and food purchasing choices; path c, the association between SEP and food purchasing choices; and path c′, the association between SEP and food purchasing adjusted for nutrition knowledge. Path c′ provides an estimate of the extent to which socio-economic differences in food purchasing choices (path c) are mediated by nutrition knowledge. Path c′ therefore reflects the ‘indirect’ or ‘mediated’ effect as it measures the extent to which socio-economic differences in food purchasing operate via nutrition knowledge differences as opposed to the ‘direct’ effect estimated in path c.
Analyses were conducted using the Complex Samples Module in the statistical software package IBM SPSS Statistics 19·0 (2010).
Results
Brisbane Food Study response analysis
A total of 1606 respondents were invited to participate in the BFS, among these 6·2 % (n 100) were not able to complete the survey (e.g. due to being non-English speaking, deaf, or not being well enough to participate), leaving 1506 prospective participants. Among these a further 32·4 % (n 488) refused to participate, while 1·7 % (n 18) of households that initially agreed failed to keep their appointment, resulting in a final sample of 1000. This equates to a final response rate of 66·4 % (1000/1506 × 100 %). After data collection it was discovered that three extra surveys had been completed; while these three respondents were not included in the response rate analysis they have been included in subsequent analysis of the BFS data.
The 32·4 % of respondents who refused to participate were asked to complete a four-question non-response card to enable a comparison of some sociodemographic and food purchasing characteristics with those who agreed to participate. Bread was the single food type assessed on the non-response card. Non-respondents and respondents were comparable in terms of their compliance with dietary guidelines for bread purchasing, as similar proportions of each group selected bread options relatively high in fibre. Non-respondents on average were older and less educated compared with those who agreed to participate. This indicates that those of low SEP (i.e. those with lower levels of education) may have been relatively under-sampled in the study. This may have resulted in a socio-economically truncated sample, and thus the socio-economic differences reported are likely to be a conservative estimate of those that are actually present in the community. The reduced likelihood of those of low SEP to participate in research, as observed in the present study, is well established( Reference Turrell, Patterson and Oldenburg 32 , Reference Turrell and Najman 40 ).
Sample characteristics
After data cleaning, a sample of 970 of the 1003 BFS respondents was obtained. Most participants were female (n 763, 78·7 %), and just under half were 45 years of age or older (46·4 %, n 450). The household types included in the study were: single-person households, group households, couples with children, single parents with children and couples without children. The objective of the stratified sampling of CCD according to area-level SEP (described earlier) was to yield a sample of households that varied in terms of SEP. This appears to have been successful; as demonstrated in Table 2 along with other demographic characteristics, the households selected varied in terms of income and education levels. While the sample represented education levels in equal proportions to those observed in the 2006 Australian Census( 41 ), at least 72·5 % of BFS respondents reported incomes higher than the 2001 Queensland state average of $AUD 22 828( 42 ). Thus consistent with the above analysis of non-respondents, comparison with Australian Bureau of Statistics data suggests that the BFS sample may not represent the actual socio-economic diversity in the population. Therefore, any socio-economic differences observed are likely to be an underestimate of those actually present in the community.
Table 2 Sociodemographic characteristics of the sample: main household food shoppers (n 970), Brisbane Food Study, Australia, 2000

Association between socio-economic position and nutrition knowledge (path a)
Table 3 summarises the associations between SEP and nutrition knowledge. Those of high SEP exhibited higher levels of all three nutrition knowledge components compared with those of low SEP; in all but one instance these differences were significant (i.e. the difference in knowledge of dietary guidelines between the highest and lowest education groups was not significant). Providing further evidence of a relationship between nutrition knowledge and SEP, nutrition knowledge was found to increase consistently across increasing income and education groups.
Table 3 Socio-economic differences in the three nutrition knowledge components among main household food shoppers (n 970), Brisbane Food Study, Australia, 2000Footnote †

EMM, estimated marginal mean.
Statistical significance compared with the referent (highest) socio-economic group: *P ≤ 0·05, **P ≤ 0·001.
† Analyses adjusted for age, gender, age, household type and household size.
‡ Range 0–100.
§ Difference = EMM nutrition knowledge index score of the highest socio-economic group minus that of the lowest socio-economic group.
Association between nutrition knowledge and food purchasing (path b)
Higher levels of all aspects of nutrition knowledge were associated with healthier food purchasing behaviours, as indicated by higher grocery, fruit and vegetable purchasing index scores. However, only the relationships between nutrition knowledge and grocery and fruit purchasing were significant. The strongest relationship was observed between knowledge of dietary guidelines and grocery purchasing. As shown in Table 4, every 1-point increase in knowledge of dietary guidelines (scaled 0–100) was associated with a 0·31-point increase in the grocery purchasing index (P ≤ 0·001).
Table 4 Associations between nutrition knowledge and food purchasing among main household food shoppers (n 970), Brisbane Food Study, Australia, 2000Footnote †
Statistical significance: *P ≤ 0·05, **P ≤ 0·001.
† Analyses adjusted for age, gender, household size and household type.
‡ The regression coefficients represent the number of points increase in the relevant food purchasing index score (range 0–100) for every 1-point increase in the relevant nutrition knowledge index (range 0–100).
Association between socio-economic position and food purchasing (path c)
Recommended food purchasing exhibited positive, approximately linear relationships with SEP, with the most affluent and educated respondents reporting food purchasing patterns most consistent with dietary guidelines (Table 5). Except for the relationship between level of education and vegetable purchasing, these differences were significant (P ≤ 0·05).
Table 5 Socio-economic differences in food purchasing among main household food shoppers (n 970), Brisbane Food Study, Australia, 2000Footnote †

EMM, estimated marginal mean.
Statistical significance compared with the referent (highest) socio-economic group: *P ≤ 0·05, **P ≤ 0·001.
† Analyses adjusted for age, gender, age, household type and household size.
‡ Range 0–100.
§ Difference = EMM food purchasing index score of the highest socio-economic group minus that of the lowest socio-economic group.
Socio-economic differences in food purchasing (path c) and the mediating effect of nutrition knowledge (path c′)
Table 6 presents the results of the final models estimating the extent to which socio-economic differences in nutrition knowledge mediated inequalities in food purchasing choices. The three nutrition knowledge components mediated socio-economic differences in grocery purchasing in all but one instance (Table 6). Socio-economic differences in fruit and vegetable purchasing variety were also almost always reduced after adjustment for nutrition knowledge, although none of the mediated effects observed were significant. The magnitude of significant mediated effects associated with individual nutrition knowledge factors ranged from 10·3 % (knowledge of nutrient content of foods as a mediator of income group differences in grocery purchasing) to 26·3 % (knowledge of diet–disease relationships as a mediator of education group differences in grocery purchasing). The attenuation observed when all three nutrition knowledge components were added to the models simultaneously was generally less than the sum of that associated with each component part. This was expected, as it is reflective of overlap in the variation in food choices accounted for by different aspects of nutrition knowledge since these components are likely to influence food choices in a collective manner( Reference Putler and Frazao 43 ). Overall the highest combined mediating effect of all nutrition knowledge factors was approximately 24·0 %: this was observed for the attenuation of grocery purchasing differences across socio-economic groups.
Table 6 Regression coefficients for mediation analysis and indirect effects among the highest and lowest socio-economic groups of main household food shoppers (n 970), Brisbane, Australia, 2000

Path c: independent variable = income/education, dependent variable = grocery/fruit/vegetable purchasing, adjusted for age, gender, household size and household type.
Path c′: independent variable = education/income, dependent variable = grocery/fruit/vegetable purchasing, adjusted for nutrition knowledge (mediator), age, gender, household size and household type.
% mediated = [1 − (c′/c)] × 100.
N/A: for clarity, factors which exhibited trends in opposite directions (i.e. some reduced while some increased variation between socio-economic groups) were not combined.
Statistical significance: *P ≤ 0·05.
†Income: lowest (≤$AUD 25 999) compared with highest (≥$AUD 78 000).
‡Education: lowest (no post-school qualifications) compared with highest (bachelor degree or higher).
Discussion
The present study concurred with previous research in finding households of lower SEP to make food choices less consistent with dietary guidelines( Reference Giskes, Avendaňo and Brug 1 – Reference Giskes, Turrell and Patterson 3 ) and to display lower levels of nutrition knowledge, compared with those of high SEP( Reference Hendrie, Coveney and Cox 13 – Reference McLeod, Campbell and Hesketh 16 , Reference Wardle, Parmenter and Waller 19 , Reference Nayga 44 ). The current investigation complements and extends previous research by applying a mediation analysis to examine these relationships, considering multiple food choice outcomes, dual socio-economic indicators and several components of nutrition knowledge. Nutrition knowledge attenuated socio-economic differences in food purchasing choices in most instances.
Several contextual differences in the findings are noteworthy. All nutrition knowledge factors mediated socio-economic differences in grocery purchasing to a greater extent than fruit or vegetable purchasing. Among nutrition knowledge components, knowledge of the diet–disease relationship was consistently the greatest, or equally greatest, attenuator of inequalities in food purchasing. The relationships observed between SEP, nutrition knowledge factors and food purchasing were similar irrespective of the socio-economic indicator (i.e. income or education) considered. These contextual nuances of the findings are discussed in the following sections.
Food purchasing outcome
In all instances, the three components of nutrition knowledge considered reduced socio-economic variation in grocery purchasing to a greater extent than they influenced inequalities in fruit or vegetable purchasing. Previous studies that have considered nutrition knowledge as a mediator of socio-economic differences in food choice have examined overall diet quality( Reference McLeod, Campbell and Hesketh 16 ), intake of fat( Reference Wardle, Parmenter and Waller 19 ) and/or intake of fruits and vegetables( Reference Wardle, Parmenter and Waller 19 , Reference Ball, Crawford and Mishra 31 ). In the single study that compared the impact of nutrition knowledge as a mediator across food types, differences were observed depending on the food type considered( Reference Wardle, Parmenter and Waller 19 ). Specifically, nutrition knowledge attenuated socio-economic differences in fruit and vegetable consumption to a greater extent than it mediated inequalities in fat intake( Reference Wardle, Parmenter and Waller 19 ). The authors attribute this finding to there being historically a greater focus on fat in health promotion than what there has been on fruits and vegetables( Reference Wardle, Parmenter and Waller 19 ). This explanation is in accordance with theory on the diffusion of innovation, which posits that those of high SEP uptake innovations (including health recommendations) quicker than those of low SEP( Reference Rogers 45 ). Accordingly, greater socio-economic differences would be expected in relation to more recent innovations.
Although other explanations are possible, the findings of the current study may be due to the way the nutrition knowledge variables were measured. It seems plausible that the nutrition knowledge measures had the greatest impact on mediating inequalities in grocery purchasing as the majority of items that comprised these measures pertained to grocery items, with fewer questions regarding fruit and vegetables.
Nutrition knowledge component
Among the nutrition knowledge components, knowledge of the relationship between diet and disease always differentiated socio-economic groups to the greatest or equally greatest extent of all knowledge factors and was always the largest or equally largest mediator of socio-economic differences in food purchasing choices. This suggests that efforts to reduce socio-economic differences in food choices may be best focused on improving knowledge of the relationship between diet and disease among those with low levels of income and education. Qualitative research has provided evidence of a ‘disconnect’ between diet and health among those of low SEP( Reference Wiig Dammann and Smith 46 ). In particular, the lay ideologies about diet and disease held by those of low SEP are often inconsistent with advice given by nutritional and medical authorities( Reference Coveney 47 , Reference Smith, Quandt and Arcury 48 ). A lack of belief in or understanding of the relationship between diet and disease may result in a lack of motivation to apply other aspects of nutrition knowledge; for example, knowledge of the nutrient content of foods or knowledge of dietary guidelines. Socio-economic groups are found to have different priorities and perspectives in relation to food choice decision making( Reference Hart, Herriot and Bishop 49 , Reference Inglis, Ball and Crawford 50 ). Concerns regarding health and nutrition are often reported to be more salient in the food choices of those of high SEP compared with those who are disadvantaged( Reference Inglis, Ball and Crawford 50 – Reference Hupkens, Knibbe and Drop 52 ). Those of high SEP are also found to perceive greater levels of personal control over their health( Reference Smith, Sullivan and Bauman 53 , Reference Pajak 54 ), to be less likely to assume that they are at lower risk of negative health outcomes compared with the average person (optimistic bias)( Reference Hart, Herriot and Bishop 49 ) and to have a greater sense of personal responsibility to engage in health-promoting behaviours( Reference Wardle and Steptoe 55 ). The different health and nutrition orientations of socio-economic groups are likely to contribute to socio-economic differences in nutrition knowledge and to corresponding inequalities in food choices.
Socio-economic indicator
The finding that nutrition knowledge was as strongly related to household income as it was to respondent education has implications for the way that future research is both designed and interpreted. With regard to the design of future research, the bulk of previous studies investigating socio-economic differences in nutrition knowledge among adults have assessed SEP by considering either respondent education( Reference Hendrie, Coveney and Cox 13 – Reference McLeod, Campbell and Hesketh 16 , Reference Wardle, Parmenter and Waller 19 ) or occupation( Reference De Vriendt, Matthys and Verbeke 15 , 17 , Reference Wardle, Parmenter and Waller 19 ). The current investigation suggests that household income may also be a relevant socio-economic indicator to include in future research.
With regard to interpretation, a criticism of previous research in this area is that studies have not adequately represented the multidimensional nature of SEP in their study designs( Reference Parmenter, Waller and Wardle 23 ). Consequently, the possibility of numerous pathways between nutrition knowledge and SEP, reflecting the influence of multiple aspects of SEP, is rarely acknowledged( Reference Parmenter, Waller and Wardle 23 ). The segregation of nutrition knowledge into component parts in the present investigation allowed some specific observations about the relationships between discrete components of nutrition knowledge and the different socio-economic indicators. Specifically, the current investigation suggests that whether nutrition knowledge is developed with regard to the nutrient content of foods and with regard to the relationships between diet and disease may be just as influenced by the financial resources available to the household as by the formal education obtained by the household member primarily responsible for food purchasing.
With regard to education, this indicator is known to influence an individual's ability to interpret, retain and recall information( Reference Turrell and Kavanagh 14 ). Literacy and numeracy, which are largely acquired through formal education( Reference Hull and Schultz 56 ), are particularly important determinants of an individual's ability to understand and respond to many types of health information( Reference Rothman, Housam and Weiss 57 , Reference Howard, Sentell and Gazmararian 58 ). With regard to income, this indicator is associated with media choices that, in turn, may determine exposure to health promotion( Reference Bernard-Bonnin, Gilbert and Rousseau 59 – Reference Carter 64 ) which is likely to influence nutrition knowledge levels. For example, those with lower levels of income have been found to be higher users of television( Reference Bernard-Bonnin, Gilbert and Rousseau 59 – Reference Stamatakis, Hillsdon and Mishra 61 ) (which has been shown to promote less-healthy food choices( Reference Halford, Boyland and Hughes 62 – Reference Carter 64 )) and to be lower users of print media that promotes recommended food choices, compared with those who are affluent( Reference Adams and White 65 ). Knowledge of dietary guidelines was the only component of nutrition knowledge that displayed little variation across education groups. Since most respondents had at least a primary school education, this may be a reflection of this factor historically representing a more prominent part of the Australian school curriculum than the other aspects of nutrition knowledge.
Study limitations and considerations
The observational and cross-sectional nature of the present study does not permit causal inferences to be drawn. The majority of households sampled reported higher incomes than the Queensland average household income reported by the Australian Bureau of Statistics from the 2001 Census( 42 ). Therefore, the findings of the study are likely to represent a conservative estimate of actual socio-economic differences in food choices present in the community. There are currently no established thresholds of clinical or practical importance with regard to socio-economic differences in food purchasing choices. However, even small differences in health-promoting behaviours over time may make an important contribution to the marked socio-economic differences in chronic health conditions that are consistently found( Reference Adler and Ostrove 66 – Reference Davey Smith and Brunner 68 ).
It has been recommended that education regarding nutrition will be most effective when delivered with an understanding of how the recipient population best learns and applies nutrition knowledge( Reference Worsley 22 ). This would ideally include investigating the existing schemata used to organise and assess nutrition and health information among the target group( Reference Worsley 22 ). These considerations were beyond the scope of the current research but are likely to facilitate the delivery of nutrition knowledge appropriately tailored to the applicable socio-economic group.
Conclusion
Addressing socio-economic differences in household food purchasing is important, as the choices made affect the health of entire families( Reference McLeod, Campbell and Hesketh 16 , Reference French, Wall and Mitchell 69 ). Many factors are likely to be involved in the procurement of recommended foods including numeracy, literacy and competing food choice considerations such as cost concerns and taste preferences( Reference Turrell and Kavanagh 14 , Reference Steptoe, Pollard and Wardle 70 ). While nutrition knowledge alone may not be sufficient to prompt the selection of recommended food choices, it does appear to be a necessary factor( Reference Worsley 22 , Reference Soederberg Miller, Gibson and Applegate 71 ). Nutrition knowledge was quite high across socio-economic groups. However, this factor was a substantial mediator of socio-economic inequalities in food choices and represents a promising target for health promotion due to the many and varied ways that education on this topic can be delivered( Reference Nayga 20 ).
The findings of the present investigation demonstrate the complexity of the pathways through which nutrition knowledge may contribute to inequalities in food choices. It has also offered some suggestion of the most promising aspect of knowledge for nutrition authorities to target in order to reduce socio-economic differences in food choices and subsequent health inequalities. This research suggests that if we are to focus public health resources on a particular aspect of nutrition knowledge, efforts may be best directed at reducing inequalities in knowledge of the relationship between diet and disease. Since the components of nutrition knowledge are likely to operate in a combined and synergistic manner( Reference Putler and Frazao 43 ), promotion of the other aspects of nutrition knowledge should also be maintained.
While it remains unclear precisely why socio-economic groups differ in their nutrition knowledge, possible reasons include: differential exposure to, and uptake of, health promotion; differences in the ability to interpret, retain and apply nutrition information; and variation in the prioritisation of health and nutrition concerns relative to other food choice determinants. The unique needs and cultural context of those of low SEP should be taken into account in devising strategies to improve nutrition knowledge among this group.
Acknowledgements
Sources of funding: L.M. is supported by an Australian Postgraduate Award Industry Scholarship jointly funded by Queensland Health and Queensland University of Technology. The BFS was funded by a National Health and Medical Research Council (NHMRC) Project Grant (ID 101217). G.T. is funded by an NHMRC Senior Research Fellowship (ID 1003710). Conflicts of interest: The authors declare that they have no competing interests. Ethics: Ethical approval for the study was granted by the Queensland University of Technology Human Research Ethics Committee (no. QUT 1471 H). Authors’ contributions: L.M. drafted the initial manuscript and conducted the analyses. G.T. carried out the data collection. G.T. and K.G. contributed to the interpretation of data, provided critical feedback on drafts and approved the final manuscript.


