


Obesity and poor diet quality are major public health concerns and the increase in food consumption outside the home is a major contributor( Reference Bezerra, Curioni and Sichieri 1 ). Nearly half of all food dollars are spent on food eaten away from home( 2 ) and fast-food consumption is linked to weight gain and poor diet quality( Reference Paeratakul, Ferdinand and Champagne 3 – Reference Powell and Nguyen 5 ). The fast-food industry spends $US 4·6 billion per year on advertisements and exposure to such advertising is associated with greater fast-food consumption( Reference Harris, Schwartz and Brownell 6 – Reference Scully, Dixon and Wakefield 8 ). Food marketing has been identified as one of many factors that promotes overconsumption of nutritionally poor foods and poor diet quality( Reference Swinburn, Sacks and Hall 9 – Reference Harris, Bargh and Brownell 11 ). Child-targeted food marketing is particularly concerning because young children do not have the cognitive capacity to distinguish between advertisements and other media content( Reference McGinnis, Gootman and Kraak 12 ). Child-targeted advertising has also been shown to influence children’s food preferences and consumption( Reference Lobstein and Dibb 13 – Reference Borzekowski and Robinson 16 ).
Most studies on the effects of food marketing have focused on television advertisements( Reference Grossman, Tekin and Wada 17 , Reference McClure, Tanski and Gilbert-Diamond 18 ), with less attention paid to marketing that occurs in or around restaurants. Marketing strategies at restaurants, such as signs, pictures and promotions to encourage sales of certain menu items( Reference Harris, Schwartz and Brownell 6 ), can draw consumer attention to featured products( Reference Chandon, Hutchinson and Bradlow 19 – Reference Powell, Rimkus and Isgor 21 ). Unfortunately, the majority of such marketing promotes unhealthy foods. One study from 2010 found that 75 % of menu items featured on signs in (US) fast-food restaurants were of poor nutritional quality. Energy-dense, nutritionally poor foods were especially common on signs with value messages and price promotions( Reference Harris, Schwartz and Brownell 6 ).
Although these data paint a dreary picture of fast-food marketing at restaurants, many chains have made some efforts to offer and encourage healthier food choices. In September 2012, McDonald’s started posting energy (calorie) information on menus nationwide to enable nutrition-minded choices( 22 ). Also in 2012, Burger King added foods like salads and fruit smoothies to its menu( Reference Gasparro and Warner 23 ). In 2011, the National Restaurant Association launched Kids LiveWell, a voluntary programme to offer and promote at least one kids’ meal that meets the programme’s nutrition criteria( 24 ). Another voluntary, self-regulatory programme is the Children’s Food and Beverage Advertising Initiative (CFBAI), which began in 2006 and aims to improve the quality of foods advertised to children( 25 ). Eighteen US food and beverage companies participate in the CFBAI, including Burger King and McDonald’s.
Although these strategies may signal positive changes in the food marketing landscape, they have been criticized by public health advocates for being subject to only minimal regulation and for not being sufficiently stringent( Reference Harris, Schwartz and Munsell 26 ). The restaurant industry has also taken simultaneous actions to thwart efforts regulating toy giveaways with children’s meals not meeting certain nutritional standards( Reference Bernstein 27 ), despite evidence that such policies may encourage children to select healthier meals at fast-food restaurants( Reference Hobin, Hammond and Daniel 28 ). Given the various restaurant initiatives to offer and promote healthier foods, studies are needed to determine whether there has been systematic improvement in restaurant-industry food marketing. The aims of the current study were to examine changes from 2010 to 2013 in the nutritional quality of foods and beverages marketed at four popular fast-food chain restaurants throughout the USA. To designate marketed items, the study focused on foods and beverages that were pictured on general menu boards, pictured on the kids’ section of menu boards and featured on signs inside and on the exterior of restaurants. Such pictures and signs highlight items that restaurants are actively promoting, and can serve as salient visual cues that attract attention and are likely to influence consumers, especially during quick ordering decisions( Reference Cohen and Babey 29 ).
Methods
Sample
An audit of menu boards and signs was conducted in the four fast-food restaurant chains with the highest sales revenues in the USA based on Nielsen data (excluding Starbucks, considered a coffee/doughnut retail shop instead of a restaurant, and Subway, whose customizable sandwiches with varying nutrition profiles prevented them from being included in the present study)( 30 ). Data were collected from Burger King, McDonald’s, Taco Bell and Wendy’s in repeated cross-sectional samples at two time points in June 2010 and July 2013. Major market areas across the USA, defined as metropolitan statistical areas established by the federal Office of Management and Budget and used by the US Census Bureau, were selected to provide wide geographic dispersion across the country. Thirty-seven areas were selected in 2010 and twenty-one in 2013. Within each market area, individual stores from each chain were selected randomly from restaurant lists. One hundred stores were audited from each fast-food chain per year, for 400 total stores (a random sample of different stores was sampled at each year).
Data collection
A market research firm specializing in retail research conducted the audits using its national network of experienced field personnel. Field personnel underwent training in audit procedures and received a comprehensive field form together with detailed instructions. In addition to training field personnel, supervisors conducted quality control steps to ensure the collection of accurate data, including spot-checking the original data collection to check for implausible values and re-checking data within restaurants when necessary. Field forms were customized by restaurant and listed individual menu items compiled from each restaurant’s online menus. For example, the field form for McDonald’s listed the ‘Big Mac’ and other associated hamburger names, while the field form for Burger King listed the ‘Whopper’. The form also provided space to write in any individual menu items that were not listed on the field form.
Marketed items at restaurants were defined as foods and beverages pictured on menu boards or featured (either with or without a picture) on signs. For each menu item at each restaurant, field personnel first recorded whether the item was pictured on menu boards inside the restaurant. Menu boards were divided into general menu boards or the kids’ section of menu boards, and pictured items were coded separately within each category. The kids’ section of menu boards, usually labelled as such, included kid-size meals typically sold with a side and drink, which often came with a toy or prize.
Field personnel then recorded whether each item was featured on signs, either with or without a picture. Auditors looked for signs in three locations: (i) inside the restaurant (including the counter area and all other indoor areas); (ii) at the drive-through (including signs in the drive-through lane and immediately around the outdoor menu board); and (iii) outside the restaurant (including the parking lot, main marquee sign, roof, ground, and restaurant windows facing outside). Signs included anything considered temporary or changeable and not part of the permanent menu board.
On both menu boards and signs, if menu items were pictured in a group or bundled together (such as those for value meals), each item was coded individually. For analysis, menu items were grouped into either foods (which included dessert drinks such as milkshakes or smoothies) or beverages.
Primary outcomes: nutritional quality and energy of marketed foods
In January 2010 and February 2013, university research personnel accessed the menus posted on each restaurant’s website. Each restaurant’s website provided a pdf listing of all menu items and comprehensive nutrition information, including energy, fat, saturated fat, trans fat, sodium, protein and fibre per menu item or serving. The two primary outcomes were average nutritional quality and energy of menu items pictured on menu boards and featured on signs. A nutrition score was calculated for all food and beverage items using the Nutrient Profile Index (NPI). The NPI is based on the Nutrient Profiling Model used in the UK to identify foods that can be advertised to children on television( 31 ). This model was developed by academic researchers at the University of Oxford( 31 ), has been validated against ratings made by professional nutritionists( Reference Scarborough, Rayner and Stockley 32 ) and has been used in previous US-based research to assess nutritional quality( Reference Bragg, Liu and Roberto 33 ). It yields a continuous score from −15 (healthier) to +34 (less healthy). The score is standardized for portion size and takes account of energy, sodium, saturated fat, sugar, protein and fibre.
For ease of interpretation and following prior research( Reference Harris, Schwartz and Brownell 6 , Reference Harris, Schwartz and Munsell 26 , Reference Bragg, Liu and Roberto 33 ), a re-scaled NPI score was created for each item using the following formula: NPI score=(−2)×Nutrient Profiling Model score+70. This re-calculation produces continuous NPI scores ranging from 0 (poorest nutritional quality) to 100 (highest nutritional quality). To provide context for interpreting these scores, examples include: forty-six for vanilla ice cream, fifty-eight for fruit and nut cereal bars, sixty for canned tomato soup, sixty-six for raspberry and cranberry juice, and seventy for fruit cream cheese spread( 34 ).
Also consistent with other papers( Reference Harris, Schwartz and Brownell 6 , Reference Bragg, Liu and Roberto 33 ), this score was dichotomized to identify ‘healthier’ v. ‘less healthy’ items based on the cut-offs used in the UK to determine products that can be advertised to children: ≥64 for foods and ≥70 for beverages. Examples of foods that meet the ‘healthier’ cut-off and are allowed to be advertised to children include whole-wheat bread, fresh fruit, most nuts, chicken breast, and muesli and whole-wheat cereal with no added sugar. Examples of foods that do not meet the ‘healthier’ cut-off include cookies, most sausages and burgers, French fries, peanut butter, and most breakfast cereals that contain added sugar( Reference Rayner, Scarborough and Lobstein 35 ).
If an item had more than one size (e.g. beverages and sides such as French fries), energy information was taken from the medium size across all chains to ensure comparability.
Statistical analyses
Separate linear regressions were conducted to examine changes from 2010 to 2013 in the NPI scores and total energy of foods and beverages pictured on general menu boards, pictured on the kids’ section of menu boards and featured on signs displayed at restaurants. The first model examined changes in nutritional quality and energy of items pictured on menu boards and featured on signs by including time as a binary predictor variable. To adjust for possible nutritional differences between companies or types of foods, the second model repeated this analysis controlling for restaurant chain (McDonald’s, Burger King, Wendy’s, Taco Bell) and whether an item was a food or beverage. To examine whether the nutritional quality of featured foods changed differentially over time compared with beverages, a third model included time, restaurant chain and food or beverage as covariates, along with an interaction term between time and food or beverage. Significant interactions were probed further with separate regression analyses within foods and within beverages to better understand the nature of the interaction. To assess whether overall patterns held within the different restaurant chains, these analyses were then repeated within each chain. For all analyses, menu items that appeared within the same individual store were clustered and regression with robust variance was used to account for such correlations in promotion that may occur within each store. Taco Bell was excluded from analysis of the kids’ section of menu boards because it discontinued its kids’ menu in 2013 before data collection.
As a secondary analysis, NPI scores and energy for items pictured on menu boards and featured on signs were compared among chains in 2013 only using linear regression. These models included chain as an independent variable and controlled for food or beverage. Regression with robust variance was also used to examine changes in the proportions of ‘healthier’ featured foods and beverages in 2013 compared with 2010. To classify foods as ‘healthier’ or ‘less healthy,’ the specified NPI cut-offs were used, as done in prior research( Reference Bragg, Liu and Roberto 33 ). Since these cut-offs are defined differently for foods and beverages, these analyses did not control for food or beverage. Analyses were conducted separately for items pictured on general menu boards, pictured on the kids’ section of menu boards and featured on signs, and were conducted overall, controlling for chain, as well as separately for each chain.
Prior to conducting analyses, missing data were assessed. Less than 10 % of data for each restaurant had missing nutritional information in the menu boards analysis (McDonald’s, 0·12 %; Burger King, 5·00 %; Wendy’s, 8·25 %; Taco Bell, 5·09 %). Items were missing nutrition information if they were not listed on the restaurant’s website, usually because they were regional products, tests or new products, or discontinued products. An examination of the distribution of food and beverage categories in missing data compared with the distribution in non-missing data revealed that nutritional data were more likely to be missing for desserts at McDonald’s, Burger King and Wendy’s, for coffee beverages at Burger King, and for lunch and dinner sides at Taco Bell. In the sign analysis, over 20 % of the menu items from Wendy’s and Taco Bell were missing nutritional information, probably because items on signs were more likely to be newer or available for a limited time or in certain regions. Since the missing information could bias results, the final sign analysis included only McDonald’s (1·24 % missing data) and Burger King (4·91 % missing data). All analyses were conducted with the SAS statistical software package version 9.4.
Results
Overall NPI scores in 2010
In 2010, overall mean NPI score was 53·3 (se 0·2) for foods and 68·7 (se 0·1) for beverages pictured on general menu boards, both of which were below the cut-off for ‘healthier’ items allowed to be advertised to children in the UK. Mean NPI scores for items featured on signage were similar, at 47·9 (se 0·3) for foods and 69·2 (se 0·1) for beverages. Mean NPI scores for items pictured on the kids’ section of menu boards were somewhat higher, at 55·5 (se 0·5) for foods and 70·6 (se 0·1) for beverages. The latter score of 70·6 indicated an average score for pictured beverages that was in the ‘healthier’ category.
Changes in nutritional quality of marketed items across restaurant chains
Changes over time in the nutritional quality of featured items across all four chains are shown in Table 1 and changes broken down by restaurant chain are shown in Tables 2–4. Figure 1 shows changes from 2010 to 2013 in unadjusted mean NPI scores and total energy by chain for items featured on general menu boards, the kids’ section of menu boards and signs.
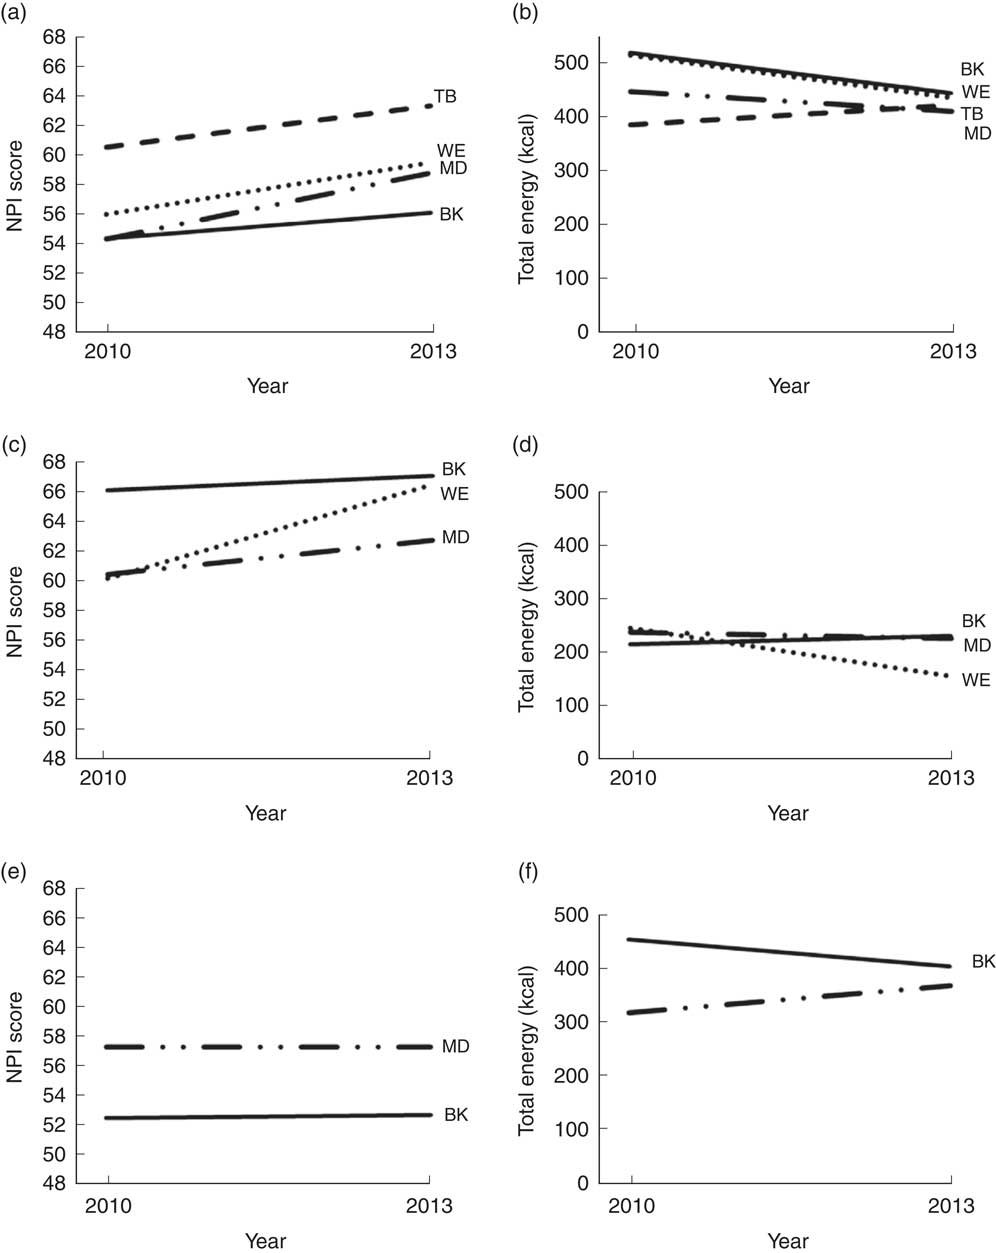
Fig. 1 Change in mean Nutrient Profile Index (NPI) scores (a, c, e) and energy (b, d, f) from 2010 to 2013 in all menu items marketed on general menu boards (a, b), the kids’ section of menu boards (c, d) and signs (e, f) in four major (US) fast-food restaurant chains (100 locations per chain: ![]() , McDonald’s (MD);
, McDonald’s (MD); ![]() , Burger King (BK);
, Burger King (BK); ![]() , Wendy’s (WE);
, Wendy’s (WE); ![]() , Taco Bell (TB)). NPI is an overall nutritional quality score based on energy, sodium, saturated fat, sugar, protein and fibre(
Reference Harris, Schwartz and Munsell
26
); scores range from 0 (poorest nutritional quality) to 100 (highest nutritional quality). Values plotted represent unadjusted mean NPI scores and energy (to convert to kJ, multiply kcal values by 4·184), but restaurant abbreviations in plots denote chains where mean differences across time were significant (at P<0·05) in adjusted analyses. Taco Bell was not included in the kids’ menu board analysis (c, d) because it discontinued its kids’ menu in 2013 before data collection. Wendy’s and Taco Bell were not included in the sign analysis (e, f) due to missing data.
, Taco Bell (TB)). NPI is an overall nutritional quality score based on energy, sodium, saturated fat, sugar, protein and fibre(
Reference Harris, Schwartz and Munsell
26
); scores range from 0 (poorest nutritional quality) to 100 (highest nutritional quality). Values plotted represent unadjusted mean NPI scores and energy (to convert to kJ, multiply kcal values by 4·184), but restaurant abbreviations in plots denote chains where mean differences across time were significant (at P<0·05) in adjusted analyses. Taco Bell was not included in the kids’ menu board analysis (c, d) because it discontinued its kids’ menu in 2013 before data collection. Wendy’s and Taco Bell were not included in the sign analysis (e, f) due to missing data.
Table 1 Linear regression showing changes in mean Nutrient Profile Index (NPI) scores and total energy from 2010 to 2013 for foods and beverages marketed on menu boards and signs, averaged across four major (US) fast-food chains (100 locations per chain)
NPI is an overall nutritional quality score based on energy, sodium, saturated fat, sugar, protein and fibre( Reference Harris, Schwartz and Munsell 26 ); scores range from 0 (poorest nutritional quality) to 100 (highest nutritional quality).
To convert energy to kJ, multiply kcal values by 4·184.
* Indicates significant differences between 2010 and 2013 at P<0·05.
† N represents the total number of times that items in each category were marketed across all stores.
‡ N for total energy is not always the same as N for NPI scores for the same year due to missing serving size information for some of the items, which is required to calculate NPI scores.
§ Adjusted effects are adjusted for food or beverage and restaurant chain.
║ Adjusted effects are adjusted for restaurant chain.
¶ Indicates that the interaction term between time and food or beverage was significant in adjusted models.
Table 2 Linear regression showing changes in Nutrient Profile Index scores (NPI) and total energy from 2010 to 2013 for foods and beverages marketed on menu boards and signs at McDonald’s (100 locations in the USA)
NPI is an overall nutritional quality score based on energy, sodium, saturated fat, sugar, protein and fibre( Reference Harris, Schwartz and Munsell 26 ); scores range from 0 (poorest nutritional quality) to 100 (highest nutritional quality).
To convert energy to kJ, multiply kcal values by 4·184.
* Indicates significant differences between 2010 and 2013 at P<0·05.
† N represents the total number of times that items in each category were marketed across all stores in the given chain.
‡ Adjusted effects are adjusted for food or beverage.
§ Indicates that stratified analyses were not run due to insignificant interaction term.
║ Indicates that the interaction term between time and food or beverage was significant in adjusted models. Stratified regressions for foods and beverages were run only if the interaction term was significant.
Table 3 Linear regression showing changes in Nutrient Profile Index (NPI) scores and total energy from 2010 to 2013 for foods and beverages marketed on menu boards and signs at Burger King (100 locations in the USA)
NPI is an overall nutritional quality score based on energy, sodium, saturated fat, sugar, protein and fibre( Reference Harris, Schwartz and Munsell 26 ); scores range from 0 (poorest nutritional quality) to 100 (highest nutritional quality).
To convert energy to kJ, multiply kcal values by 4·184.
* Indicates significant differences between 2010 and 2013 at P<0·05.
† N represents the total number of times that items in each category were marketed across all stores in the given chain.
‡ N for total energy is not always the same as N for NPI scores for the same year due to missing serving size information for some of the items, which is required to calculate NPI scores.
§ Adjusted effects are adjusted for food or beverage.
║ Indicates that the interaction term between time and food or beverage was significant in adjusted models. Stratified regressions for foods and beverages were run only if the interaction term was significant.
¶ Indicates that stratified analyses were not run due to insignificant interaction term.
Table 4 Linear regression showing changes in Nutrient Profile Index (NPI) scores and total energy from 2010 to 2013 for foods and beverages marketed on menu boards and signs, at Wendy’s and Taco Bell (100 locations per chain in the USA)

NPI is an overall nutritional quality score based on energy, sodium, saturated fat, sugar, protein and fibre( Reference Harris, Schwartz and Munsell 26 ); scores range from 0 (poorest nutritional quality) to 100 (highest nutritional quality).
To convert energy to kJ, multiply kcal values by 4·184.
* Indicates significant differences between 2010 and 2013 at P<0·05.
† N represents the total number of times that items in each category were marketed across all stores in the given chain.
‡ N for total energy is not always the same as N for NPI scores for the same year due to missing serving size information for some of the items, which is required to calculate NPI scores.
§ Adjusted effects are adjusted for food or beverage.
║ Wendy’s was not included in the sign analysis due to missing data.
¶ Taco Bell was not included in the kids’ menu board analysis because it discontinued its kids’ menu in 2013 before data collection, nor in the sign analysis due to missing data.
** Indicates that the interaction term between time and food or beverage was significant in adjusted models. Stratified regressions for foods and beverages were run only if the interaction term was significant.
†† Indicates that stratified analyses were not run due to insignificant interaction term.
General menu boards
Across chains, pictured menu board items became healthier over time based on significant increases in mean NPI scores and decreases in mean energy after adjusting for food or beverage category and restaurant chain (Table 1). Moreover, the interaction between time and food or beverage was significant for both NPI scores and energy (P<0·001). Foods, which made up a larger proportion of pictured items than beverages, improved in both NPI scores and energy (P<0·001) over time; however, pictured beverages became significantly less healthy, decreasing in NPI scores and increasing in energy (P<0·001). Although foods improved in NPI scores, their mean score in 2013 (57·7 (se 0·2)) was still below the cut-off designating ‘healthier’ foods.
An identical pattern of results was observed for McDonald’s and Burger King (Tables 2 and 3). Wendy’s (Table 4) had a similar pattern of results, except that rather than declining in nutritional value, pictured beverages did not change on either outcome (P=0·822 for NPI scores and P=0·397 for energy). For Taco Bell (Table 4), pictured items on menu boards became healthier based on NPI scores, but also increased in energy in adjusted analyses. Both pictured foods and beverages increased in energy.
The kids’ section of menu boards
Across all four chains, pictured items on the kids’ section of menu boards became significantly healthier over time, increasing in NPI scores and decreasing in energy in adjusted analyses (Table 1). Although both pictured foods and beverages improved in nutritional quality over time and the interaction with time for both categories was significant for NPI scores (P=0·008) and energy (P<0·001), foods had larger improvements than beverages (P<0·001 for both stratified models). However, in 2013, pictured foods on the kids’ section of menu boards still did not meet the cut-off designating ‘healthier’ foods (mean NPI score 62·5 (se 0·7)), while beverages did (mean NPI score 73·2 (se 0·2)).
An identical pattern was observed for Wendy’s (Table 4). For McDonald’s (Table 2), although there was no significant interaction between time and food or beverage when examining NPI scores (P=0·174), a significant interaction for energy (P=0·003) revealed that only pictured foods decreased significantly in energy (P=0·017), while beverages did not change (P=0·070). Conversely, for Burger King (Table 3), the interaction between time and food or beverage was significant only for NPI scores (P<0·001), with foods showing larger improvements in NPI scores (difference=7·19; P<0·001) than beverages (difference=2·08; P<0·001); there was no significant difference for energy (P=0·184).
Signs
Total featured items on signs became significantly healthier over time based on both nutrition outcomes in adjusted analyses (Table 1). However, the interaction between time and food or beverage was significant for both NPI scores and energy (P<0·001). Although featured foods became significantly healthier over time (P<0·001 for NPI scores and energy), beverages became significantly less healthy (P<0·001 for NPI scores and energy). Neither foods nor beverages met the NPI cut-offs designating ‘healthier’ items.
An identical pattern held for Burger King (Table 3). For McDonald’s (Table 2), total featured items increased significantly in NPI score, but did not change in energy. An identical pattern for the interaction held, with featured foods becoming healthier over time (P<0·001 for NPI scores and energy) and beverages becoming less healthy (P<0·001 for NPI scores and energy).
Comparing marketing practices across restaurant chains in 2013
General menu boards
In 2013, after adjusting for food or beverage, there were significant differences across chains in both NPI scores and total energy of pictured items on general menu boards (P<0·001 for both outcomes). Taco Bell had the healthiest mean NPI score for pictured items, while Burger King had the worst, and both Taco Bell and Burger King differed significantly from each of the other chains (P<0·001). Items pictured at Burger King and Wendy’s also had significantly higher mean energy than at Taco Bell (P<0·001) and McDonald’s (P<0·001 for Burger King and P=0·002 for Wendy’s).
The kids’ section of menu boards
Restaurants differed significantly in NPI scores and energy amounts (P<0·001) of pictured items on the kids’ section of menu boards. Items pictured at Burger King had significantly higher mean NPI scores than those at McDonald’s and Wendy’s (P<0·001), after adjusting for food or beverage. However, items pictured at Wendy’s had the lowest mean energy, which differed significantly from the other two chains (P<0·001).
Signs
In 2013, featured items on signs at McDonald’s were significantly healthier than at Burger King, with higher NPI scores (P<0·001) and lower energy (P=0·041).
Changes in proportions of featured items that were ‘healthier’ on menu boards and signs
Overall, the proportion of pictured items that met the ‘healthier’ cut-off increased from 2010 to 2013 on general menu boards (33·9 % in 2010 to 47·2 % in 2013, P<0·001) and all four chains demonstrated similar increases (see online supplementary material, Fig. S1). The proportion of pictured items meeting the ‘healthier’ cut-off on kids’ menu boards also increased from 50·8 % to 62·3 % (P<0·001), but this was driven by increases in the proportion of ‘healthier’ items at Wendy’s (P<0·001), while the corresponding proportion decreased at Burger King (64·5 % in 2010 to 50·8 % in 2013, P<0·001) and did not change at McDonald’s. Overall, the proportion of ‘healthier’ items on signs also increased (27·5 % to 32·0 %, P=0·001). This was driven by significant increases in the proportion of ‘healthier’ items featured at Burger King (23·3 % in 2010 to 28·5 % in 2013, P=0·001), as there were no changes at McDonald’s (P=0·118; see online supplementary material, Table S1).
Discussion
Items pictured on general menu boards and featured on signs of four major fast-food chains remained at poor nutritional levels in 2013, despite modest improvements in average nutritional quality and declines in average energy in 2013 compared with 2010. Despite small improvements, these marketed items, on average, remained below the NPI cut-offs for healthier products for each of the chains. The small observed improvements on general menu boards and signs were primarily driven by featured foods, as the nutritional quality of featured beverages worsened over time at McDonald’s, Burger King and Taco Bell, and remained unchanged at Wendy’s.
On the kids’ section of menu boards, results suggest that pictured items showed the most consistent improvements for both foods and beverages. For Burger King and Wendy’s, these improvements were of a larger magnitude compared with those seen on general menu boards or signs, but no formal statistical tests were conducted to compare changes on the kids’ section of the menu boards v. general menu boards or signage between chains. Although beverages pictured on general menu boards and featured on signs often declined in average nutritional quality, the kids’ section of menu boards pictured healthier beverages over time. Furthermore, in 2013 the mean NPI scores of foods at Burger King and of beverages at all three chains in the kids’ menu board analysis exceeded the cut-offs signifying healthier items. Finally, on general and kids’ menu boards and signs, the proportion of healthier marketed items increased in 2013 compared with 2010, with the largest proportions of healthier items occurring on the kids’ section of menu boards at both years.
The finding that pictured beverages on the kids’ section of menu boards became healthier over time pre-dates pledges made in 2014 by McDonald’s, Burger King and Wendy’s to remove soda from their children’s meals( Reference Esterl 36 ). Even in advance of such pledges, the total number of beverages shown on the kids’ section of menu boards at McDonald’s and Burger King dropped considerably from 2010 to 2013 (from eighty-six to nineteen in McDonald’s; from 209 to twenty-two in Burger King). Furthermore, in all three chains, only milk (flavoured or plain) or juice were pictured on the kids’ section of menu boards in 2013, whereas in 2010 sodas (non-diet and diet) and other sweetened fruit drinks were also shown. More recent data are needed to determine whether further improvements in marketing have been made in the light of recent pledges to remove soda.
The self-regulatory efforts by the fast-food industry to promote more nutritious choices, especially for children, must be evaluated with the limitations of these pledges in mind. Although Burger King and McDonald’s are members of the CFBAI, which includes many of the nation’s largest food and beverage companies and which aims to improve the quality of foods advertised to children( Reference Kolish and Peeler 37 ), these pledges do not cover marketing at restaurants. The voluntary decision by McDonald’s to post energy information on menu boards may also reflect a shift towards greater transparency( 22 ). Some research on voluntary energy labelling has shown that it may encourage restaurants to introduce menu items with lower energy content( Reference Bleich, Wolfson and Jarlenski 38 ), while other work has indicated that restaurants also simply add more high-energy items as well( Reference Harris, Schwartz and Munsell 26 ).
Taken together, these results suggest that restaurants have made only modest improvements in the nutritional quality of the foods they actively promote at restaurants, despite their public pledges. Furthermore, despite these small improvements, marketed foods and beverages in 2013 were, on average, still below the ‘healthier’ cut-offs, especially those shown on general menu boards or signage. Another study, which evaluated the nutritional quality of all foods and beverages offered on kids’ menus at forty-five chain restaurants in the USA, found no meaningful improvements in average energy, saturated fat and sodium content between 2012 and 2015. Furthermore, restaurants participating in the industry’s self-regulatory Kids LiveWell programme did not have healthier kids’ menus, suggesting minimal effects of the programme( Reference Moran, Block and Goshev 39 ). The results of the present study also raise an additional concern that McDonald’s and Burger King appear to be promoting beverages with more energy over time. Also at Taco Bell, both foods and beverages pictured on general menu boards showed significant increases in energy over time. There is still a clear need for improvement, especially given the low nutritional baseline of fast-food menu options found in the present study and elsewhere( Reference Kirkpatrick, Reedy and Kahle 40 ).
Research has suggested that even after the CFBAI was created, children still continued to see many advertisements for nutritionally poor foods on television and their exposure to fast-food advertisements in particular has increased( Reference Powell, Schermbeck and Szczypka 41 ). Furthermore, in a study examining television advertisements from McDonald’s and Burger King, even after their self-regulation pledges, children recalled toy premiums and cross-promotions more frequently than healthy foods and were still more likely to recall food items other than apples or milk( Reference Bernhardt, Wilking and Gilbert-Diamond 42 ). This suggests that if unhealthy items on the kids’ section of menu boards are pictured with toys or movie characters, children could still be drawn to the unhealthiest offerings, despite any improvements in the nutrition of pictured items. Finally, Taco Bell’s removal of its kids’ menu might lead to more children ordering adult portion sizes. Future research should also examine whether the chain might continue to market heavily to children on signs, despite having no kids’ menu.
The current research has some limitations. Despite the ability to analyse changes over time, data were available from only two time points, ending in 2013. Future research should examine longer-term and current trends in fast-food marketing and promotion at restaurants in the light of industry pledges and soon-to-be-implemented energy labelling legislation. In addition, the present study did not examine the nutritional quality of children’s meals that come with toys, a common marketing strategy that can influence children’s meal choices. Another limitation is that the sample of restaurants at each time point differed. Even though restaurants were randomly selected within market areas in each year, differences in sampling between years could nevertheless affect results. In addition, we used the nutrition information provided by restaurants, which may have some inaccuracies( Reference Urban, McCrory and Dallal 43 ). However, research has shown that such inconsistencies are reduced when averaging across all foods together, as we have done in our study, compared with looking at individual items. An additional limitation is that the nutrient profiling model we used focuses largely on the contribution of individual nutrients to determine a nutritional quality score and does not take account of other important nutritional aspects such as percentage of whole grains. Finally, there was missing nutritional information on many items featured on signs because signs typically feature limited-time or special-promotion items that are not included on restaurant websites. This restricted the analysis to only two chains, thereby limiting the generalizability of these findings. Furthermore, in all analyses, items with missing nutritional information were excluded; although such items made up less than 10 % of the total data, their exclusion could nevertheless bias results if items with missing nutritional information were systematically more or less healthy than items with this information.
The present study also has a number of strengths. It is the first to date to focus specifically on the changes in nutritional quality of foods and beverages promoted in-store in fast-food restaurants over time. A large sample of four of the nation’s major fast-food chains was studied and items pictured on menu boards as well as those featured on signs were comprehensively evaluated within and on the exterior of stores. Finally, data were collected at the same time during each year, ensuring comparability across time.
Conclusion
In conclusion, the present study found modest improvements in the nutritional quality of menu items promoted at the point of purchase across four major fast-food chains in the USA, with the greatest improvements for the kids’ section of menu boards. Although improvements were found for foods pictured on general menu boards and featured on signs, the nutritional quality of marketed beverages declined or remained unchanged in all chains. Despite limited improvements, marketed items nevertheless were on average of poor nutritional quality in 2013. In addition, items pictured on general menu boards in Taco Bell increased in energy. These findings highlight that fast-food restaurants still have ample opportunity to market healthier foods and beverages at stores.
Acknowledgements
Financial support: C.A.R. is supported by the National Institute on Aging of the National Institutes of Health (NIH) (award number P30AG034546). The content of this article is solely the responsibility of the authors and does not necessarily represent the official views of NIH. The National Institute on Aging of NIH had no role in the design, analysis or writing of this article. Conflict of interest: None. Authorship: J.S. formulated the research questions, analysed the data, drafted the initial manuscript and approved the final manuscript as submitted. J.L.H. provided the data, helped interpret the data, critically reviewed the manuscript and approved the final manuscript as submitted. K.K.D. and D.R.W. helped formulate the research questions and interpret the data, critically reviewed the manuscript and approved the final manuscript as submitted. C.A.R. contributed to formulating the research questions, helped interpret the data, critically reviewed the manuscript and approved the final manuscript as submitted. Ethics of human subject participation: Not applicable.
Supplementary material
To view supplementary material for this article, please visit https://doi.org/10.1017/S1368980018000629


