


BMI category has traditionally been defined as an indicator of body mass. Throughout the process of sexual maturation, body mass shows expressive temporal variations in its composition and gain speed. Overall, this variability challenges the conventional association among the increase in body mass and body adiposity and health risks. Regardless of these challenges, some researchers support the need for an adjustment of sexual maturation in the nutritional assessment of adolescents, while other researchers are opposed to this need(Reference Cole, Bellizzi and Flegal1,Reference Bini, Celi and Bartoli2) .
The arguments in favour of adjustment of the parameters of nutritional assessment of adolescents by sexual maturation are based on empirical observations of two physiological phenomena: (1) increase in the variability of the intra-stage BMI of sexual maturation and (2) increase in the amount of adipose tissue and body mass, especially in girls(Reference Barbosa, Franceschini and Priore3–Reference Adami, Benedet and Lopes6). Contrary arguments are also based on empirical observations: (1) growth and development at puberty are biologically regulated processes and, in this sense, intra-stage variability of maturation is not intense to the point of confusing the assessment between the pubertal stages and (2) obesity or overweight are associated with the precocity of sexual maturation, but it is not associated with the differences between the pubertal stages(Reference Wang and Moreno7–Reference He, Guan and Liu9).
Body mass has been considered a key parameter in the analysis of anthropometric differences among the stages of sexual maturation. Previous studies showed that the value of body mass varies through the sexual maturation stages according to age and it presents a secular trend of increasing in the early stages of sexual maturation(Reference Adami, Benedet and Lopes6,Reference Wang and Moreno7) . Additionally, there are some studies that show the association between body mass and the early onset of sexual maturation in adolescents(Reference Vitolo, Campagnolo and Barros10–Reference Vidal-Linhares12).
Longitudinal population-based studies conducted in the Netherlands showed that body mass was highly associated with the initiation of body changes during the process of sexual maturation(Reference Mul, Fredriks and van Buuren13,Reference Talma, Schönbeck and van Dommelen14) . Thus, some studies suggest that body mass is an expressive modifier of the body’s physical parameters and it is an indicator of sexual maturation(Reference He, Guan and Liu9,Reference Vitolo, Campagnolo and Barros10) . Previous studies have used nutritional assessment indicators in a one-dimensional model and they presented the need to adjust BMI according to the stages of sexual maturation proposed by Tanner protocol(Reference Miranda, Faria and Faria5,Reference Adami, Benedet and Lopes6,Reference Wagner, Sabin and Pfäffle11) . However, there is evidence that this one-dimensionality can compartmentalise and it can make complex the interpretation of anthropometric, biochemical or body composition changes throughout the sexual maturation process(Reference Fredriks, van Buuren and Jeurissen15,Reference Benedet, Lopes and Adami16) .
One suggestion to overcome the difficulties resulting from the application of one-dimensional method is the application of multivariate analysis for the definition of phenotypes, which allows a multidimensional analysis based on simultaneous use of different categories of indicators, being possible to identify the latent variables(Reference Fredriks, van Buuren and Burgmeijer17–Reference Ifeoma21). The multivariate analysis applied to the assessment of the BMI category of adolescents allows us to explore the multiple interactions between the phenomenon of sexual maturation and the process of physical growth. In addition, it enables the analysis of its association with anthropometric, body composition and biochemical variables.
In our previous study carried out with data from adolescents living in Piracicaba-SP-Brazil, body phenotypes (BP) were defined based on multivariate analysis of the anthropometric, body composition and biochemical variables. The main results were: (1) adiposity or body mass variables and sexual maturation variables were independents and (2) only positive association between BMI and BP characterised by adiposity variables(Reference Cumpian-Silva, Mazzeti and Rinaldi20). This result strengthens our argument against the need for adjusting sexual maturation in nutritional assessment of adolescents, and it also demonstrates the distinction between sexual maturation and adiposity(Reference Cumpian-Silva, Mazzeti and Rinaldi20).
The application of multivariate analysis in the assessment of BMI category allows us to explore the differences found in the literature about the adjustment of BMI cut-off points according to the different stages of sexual maturation. In this sense, the description of BP based on anthropometric, body composition and biochemical variables seems to induce a new understanding of the body physical changes during sexual maturation(Reference Cumpian-Silva, Mazzeti and Rinaldi20).
In the present study, we have applied multivariate analysis in the data from adolescents living in different epidemiological and environmental contexts. Our study aim was to identify the BP using multivariate analysis and to investigate their association with body mass, in probabilistic samples of adolescents from different population surveys conducted in Brazil and in the United States.
Methods
Study design and population
In this study, we selected data from adolescents aged between 10 and 15 years old from four surveys:
Analysis of BMI-for-age parameters according to body composition values (2007); (1) (Análise dos parâmetros do IMC-para-idade segundo os valores de composição corporal (2007)); (2) Determinants of Obesity Risk among adolescents from surveys of schoolchildren with a mixed sample: transversal and longitudinal (IAP-SP) (2012); (Determinantes do Risco de Obesidade entre adolescentes a partir de inquéritos de escolares com amostra mista: transversal e Longitudinal (IAP-SP) (2012)); (3) Trend analysis of the prevalence of obesity and associated factors in schoolchildren aged 7–14 years in the city of Florianópolis, SC (2007/2012); (Análise de tendência da prevalência de obesidade e fatores associados em escolares de 7 a 14 anos do município de Florianópolis, SC (2007/2012)); and (4) National Health and Nutrition Examination Survey (NHANES III) (1994); (NHANES III (1994)). These studies were conducted with probability sampling carried out in three Brazilian cities, which are: (1) São Paulo-SP (2007) (n 1134; 63·5 % girls); (2) Piracicaba-SP (2012) (n 833; 57 % girls); (3) Florianópolis-SC in 2007 (n 2259; 52·1 % girls) and in 2012 (n 1722; 53·5 % girls); and in the United States in 1994 (n 3321; 58 % girls).
Regardless of the surveys carried out in Brazil, all participants, parents or guardians signed the informed consent form voluntarily and consciously. We declare that all personal identifying data are confidential and have not been published. In these studies, anthropometric measurements of height, weight and skinfolds were performed according to the procedures recommended by the Lohman et al. (1988/2006), while the anthropometric measurements of the trunk (waist and hip circumference) were performed according to the WHO (2008) protocol. WHO protocol recommends that patients expire and then inhale so that the measurement of waist and hip circumferences are measured correctly and they do not suffer any type of interference(Reference Lohman, Roche and Martorell22–24).
The NHANES survey evaluates biochemical, physical, lifestyle, anthropometric, nutritional, clinical and sociodemographic data to monitor the population over time. Its data are collected by a properly trained and standardised team following all protocols. The National Council for the Review of Ethics in Research of the National Center for Statistics in Health has approved the NHANES III study protocol. The NHANES III data used in our analysis are secondary, so we do not have access to details and personal information about the participants. However, NHANES III declares that all personal identification data are confidential, and that all participants in the survey have voluntarily and consciously signed the informed consent form(25,26) .
The details and procedures of these Brazilian and the US surveys are described in their study protocols and/or in the previous studies(Reference D’Avila, Muller and Gonsalez27–Reference Dalabona30).
Demographic, anthropometric, body composition and sexual maturation variables
BP were defined from anthropometric, body composition, biochemical, sexual maturation and demographic variables. The variables available in each survey are described as follows:
-
1. Anthropometric and body composition variables: (1) São Paulo – weight, height, triceps and trunk skinfolds (subscapular or suprailiac skinfolds), waist and arm circumferences and phase angle calculated from resistance (R) and reactance (Xc) values obtained through the bioelectrical impedance analysis (BIA)(Reference Dalabona30); (2) Florianópolis (2007 and 2012) – weight, height, triceps, calf and trunk skinfolds (subscapular or suprailiac skinfolds), waist, arm and hip circumferences(Reference Oliveira and Vasconcelos31,Reference Pinho, Adami and Benedet32) ; (3) Piracicaba – weight, height, triceps and trunk skinfolds (subscapular or suprailiac skinfolds), waist circumference and phase angle calculated from resistance (R) and reactance (Xc) values obtained through the BIA(Reference Talma, Schönbeck and van Dommelen14) and (4) United States – NHANES III – weight, height, triceps, thigh and trunk skinfolds (subscapular or suprailiac skinfolds), waist circumference, and phase angle calculated from resistance (R) and reactance (Xc) values obtained through the BIA(Reference Johnson, Dohrmann and Burt33,Reference Kuczmarski, Ogden and Guo34) .
In all surveys, anthropometric variables were assessed in the duplicates and expressed by the mean of the two values observed(Reference Lohman and Going23,Reference Cole, Bellizzi and Flegal35) . The BMI was calculated by dividing body mass (kg) by squared height (m2), and it was classified according to the International Obesity Task Force (IOTF) reference values (2013)(Reference Cole, Bellizzi and Flegal35). We decided to use the IOTF reference values because in statistical tests it was more sensitive for diagnosis of the BMI category of adolescents(Reference Cole and Lobstein8,Reference Cole, Bellizzi and Flegal35) . The phase angle was estimated as the arctangent of the ratio between reactance and resistance(Reference Dittmar36,Reference Fernandes, Rosa and Buonani37) . For the BIA, we applied the protocol proposed by the manufacturer’s manual (2000-M Analyzer produced by DATA Input GmbH).
-
2. Sexual maturation: The sexual maturation was assessed according to Tanner protocol(Reference Marshall and Tanner38,Reference Marshall and Tanner39) , which is based on the stages of pubic hair distribution for both sexes, and in the stages of breast development in girls and genitalia development in boys. The information about the sexual maturation stages were self-reported in the surveys from Brazil (São Paulo, Florianópolis and Piracicaba cities). The collection team of the Brazilian surveys showed to the adolescents an illustration with the five stages of pubic, gonad and breast development and the adolescents self-reported into one of the five stages of sexual maturation in each category(40). In the US survey (NHANES-III), sexual maturation was evaluated by a trained healthcare professional(41). Regardless of the menarche variable for Brazilian girls, it was present in the questionnaires, but we do not consider this variable as essential, since our aim study was to describe the BP estimated by multivariate analysis and to show its association with body mass. And also, we would need the spermarche variable for boys, and we did not have this variable available. Additionally, we analysed the main components, including the menarche variable for girls and we did not identify any significant differences in the results. Thus, we decided to remove it in the analysis presented in this study.
-
3. Biochemical: In the Piracicaba-SP and NHANES III surveys, adolescent blood samples were collected after a 12-h fast (42,43) . The values of TAG (mg/dl), glucose (mg/dl), Hb (g/dl), total cholesterol and LDL-cholesterol were assessed. The total cholesterol/LDL ratio (mg/dl) was calculated by dividing two parameters (total cholesterol and LDL cholesterol)(44–Reference Gibson46). Surveys from São Paulo and Florianópolis do not have the biochemical variable data.
-
4. Demographic: In all surveys, sex, age and skin colour were all collected from a questionnaire applied to the adolescents and filled in with trained professionals. We categorised the variables as follows: (1) sex as female and male; (2) age in complete years and (3) skin colour as: white, black and brown.
Data analysis
In all surveys, we applied principal component analysis (PCA) to calculate BP (latent variables) from demographic, anthropometric, body composition, biochemical and sexual maturation variables. For the analysis, we maintained the components with eigenvalues higher than │0·7│ and with eigenvectors higher than │0·2│. We estimated through the Kaiser–Meyer–Olkin test the adequacy of the sample in relation to the degree of partial correlation among the variables(Reference Jolliffe47,Reference Joliffe and Morgan48) . The label of BP was composed by BP followed by the number that designates the order of variability explained (BP1–BP4). In the analysis performed only with the variables common to all the surveys, we adopted another label that expresses the main variable of interest for BMI category assessment (e.g. BP1_puberty).
The PCA was applied separately by sex and in both sexes to verify possible differences in the definition of the BP. However, no significant changes were observed and we decided to estimate the BP without separation by sex. We applied four different PCA analyses. In the first PCA analysis, all demographic, anthropometric, biochemical, body composition and sexual maturation variables were included to define BP according to the availability of each survey.
In the second PCA analysis, sexual maturation variables were excluded. The reason for that exclusion was to check counterfactually the maintenance of the BP (order and composition). And also, the same or similar definition of the phenotypes would indicate the factorial basis of the multivariate matrix and reliable results.
In the third PCA analysis, BP were characterised from the common variables available in all surveys (height, weight, triceps skinfold, trunk skinfold, waist circumference and age). We tested it with and without the variables of sexual maturation. Our objective was to test if the BP defined kept the same composition when it was used only the common variables in all the surveys.
Finally, in the fourth PCA analysis, BP was defined to include all surveys. The third and fourth PCA analyses were relevant to verify the replicability of the results in the different surveys with the same base of variables.
ANOVA and Tukey’s multiple comparison tests were performed to verify the differences between skin colour and the stages of pubertal development. In addition, we applied these tests to check the differences among skin colour groups and among BP and anthropometric, body composition and biochemical variables. The association between BP and BMI was calculated through the Pearson (r) estimator. All analyses were performed in the statistical software Stata 13® at a significance level of 0·05 and a 95 % CI.
Results
The number of BP estimated in each survey was different: three (BP1–BP3) in the São Paulo survey, two in the Florianópolis survey in the year 2007 (BP1–BP2), three in the Florianópolis survey in the year 2012 (BP1–BP3), four in the Piracicaba survey (BP1-BP4) and four in the United States (BP1–BP4). These BP, respectively, presented a total variability of 89·0 % in São Paulo, 85·6 % in Florianópolis in the year 2007, 65 % in Florianópolis in the year 2012, 69·3 % in Piracicaba and 72·4 % in NHANES III. The Kaiser–Meyer–Olkin test values in all the surveys indicated high consistency of the multivariate matrices (Table 1).
Table 1 Factorial loads of the body phenotypes of adolescents (10–15 years old) generated from anthropometric, body composition, sexual maturation, biochemical and demographic variables available and estimated by principal component analysis (PCA) in the Brazilian surveys of Piracicaba, São Paulo and Florianópolis and in the US survey (NHANES III)
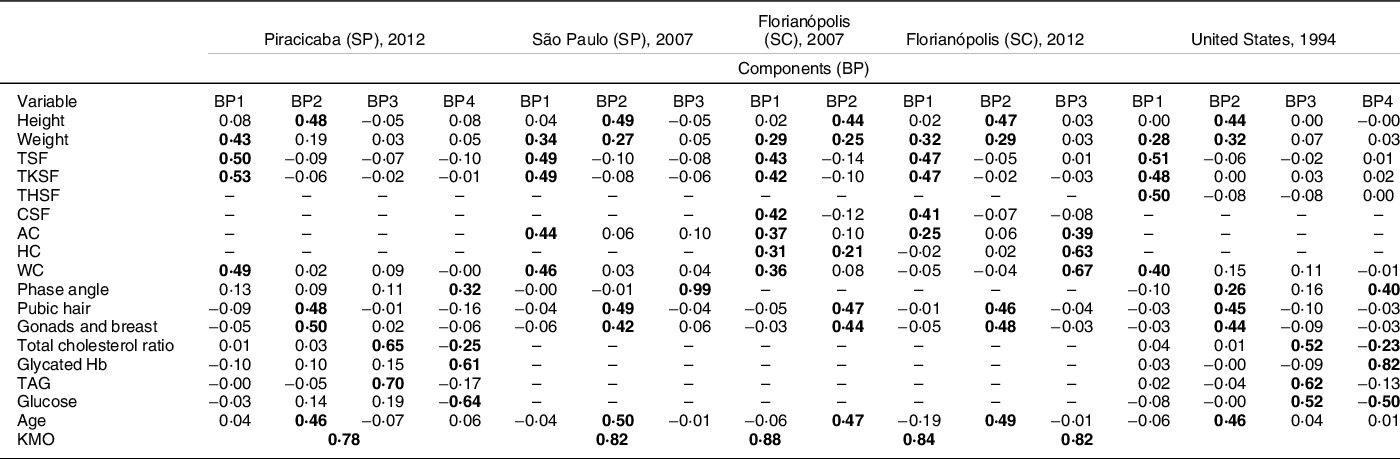
BP, body phenotype; PCA, principal components analysis; TSF, triceps skinfolds; TKSF, trunk skinfolds. THSF, thigh skinfolds; CSF, calf skinfolds; AC, arm circumference; HC, hip circumference; WC, waist circumference; KMO, Kaiser–Meyer–Olkin; (-), variable not available in the survey; bold values indicate values greater than 0·2; SP, São Paulo; SC, Santa Catarina.
The first two BP (BP1 and BP2) were defined in all surveys in a similar way. The BP1 is a phenotype characterised by variables that express body fat (skinfolds) and body volume (body mass and circumferences); this phenotype presented a weak and negative association (factorial loads) with the variables of sexual maturation (pubic hair, gonads and breasts). The BP2 was characterised by height, age and sexual maturation variables. In the Florianopolis survey (2007), BP2 also presented a positive load for hip circumference.
The third BP (BP3) was characterised by biochemical variables and it showed different results among the surveys. In the São Paulo survey, BP3 was characterised by phase angle, an indicator associated with the non-adipose component of body mass (hydration and total of body cells). While in the Florianópolis survey (2012), BP3 was characterised by variables that express body volume (circumferences). On the other hand, in Piracicaba and the US surveys, BP3 was characterised by biochemical variables associated with accumulation of body fat (total cholesterol and TAG). In the US survey, this phenotype also showed a positive association with glucose.
The fourth BP (BP4) was estimated only in the Piracicaba and in the US surveys. BP4 was characterised by a positive association with metabolic variables associated with non-adipose components of body mass (phase angle) (Table 1).
The variables of sexual maturation showed high factorial loads only in BP2, which was characterised mainly by variables that reflect linear growth and expansion of all body compartments. In addition, BP2 presented a negative load for the variables that express body fat (skinfolds). BP3 and BP4 presented low or negative factorial load for sexual maturation and body fat (Table 1) in all analysed surveys.
In the second stage of analysis (Table 2), the BP presented similar results without sexual maturation variables in all the surveys. BP1 was characterised by variables that express body fat (skinfolds) and body volume (circumferences). BP2 was characterised by the variables that showed the chronological axis in adolescence: weight, height and age, with the difference that the phase angle was expressed in this BP only in the surveys that presented this variable. BP3 and BP4 also remained similar to the previous analyses. BP3 was characterised by variables that express metabolic changes related to fat mass accumulation and BP4 was characterised by metabolic variables related to lean mass in the Piracicaba and in the US surveys.
Table 2 Factorial loads of the body phenotypes of adolescents (10–15 years old) generated from anthropometric, body composition, biochemical and demographic variables available and estimated by principal component analysis (PCA) in the Brazilian surveys of Piracicaba, São Paulo and Florianópolis and in the US survey (NHANES III)
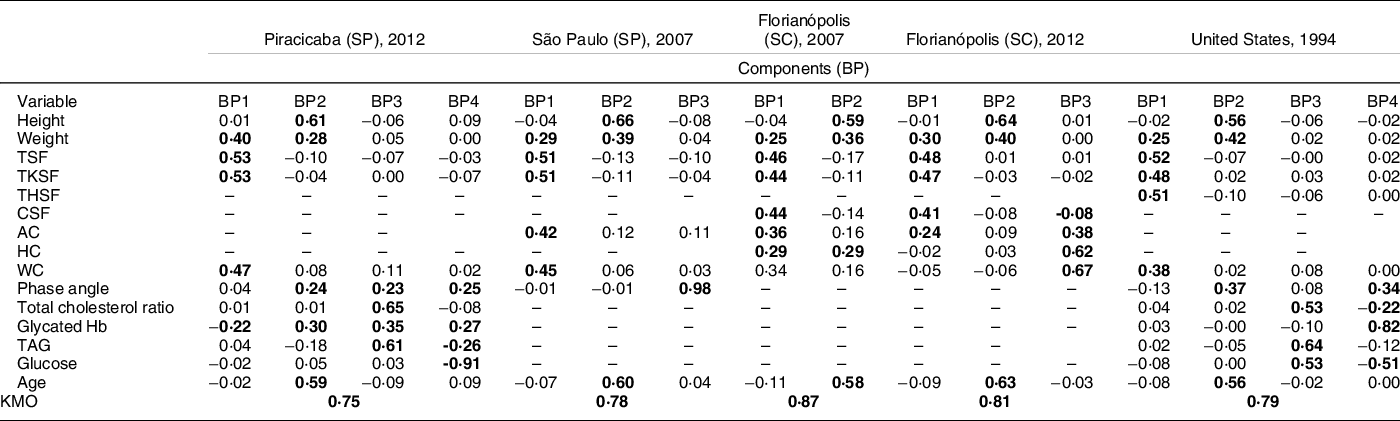
BP, body phenotype; PCA, principal components analysis; TSF, triceps skinfolds; TKSF, trunk skinfolds. THSF, thigh skinfolds; CSF, calf skinfolds; AC, arm circumference; HC, hip circumference; WC, waist circumference; KMO, Kaiser–Meyer–Olkin; (-), variable not available in the survey; bold values indicate values greater than 0·2; SP, São Paulo; SC, Santa Catarina.
In the third stage, based only on the variables common to the three surveys, we defined only two BP (BP1_puberty and BP2_adiposity). The BP1_puberty was characterised by variables that express the process of sexual maturation (sexual maturation, age, height and weight). BP2_adiposity was characterised by variables that express body fat (weight, skinfolds and circumference). It is interesting to note that at this stage of the analysis there was an inversion in the order of BP formation, variables that expressed body fat began to be represented by BP2_adiposity and the variables that represented sexual maturation started to be represented by BP1_puberty. This new order of pattern formation is explained by the redistribution of the variability found among the available variables, in other words, the variables that are in BP1_puberty have greater variability in the applied model.
In the third stage, the same BP were defined among the common variables of the surveys after the exclusion of sexual maturation of analysis. In addition, the same BP were defined in the fourth stage when PCA was performed from the pool of all surveys (overall score) (Table 3) with and without sexual maturation variables.
Table 3 Factorial loads of the body phenotypes of adolescents (10–15 years old), without sexual maturation data and with sexual maturation data, adding only the common variables between the Piracicaba, São Paulo and Florianópolis surveys in Brazil and the US survey of NHANES III, estimated by principal component analysis (PCA)
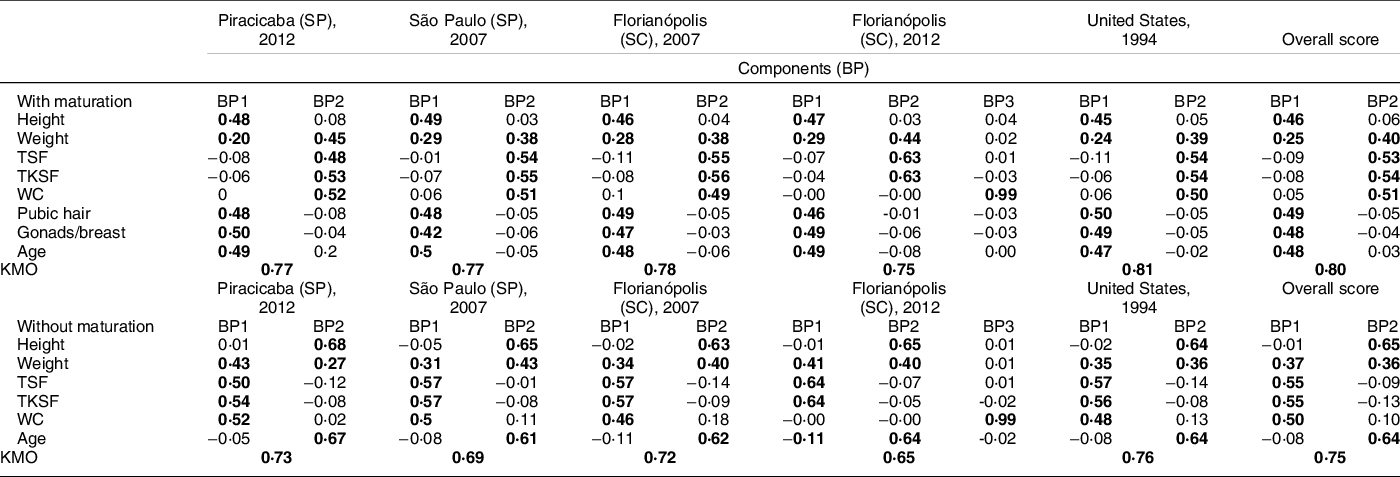
BP, body phenotype; PCA, principal components analysis; TSF, triceps skinfolds; TKSF, trunk skinfolds; WC, waist circumference; KMO, Kaiser–Meyer–Olkin; bold values indicate multivariate matrix values above 0·20, which means greater association with the pattern; SP, São Paulo; SC, Santa Catarina.
It is noteworthy that the PCA estimated two BP for the group with the variables of sexual maturation, and two BP for the group without the variables of sexual maturation. In the analysis with the inclusion of the variables of sexual maturation, BP1_puberty was characterised by variables of weight, height, sexual maturation and age; while BP2_adiposity was characterised by the variables of weight, skinfolds and waist circumference. And also, these same two BP (BP1_puberty, BP2_adiposity) were characterised without inclusion of sexual maturation variables.
Figure 1 shows the correlation coefficients between BP1, BP2 and BMI, according to sex in data pool with all surveys. The r value was higher for BP1 in all surveys and in the data pool, indicating a strong correlation between BP1 and BMI in both sexes. It is because this BP is composed of variables that represent body fat (body weight, skinfolds and circumferences) and usually BMI categories indicate health risks of mortality and morbidity according to body fat. These results are shown in Table 4.
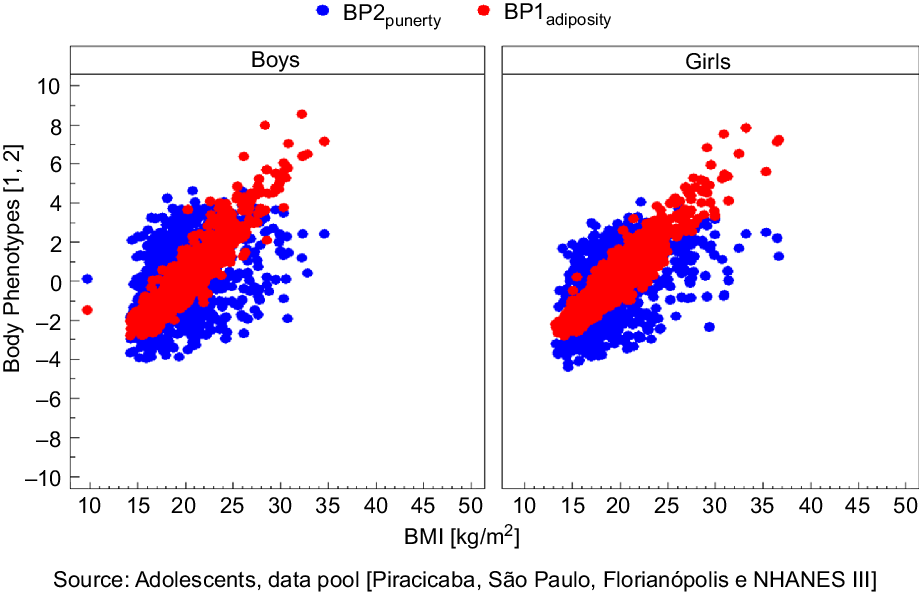
Fig. 1 Correlation of BP1 adiposity and BP2 puberty, defined by principal components analysis (PCA) with BMI, according to the sex in data pool with all surveys
Table 4 Correlation of body phenotypes (FC1_puberty and FC2_adiposity) and BMI in the Brazilian surveys and in the US survey
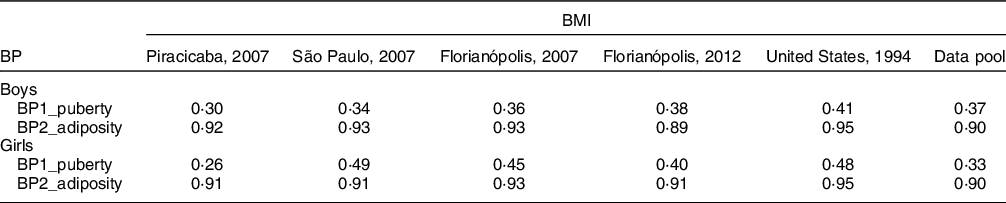
BP, body phenotype.
We observed that anthropometric, biochemical, body composition or sexual maturation variables did not show statistically significant differences among the skin colour groups of our data pool and we removed skin colour variable from our analysis.
Discussion
In the present study, we show BP that are associated with adolescent body mass. In this sense, these BP can be considered a representation of the categories of body mass in adolescents, since they indicate different body profiles according to the analysis that considers the body dimensions.
These BP are shown regardless of nationality and epidemiological context, since the findings were replicated at the individual level of each survey and in the data pool with all the surveys. We also observed that sexual maturation variables showed positive loading in BP that express linear growth, and it did not show an association with adiposity in all stages. In addition, BP showed the same composition with and without sexual maturation variables.
A multivariate analysis of the BMI category of adolescents identified up to four similar BP among the surveys analysed. It is important to emphasise that the possible number of BP generated from the PCA is equivalent to the number of variables included in the model used. In the Florianopolis survey, the number of phenotypes was lower in comparison to the other surveys due to the lower number of the available variables. We highlight the greater similarity of two BP: BP1 and BP2. The first of them characterises a BP with a greater body volume and a higher body adiposity, without association with sexual maturation (BP1) and the second characterises a BP of sexual maturation associated with the expansion of bone mass (due to the height variable) and the presence of the chronological vector (due to the age variable) (BP2).
The positive association of the body adiposity with BP1 and non-association with BP2 helps us to understand the difference in body mass composition observed in the first two BP. Although in both phenotypes body mass expansions occur, these expansions are only done with an increase in adiposity in BP1. Thus, BMI category ratings based on BMI can easily be confounded by the presence of differences in body composition and the variability of BMI and body composition. Therefore, this variability is not at random, but it is related to the physiological processes of physical development at puberty.
The variables of sexual maturation showed a strong association with the second BP (BP2), which was also composed by height and age. The profile found in this BP suggests that sexual maturation is more characteristically related to physical growth and lean mass expansion than to adipose mass expansion. Thus, the third and fourth BP showed profiles of biochemical markers or body composition that reflect the linear growth and the predominance of lean mass in body composition(Reference Cole, Bellizzi and Flegal1,Reference Bini, Celi and Bartoli2,Reference Vidal-Linhares12,Reference Chung49) .
The replication of the results across the different surveys of this study, being the Brazilian surveys with regional characteristics and the US survey with national characteristics, suggest reliability in the findings presented. The different PCA analyses applied in this study explore counterfactually and indicate that these BP sustained their structures and characteristics.
The distinction between adiposity, body composition and biochemical variables has direct implications in the process of BMI category assessment. This study is one step ahead of the use of one-dimensional indicators, since it analyses in a comprehensive and integrated way the physical, biochemical and sexual maturation measures. The results highlight the independence between the values of anthropometry, body composition, biochemical parameters and sexual maturation in BMI category assessment. The results were sustained and indicate consistency of the multivariate matrix through the covariance between the variables in the expression of the BP. Thus, our findings suggest that sexual maturation presents independence from adiposity, body composition and biochemical variables. Moreover, sexual maturation is expressed by a set of variables that represents the biological vector of body changes and accumulation of lean mass (muscles or bones) without body volume expansion. We observed in our previous study that when the survey has shown an absence of any set of variables, the characteristic BP of the absent variables are not formed, and the structure of the BP are sustained(Reference Cumpian-Silva, Mazzeti and Rinaldi20).
In general, the results indicate that anthropometric measures, body composition indicators and biochemical variables are not associated with changes in BMI values due to the sexual maturation stages. It has been shown as an effect on the development of physical growth in both sexes. According to other studies, excessive body mass accumulation during sexual maturation would be the main factor for metabolic disorders, such as changes in cholesterol, Hb and glucose, and they would not be associated with sexual maturation(Reference Daniels, Khoury and Morrison50–Reference Morrison, Barton and Biro52). In a study conducted by Bragança et al., (2020) they observed that adolescents with overweight and high body fat percentage had four biomarkers with the worst values (TAG, HDL-cholesterol, IL-6 and CRP) when compared to normal-weight adolescents. In this sense, their results indicate the positive association between overweight and higher levels of TAG and inflammation in adolescents(Reference Bragança, Oliveira and Fonseca53). Additionally, a study conducted by Cumpian-Silva et al. (2018) highlights that BP is characterised by the lean mass and it shows a positive association with the phase angle and Hb and a negative association with glucose. Thus, some BP can identify metabolic markers related to lean mass(Reference Cumpian-Silva, Mazzeti and Rinaldi20). Other studies also suggest the association between high levels of total cholesterol and TAG and the accumulation of body fat(Reference Enes and Silva54–Reference Cumpian-Silva, Rinaldi and Mazzeti56).
In this way, we can hypothesise that in adolescents, the expansion of the body mass without the height expansion simultaneously characterises the increase of the body fat, whereas the increase in the mass without the expansion of the volume characterises the process of physical growth, with accumulation of non-fat mass. These observations allow us to understand the presence of the variable body mass in the BP represented by the variables of sexual maturation (BP2). In addition, we highlight that the body mass variable becomes a potential confounding factor in the interpretation of the BP, since all other variables related to adipose body mass were marked in the first BP (BP1)(Reference Daniels, Khoury and Morrison50).
Thus, the idea of prior adjustment of sexual maturation is influenced by disordered body mass gain during sexual maturation(Reference Buuren and Ooms57,Reference Takahashi, Figueiredo and Benedet58) . In addition, the main controversies between whether or not to consider sexual maturation in assessing the BMI category of adolescents may be in the form of interpretation of nutritional assessment indicators that consider body mass as a diagnosis(Reference Mul, Fredriks and van Buuren13,Reference Talma, Schönbeck and van Dommelen14,Reference Buuren and Ooms57) .
Another important finding of this study is the set of variables that marks adiposity in the BP1 is different from the set of variables that marks linear growth in the BP2. The replication of these results supports the studies that sustain the independence of adiposity and sexual maturation(Reference Adami, Benedet and Lopes6–Reference Cole and Lobstein8). In this sense, there are two ways of interpreting the effects of sexual maturation on the adolescent’s body: (1) chronological vector: when there is an expansion of body mass and body volume in adolescents, representing an increase in body fat and (2) biological vector: when there is an expansion of the mass without volume expansion, representing physical growth with increase in non-fat mass. These results suggest that the influence or effect of sexual maturation on the body composition of adolescents is not a problem when the BMI category is applied to diagnose the nutritional status(Reference Cumpian-Silva, Rinaldi and Mazzeti56,Reference Duarte59,Reference Serrano, Carvalho and Pereira60) .
Age, which represents the chronological vector positively associated with height, is marked in BP2, evidencing the association with physical growth acceleration in adolescence. The biological vector, represented by hormonal accelerations and phenomena characteristic of the sexual maturation process, was also associated with linear growth and to BP2. The differences found in the stages of sexual maturation are associated with a change in the chronological age, which suggests a marked rhythm for the evolution of sexual maturation regardless of the age of the onset process(Reference Cumpian-Silva, Rinaldi and Mazzeti56,Reference Duarte59) .
Another important point was the analyses applied to verify counterfactually the formation of the BP. In the PCA analyses without the sexual maturation variables, we identified that the BP maintained the same formation and characteristics as in the PCA analyses with the sexual maturation variables (Tables 1 and 2). Additionally, in the PCA analyses with the common variables for all the surveys, we observed the same formation of BP and the same characteristics in each survey and in the data pool (Table 3). These results indicate that the associations observed in the definition of BP were maintained even after changes in the base of the initial variables. In other words, there is a biological plausibility in the latent variables estimated, besides the statistical association with emphasis on the first two phenotypes (BP1 and BP2), which were the phenotypes with the least changes. These same observations can be extended to the PCA performed with all the surveys.
For this reason, the diagnosis based on body mass can express increases in body mass from different physiological processes, with different body composition(Reference Serrano, Carvalho and Pereira60,Reference Fukunaga, Takai and Yoshimoto61) . It is likely that the proposal of prior adjustment of BMI according to stages of sexual maturation for interpretation of BMI category is derived from this lack of categorisation of the physiological processes underlying the increase in body mass. In addition, it suggests that the biological processes of physical development at this stage of the life cycle can be described by anthropometric variables in multivariate analyses and not only by those traditionally used to assess sexual maturation(Reference Cumpian-Silva, Rinaldi and Mazzeti56–Reference Takahashi, Figueiredo and Benedet58).
The studies that are favourable for adjusting BMI for sexual maturation differ from the present study because they included BMI in the analysis and not their components, i.e. body mass and height separately(Reference Barbosa, Franceschini and Priore3,Reference Wang4) . In this study, height and body mass were considered as different variables and with the same degree of importance. This different way of analyses opens the possibility of marking the BP associated with sexual maturation based on anthropometric variables, without the need to specifically evaluate the stages of pubic hair and gonads or breasts. It can be certified when only BP1 has been associated with BMI.
The results suggest that the isolated BMI analysis is an indicative of some of the misconceptions observed in the assessment of the BMI category of adolescents during sexual maturation(Reference Cole, Bellizzi and Flegal1,Reference Wang and Moreno7) . The BMI category assessment considers specific cut-offs for nutritional diagnosis (body mass and height), and multivariate analysis allows us to interpret all variables together to assess it. The multivariate analysis of nutritional status makes it possible by describing the different BP. In addition, we could look with a more accurate spectrum for the true contribution of each variable in the BP generated and the distribution of the variables in each BP.
The main limitations of this study were: (1) self-reported information for sexual maturation data in the surveys conducted in Brazil, which may have resulted in the omission of correct information and doubts about the actual stage of the adolescents. However, self-reported information is indicated for population studies due to the cost, ease of application and overcoming social barriers, according to the WHO(Reference Chan, Sung and Kong62–Reference Martin, Uezu and Parra65); (2) Age range coverage, the sexual maturation questionnaire was applied only to adolescents aged between 10 and 15 years, and we could miss some adolescents who did not have finished their sexual maturation stages. Although, the main body changes due the sexual maturation occur in that age range(Reference Cole, Bellizzi and Flegal1,Reference Wang and Moreno7,Reference Cole and Lobstein8) ; and (3) variables available in the surveys. This difference may be the main explanation for the distinct number of BP generated. In an exploratory multivariate analysis (as in the case of PCA), the number of latent variables (BP) is conditioned to the variables available in each database. However, even if there were differences, the first two phenotypes were very similar and they are well representative of the different phenomena of physical and body growth that occur at puberty.
Conclusion
The replication of the previous study carried out in the city of Piracicaba (SP) strengthens the hypothesis of the absence of the need for prior adjustment of BMI by the stages of the sexual maturation. In addition, we have observed the existing pattern of BP in adolescence in different surveys regardless of social and epidemiological contexts.
The use of multivariate analysis to estimate BP in adolescents allowed us to describe and interpret, separately, the processes of increase in adipose mass or lean mass. This occurs due to the gain of body mass in this age group.
The multivariate analysis of the different physical/body dimensions in this stage of the life cycle allows us to unravel the non-random latent patterns eventually confounded by the difference in synchronicity of the stages of sexual maturation between the reference and the evaluated populations.
Our analysis suggests the simultaneous incorporation of other physical dimensions to those traditionally used in the diagnosis of obesity. The new dimensions, also with anthropometric variables, contribute to clarify the association between body mass and adiposity and, with this to reduce the confusion in the obesity diagnosis.
Based on the findings of this study, it is possible to propose a new solution to evaluate the BMI category of adolescents. We could do it using estimates of individual scores based on a reduced number of anthropometric variables to distinguish the biological process underlying the variability of body mass: growth or adiposity.
Acknowledgements
Acknowledgements: The authors would like to thank the Conselho Nacional de Desenvolvimento Científico e Tecnológico (CNPq) and the Coordenação de Aperfeiçoamento de Pessoal de Nível Superior – Brasil (CAPES) for the support of this study. Financial support: This study was financed in part by the Conselho Nacional de Desenvolvimento Científico e Tecnológico (CNPq) and by the Coordenação de Aperfeiçoamento de Pessoal de Nível Superior – Brasil (CAPES) – Finance Code 001. Conflict of interest: There are no conflicts of interest. Authorship: J.C.S. contributed to the study design and to the analysis and interpretation of the data. She is responsible for leading this research, ensuring the accuracy and integrity of the whole study. A.E.M.R. contributed to the review of statistical analysis, in the paper writing and in the content review and edition. F.d.A.G.V. contributed in paper writing and in the paper review. M.A.A.A. contributed in paper writing and in the paper review. C.M.M. contributed in paper writing and in the paper review. M.H.O. contributed in paper writing and in the paper review. W.L.C. contributed to the design of the study and the analysis and interpretation of the data. In addition, he approved the final version to be published. Ethics of human subject participation: This study was conducted according to the guidelines laid down in the Declaration of Helsinki and all procedures involving research study participants were approved by the Research Ethics Committee of the School of Public Health of the University of Sao Paulo. Written informed consent was obtained from all subjects.


