In 2016, an estimated one in eight households in the USA experienced food insecurity (i.e. they lacked access to enough food for an active, healthy life for all household members)(Reference Coleman-Jensen, Rabbitt and Gregory1). While federal food assistance programmes, such as the Supplemental Nutrition Assistance Program (SNAP), can increase food resources in some households, not everyone is eligible for these programmes or receives enough benefits to avoid food insecurity(Reference Mabli, Ohls and Dragoset2, Reference Weinfeld, Mills and Borger3). In 2014, nearly 44 million people relied on food pantries to obtain food for their household. Although often considered an emergency resource, food pantries and other hunger relief agencies have increasingly come to serve clients facing persistent food insecurity(Reference Weinfeld, Mills and Borger3). These agencies serve foods to low-income families with a disproportionate risk of insufficient diet(Reference Duffy, Zizza and Jacoby4, Reference Simmet, Depa and Tinnemann5) and diet-sensitive chronic disease(Reference Weinfeld, Mills and Borger3, Reference Seligman, Lyles and Marshall6), making food pantries a worthwhile setting to address equity issues around healthy food access(Reference Byker Shanks7, Reference Long, Rowland and Steelman8).
The hunger relief network faces challenges both in supplying healthy foods to clients and in making those foods appealing to clients(Reference Byker Shanks7, Reference Ross, Campbell and Webb9–Reference Rochester, Nanney and Story13). Pantry food sources include donations, foods purchased at reduced cost and items rescued from the food waste stream, which may not yield a consistent supply of healthy foods without intentional efforts on the part of pantry staff(Reference Byker Shanks7). The nutritional quality of foods available in food pantries is not routinely monitored, nor are there standards for what is offered, but research has indicated that there is considerable room for improvement(Reference Ross, Campbell and Webb9, Reference Hoisington, Manore and Raab14–Reference Simmet, Depa and Tinnemann18). An analysis of Minnesota pantries using the US Department of Agriculture’s Healthy Eating Index-2010 (HEI-2010), which aligns with the Dietary Guidelines for Americans, found that the dietary component scores for total fruit, dairy and whole grains of food pantry inventories were less than half of their optimal scores(Reference Nanney, Grannon and Cureton16, Reference Grannon, Hoolihan and Wang17). On the demand side, clients have reported that that they would like to see more healthy foods, like fruits, vegetables, dairy and meats at the food pantry(Reference Greer, Cross-Denny and McCabe19–Reference Campbell, Hudson and Webb21); at the same time, they may not take what is offered if it is not appealing. Concerns over food safety, lack of produce variety and the short shelf-life of healthy perishables have been cited by clients(Reference Byker Shanks7, Reference Verpy, Smith and Reicks20), which could be interpreted as low demand by food pantry staff, who report difficulty moving perishable foods through the system in a timely way(Reference Campbell, Ross and Webb11, Reference Rochester, Nanney and Story13). These challenges are interdependent: without an adequate and regular supply, clients cannot choose healthy foods, and without demonstrated client demand, pantries may not be motivated to solicit healthier donations or invest in infrastructure to support healthy food provisions.
The potential for hunger relief agencies to address health is just beginning to be explored(Reference Long, Rowland and Steelman8). Successful interventions in food pantries have led to improvements in clients’ diabetes management(Reference Seligman, Lyles and Marshall6), food insecurity(Reference Martin, Wu and Wolff22) and cooking skills(Reference Caspi, Friebur and Davey23), and healthier food ordering by staff(Reference Nanney, Grannon and Cureton16). Meanwhile, national hunger relief organizations have called for strategies to promote healthy food supply and selection in pantries(Reference Campbell, Webb and Ross12, 24–28). Many of these strategies use a behavioural economics approach to make the healthy choice the easiest choice(28, Reference Ashe, Graff and Spector29). Behavioural economics as a field considers that human decisions are susceptible to the way that choices are presented(Reference Roberto and Kawachi30); thus, behaviour change can be ‘nudged’ through careful ‘choice architecture’(Reference Thaler and Sunstein31).
Behavioural economics strategies have shown potential to influence food choices in many settings, including retail, restaurants and cafeterias(Reference Roberto and Kawachi30–Reference Thorndike, Bright and Dimond35). In theory, behavioural economics strategies are well suited to the hunger relief setting because many behavioural economics constructs (e.g. defaults, order, tradeoffs, cues and salience(Reference Roberto and Kawachi30, Reference Ammerman, Hartman and DeMarco36, Reference Richards and Sindelar37)) are relevant to the way that food pantries already operate. First, as charitable organizations, food pantries do not rely on paid advertisements or slotting fees from food companies promoting low-nutrient products, unlike in the retail setting(Reference Ayala, D’Angelo and Gittelsohn38). Pantries, therefore, have the autonomy to change their layout, item placement and signage without compromising their financial performance, provided they have the time and support to make changes. Second, choice-based pantries (estimated to be 72 % of pantries who order from food banks in the region(Reference Cureton, King and Warren39)) give clients some flexibility in what they take home, but still have default options and place limits on the types and quantities of foods clients can select. This feature of the food pantry is analogous to setting the ‘price’ of an item. Within the limits of its own food supply, food pantries have a unique opportunity to shape client food selection by carefully altering these defaults and food allowances, while maintaining choices for clients. Next, behavioural economics interventions may be a good option in a setting where people face many competing constraints on their time and resources; unlike education-focused interventions (e.g. cooking classes), implementing behavioural economics changes does not place any particular burden on clients as long as pantries continue their same basic operations. Finally, interventions in food pantries have the potential to reduce health disparities, as these efforts are specifically directed at improving nutrition among those with a high risk for diet-related disease.
In reality, pantries often have a limited capacity to make transformative changes given constraints of staff and volunteer time, reluctance to change and limited resources to make infrastructure improvements. Small-scale behavioural economics experiments in food pantries, in which specific foods have been promoted, do show promise in changing client selection of these foods(28, Reference Wilson, Just and Swigert40). The present study tests a larger-scale food pantry transformation effort, SuperShelf, rooted in behavioural economics. The aims of the current pilot study were to test whether implementing SuperShelf in two food pantries would result in: (i) an increase in the nutritional quality of foods available to clients; and (ii) an increase in the nutritional quality of foods selected by clients. The hypothesis was that the nutritional quality of foods available to clients and selected by clients would be higher after the intervention compared with before. An exploratory aim of the study was to develop a SuperShelf fidelity scoring tool for use in future evaluation studies.
Methods
Intervention
SuperShelf was developed over five years in a collaborative partnership among representatives from a food shelf, a food bank, an integrated health-care system, a university research team and the university’s extension services(41). SuperShelf uses a progression of steps to transform food shelves, creating welcoming environments for communities to access appealing, healthy foods. As a basis for achieving this, pantries must be client-centred in their approach, environment and culture; this is signified, for example, by having a choice-based food distribution model (rather than providing pre-packed bags), having non-discriminatory practices, and taking advantage of existing opportunities to provide healthy and culturally specific foods to clients (e.g. a local food bank’s Cultural Equity programme). In all participating pantries, the foods that clients receive are free.
The core components of the intervention are to: (i) establish consistent access to healthy foods and meet specific stocking standards; and (ii) increase the appeal of healthy foods using behavioural economics strategies. Succeeding in both these components is expected to create a feedback loop between healthy food availability and food selection by allowing healthy perishables and other items to move through the pantry quickly, encouraging pantries to sustain their new procurement efforts for healthy items.
The intervention was delivered by trained SuperShelf consultants, who were SNAP-Ed educators at the University of Minnesota-Extension. In the first phase, consultants worked with pantry staff, particularly those responsible for ordering food, to increase the quantity and variety of healthy foods available to clients (‘supply’ and ‘stretch’). Consultants examined the mix of existing food sources at the pantry, their purchasing priorities and their donation patterns. Where pantry staff had the most control (i.e. ordering from food banks), they suggested tradeoffs so that more was spent on healthy foods while staying within budget. In areas where pantry staff typically have less control, they helped to create messages for soliciting healthy donations. They also suggested additional sources of healthy foods when possible (e.g. retail rescue, community gardens and produce distributions). Sourcing fruits and vegetables in all forms, including canned, frozen and dried, was encouraged. A set of stocking standards (available at https://www.supershelfmn.org/resources) served as the benchmark for pantries for maintaining a consistent supply of healthy foods, recognizing that adequate supply is a prerequisite for clients to make healthy food choices(Reference Roberto and Kawachi30).
In the second phase, the intervention introduced behavioural economics to increase the prominence and appeal of healthy foods. In the first step (‘shift’), the SuperShelf consultant worked with the pantry to sort all foods into food groups and arrange them on the shelf in a specific order, with fruits/vegetables, dairy, protein, grains and cooking/condiments first, followed by mixed meals, snacks and desserts. It also addressed the ‘flow’ of clients, or how they would move through the food pantry. Next, consultants examined the food allowances set by the pantry. These allowances often use less healthy defaults and may be more prescriptive than necessary (e.g. each household is offered one pancake mix, one pancake syrup and one jelly per visit); allowances can therefore be altered to offer more choice and healthier choices. If, instead, pancake mix, syrup and jelly are grouped together with the full range of condiments, some of which are healthier (like mustard, spices and vegetable oil), then clients have an expanded set of options, even if they are still allowed the same number of options. This arrangement creates competition between healthy and less healthy items and eliminates the opportunity cost of rejecting a less-healthy default option. Along with these changes, in the final step (‘showcase’), the food pantry is rearranged so that healthy foods are displayed in a more appealing manner (e.g. in colourful bins and baskets instead of banana baskets), have more prominence (e.g. whole grains are placed at eye level) and are displayed attractively along with SuperShelf branded signage.
Evaluation and measures
The SuperShelf pilot evaluation study took place in four food pantries in the greater Minneapolis–St. Paul, MN metropolitan area, USA. All four sites were client-choice panties. Two pantries were intervention sites (A and B) and two were control sites (C and D). Sites A and C were overseen by the same director within the same umbrella organization, as were Sites B and D, which reasonably balanced the arms of the study in terms of organizational practices and culture. These sites were chosen because they volunteered to undergo a SuperShelf transformation and the structure of having two food shelves in each of the organizations lent itself to well-balanced control and intervention sites. The purpose of the control pantries was to monitor the local pantry environment and inventory patterns during the evaluation period. Control sites were particularly important for detecting potential seasonal changes that might affect inventory during the study period. Control measures were only collected at the pantry level in this pilot study.
Assessments were conducted before and after the intervention. At baseline (January–February 2017), seventy-one clients were enrolled at the two intervention pantries during their visit to the pantry. Recruitment took place after clients selected their foods to avoid influencing choice. After completing informed consent, clients took a survey while research staff conducted a cart inventory, recording the foods that clients had just selected. The intervention, led by trained University of Minnesota-Extension educators, took place between February and May 2017. A second sample of seventy clients was enrolled following the intervention (May–June 2017) for the same measures as baseline. It would not have been feasible or ethical to repeat follow-up measures with the same set of clients, as food shelf visits are likely to be irregular and urgent (i.e. visits cannot be scheduled around research needs). Moreover, the repeated cross-sectional method made it unlikely that clients would change their food choices due to participation in research.
During recruitment periods, which took place over 3 to 6 d at each pantry, all clients visiting the food pantry were approached by research staff at the end of their visit. The participation rate was 58 %. Clients were eligible to participate if they were at least 18 years old, were mentally capable of informed consent and spoke English. Non-English speakers were eligible if a client companion or pantry volunteer was available to translate all study-related materials (n 2). Participants received a $US 10 gift card for participating. The study was approved by the Institutional Review Board at the University of Minnesota.
Pantry-level assessments, conducted before and after the intervention, included a detailed ‘snapshot’ inventory of all foods on the shelf available to clients, a walkthrough assessment and extensive photo documentation of the food shelf space to assess fidelity (i.e. the degree to which the intervention was implemented as intended).
Fidelity measure
The aim of the fidelity measure was to understand implementation successes and challenges. Pantry walkthrough assessments were developed by our study team and conducted in which trained study staff were asked to assess features of the pantry environment. Study staff also took extensive photographs during the assessment. Photographs followed the path of clients as they moved through the pantry, documenting the overall physical space (e.g. shelf arrangement, presence of clutter) and specific elements of food displays (e.g. signage, close-ups of fresh produce). Because this was a pilot study meant to inform the next phase of work, creating the final fidelity scoring tool was an iterative process that was finalized after all data were collected. The original walkthrough assessment demonstrated low inter-rater reliability and high subjectivity in response options; the research team’s photographs were, therefore, used post hoc to measure more specific and objective elements of the physical space. For example, the original walkthrough assessment asked, ‘To what extent do you agree that fresh fruits and vegetables are displayed in an appealing manner?’ with response options ranging from ‘strongly agree’ to ‘strongly disagree’. In the final fidelity scoring tool, this question was: ‘Select the strategies that are being used to display fruits and vegetables in an appealing manner’, with 1 point each (up to 3) given if fruits and vegetables were: (i) sorted/organized; (ii) not bruised or mouldy; (iii) stocked abundantly; and (iv) in baskets or coloured bins.
Inventory data also contributed to the fidelity scoring. From inventory data, a score was generated for the degree to which a pantry met specific SuperShelf stocking standards (e.g. eight varieties of plain grains, four of which are whole grains). The final fidelity score (see online supplementary material) has a range of 0–100 based on the sum of four sub-components representing core SuperShelf intervention components: (i) aesthetics/use of space (34 points); (ii) unhealthy food placement and competition (20 points); (iii) healthy food prominence and appeal (20 points); and (iv) meeting stocking standards (26 points).
Client measures
Nutrient data were obtained by client cart inventories, which capture information on each product selected by the client at his/her visit. Staff took photographs of packaged foods to record the item name, brand, size and quantity, and later entered these data into a database. Staff weighed and entered non-packaged food (e.g. loose vegetables) in the database in real time. Data were entered into Nutrient Data Systems for Research (NDSR), a nutrient analysis software application. An HEI-2010 score for each cart was calculated. The HEI-2010 is a valid and reliable US Department of Agriculture measure used to monitor how well a set of foods aligns with the Dietary Guidelines for Americans(Reference Guenther, Reedy and Krebs-Smith42, Reference Guenther, Casavale and Reedy43). The HEI-2010 yields an overall score and twelve sub-components of diet, including whole fruit, total fruit, total vegetables, whole grains, greens and beans, dairy, total protein foods, seafood and plant proteins, and fatty acid ratio. Three additional sub-components (sodium, refined grains and empty calories) are reverse coded so that higher scores indicate better alignment with standards. Data collection, data entry and HEI-2010 scoring were based on protocols previously used by the principal investigator(Reference Caspi, Grannon and Wang44). The HEI-2010 is a good instrument for the food pantry setting, as clients usually obtain a balance of items that contribute to all (or most) of the sub-categories. Data from cart inventories were also used to calculate number of servings of fruits and vegetables and servings of whole grains clients selected at baseline and follow-up.
The client survey assessed demographics (age, gender, race/ethnicity, education, employment, household size), participation in federal food assistance programmes, a two-item food insecurity screener(Reference Hager, Quigg and Black45), frequency of pantry use, and the portion of total food and produce a client received at the pantry. Three follow-up survey items assessed perceptions of changes in the last 6 months of: (i) the quality of the foods offered; (ii) the selection of different kinds of foods; and (iii) the healthfulness of foods offered. Response options were ‘Yes, I have noticed positive changes’ or ‘No, I have not noticed any changes, or the changes have not been positive’. The survey also assessed client intention within the next 3 months to purchase or select any of twenty healthy, unprocessed types of foods. Foods included fresh fruits and vegetables, brown rice, oatmeal, whole wheat flour, black beans, lentils and spices.
Pantry measures
In the two intervention pantries and two control pantries, HEI-2010 scores of pantry inventories (items on the shelf available to clients) were calculated from inventories conducted at a single time point before and after the intervention. Before each inventory, researchers asked pantries to stock the shelf the way that they would at the start of typical day that the pantry was open. An HEI-2010 score was calculated for each pantry before and after the intervention.
Analysis
The statistical software package SAS version 9.4 was used for all analyses and P values <0.05 were considered statistically significant. For HEI-2010 scores, NDSR output files 04 and 09 were input into SAS code used to calculate HEI-2010 total and component scores, respectively, for food shelf inventory and client carts.
The client-level analysis assumed independence between the baseline and follow-up samples, as no more than three clients completed surveys at both time points. Client characteristics were analysed combining the data from both food pantries. Pre and post survey responses were summarized using descriptive statistics (means and standard deviations or counts and proportions). Sample demographics and characteristics were compared between the pre and post samples using χ 2 tests or two-sample t tests. Age group and education level were analysed as ordinal variables with two-sample t tests. The ‘prefer not to answer’ and ‘missing’ responses were not included in analyses.
For the primary outcome (change in client HEI-2010), pre/post changes in mean client total HEI-2010 score and each HEI-2010 sub-component score were analysed using multiple linear regression models controlling for client age, race, education and food insecurity. First, HEI-2010 scores were examined separately by food pantry, and together in a multiple linear regression model to test for effect modification by food pantry. There was a significant interaction between the intervention and food pantry, thus HEI-2010 analyses were stratified by food pantry. Similarly, the number of servings of fruits and vegetables and servings of whole grains that clients took were compared from baseline to follow-up using multiple linear regression models (each food pantry separately), additionally adjusting for household size. Results are reported as regression point estimates (β) and standard errors. At the food pantry level, change in HEI-2010 inventory scores and fruit and vegetable poundage were calculated to descriptively report changes in supply at the four sites.
Results
Pantry and client characteristics
Pantry characteristics were balanced across the intervention and control arms of the study. Pantries in both arms were open to clients for an average of 16 h/week. Intervention sites averaged 7 volunteers per day, while control sites averaged 8·5. Intervention sites reported serving an average of 23·5 clients per day compared with 16·3 clients in control pantries. The two arms were balanced in terms of food bank ordering frequency, and all four allowed clients to visit once per month.
Client survey demographics and characteristics are presented in Table 1. At baseline, clients were mostly female (66·7 %) and racially/ethnically diverse (42·7 % non-Hispanic Black, 33·8 % non-Hispanic White, 7·4 % Asian, 10·3 % Hispanic and 5·9 % Other). The average household size was 3·7 people. Most visited the food pantry once per month (77·9 %). More than half of participants (55·4 %) reported that about half or more of their total food in the last 6 months had been obtained at the food pantry. More than one-third (36·9 %) reported that half or more of their total produce in the last 6 months had been obtained at the food pantry. There were no statistically significant differences in client characteristics between the baseline and follow-up samples.
Table 1 Demographic characteristics of the food pantry clients; pilot study of the SuperShelf intervention implemented in four food pantries in the greater Minneapolis–St. Paul, MN metropolitan area, USA, 2017

GED, General Educational Development; SNAP, Supplemental Nutrition Assistance Program.
† (Pre-sample n, post-sample n).
Implementation and fidelity
Each of the intervention sites worked to improve healthy food sourcing over 2–3 months, followed by a transformation day in which the food pantry was closed and rearranged according to SuperShelf principles. The final showcasing step, displaying appealing signage, was not implemented until July 2017 due to an unexpected delay in the sign orders; therefore, follow-up assessments were collected without the final signage four months after baseline assessments for both Sites A and B.
Total fidelity scores and sub-scores are presented in Fig. 1. The post-intervention score for Site A was 82 out of 100, while the score for Site B was 51 of 100. Site A had the greatest room for improvement in the aesthetics/use of space sub-score (68 % of the maximum score). Site B scored less than 50 % of the maximum score in all sub-categories except meeting stocking standards. Site A was overall considerably more successful in undergoing the core SuperShelf transformation elements, including rearranging the food pantry into food groups, changing the aesthetics of food presentation, putting the healthiest foods at eye level and creating competition for less healthy items by reworking its client shopping lists. Post-implementation meetings at Site B between the food pantry leadership, the SuperShelf team and the research team revealed several specific challenges, including: (i) lack of universal support among key staff meant to champion the transformation; (ii) staff turnover during the intervention period; and (iii) competing organizational priorities, which led to a lack of systemic adoption of SuperShelf standards into practices.
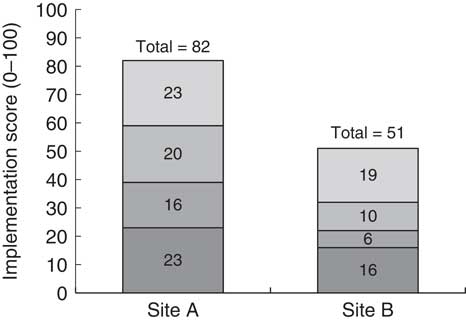
Fig. 1 Food pantry intervention implementation scores (0–100) and sub-scores (![]() , aesthetics/use of space (0–34);
, aesthetics/use of space (0–34); ![]() , healthy food prominence and appeal (0–20);
, healthy food prominence and appeal (0–20); ![]() , unhealthy food placement and competition (0–20);
, unhealthy food placement and competition (0–20); ![]() , meeting stocking standards (0–26)) in intervention sites; pilot study of the SuperShelf intervention implemented in four food pantries in the greater Minneapolis–St. Paul, MN metropolitan area, USA, 2017
, meeting stocking standards (0–26)) in intervention sites; pilot study of the SuperShelf intervention implemented in four food pantries in the greater Minneapolis–St. Paul, MN metropolitan area, USA, 2017
Client Healthy Eating Index-2010 scores
Table 2 presents change in HEI-2010 scores for clients at baseline and follow-up. Results for total HEI-2010 were similar in unadjusted models and models adjusting for age, race/ethnicity, education and food insecurity status; only adjusted models are shown in Table 2. At Site A, the mean total HEI-2010 score for the food selected by clients at baseline was 54·13, which increased to 65·90 following the intervention (P<0·0001 for difference). There were statistically significant increases in five of the twelve sub-components: total vegetables (P=0·002), whole grains (P=0·04), fatty acid ratio (P=0·0008), sodium (P=0·0008) and empty calories (P=0·005). At Site B, there was no statistically significant difference in the total HEI-2010 score for the foods selected by clients at baseline and follow-up (−0·86, P=0·72). Site B clients had a statistically significant increase only in the whole grain sub-component score (P=0·003).
Table 2 Intervention food pantries’ client-level total Healthy Eating Index-2010 (HEI-2010) and sub-component scores at baseline and follow-upFootnote †; pilot study of the SuperShelf intervention implemented in four food pantries in the greater Minneapolis–St. Paul, MN metropolitan area, USA, 2017

* P<0·05.
† Models adjusted for age, race, education and food insecurity.
‡ (Site A n, Site B n).
Other client outcomes
At baseline, clients received an average of 34·0 kg (75·1 lb) of food at their visit, and 30·6 kg (67·5 lb) of food at follow-up. Increases in the servings of fruits and vegetables and whole grains were observed at both sites, although they were borderline statistically significant or not statistically significant. In models adjusted for age, race, education, food insecurity status and household size, clients at Site A took on average 26·99 more servings of fruits and vegetables for their household at follow-up (P=0·05) and 18·4 more servings of whole grains (P=0·14). At Site B, clients took on average 13·79 more servings of fruits and vegetables at follow-up (P=0·42) and 11·54 more servings of whole grains (P=0·12). Clients did not report being more likely to select or purchase any of the twenty healthy food types in the next 3 months at follow-up. A follow-up assessment indicated that 88 % of clients noted positive changes in their overall satisfaction at the food shelf in the last 6 months.
Pantry Healthy Eating Index-2010 scores
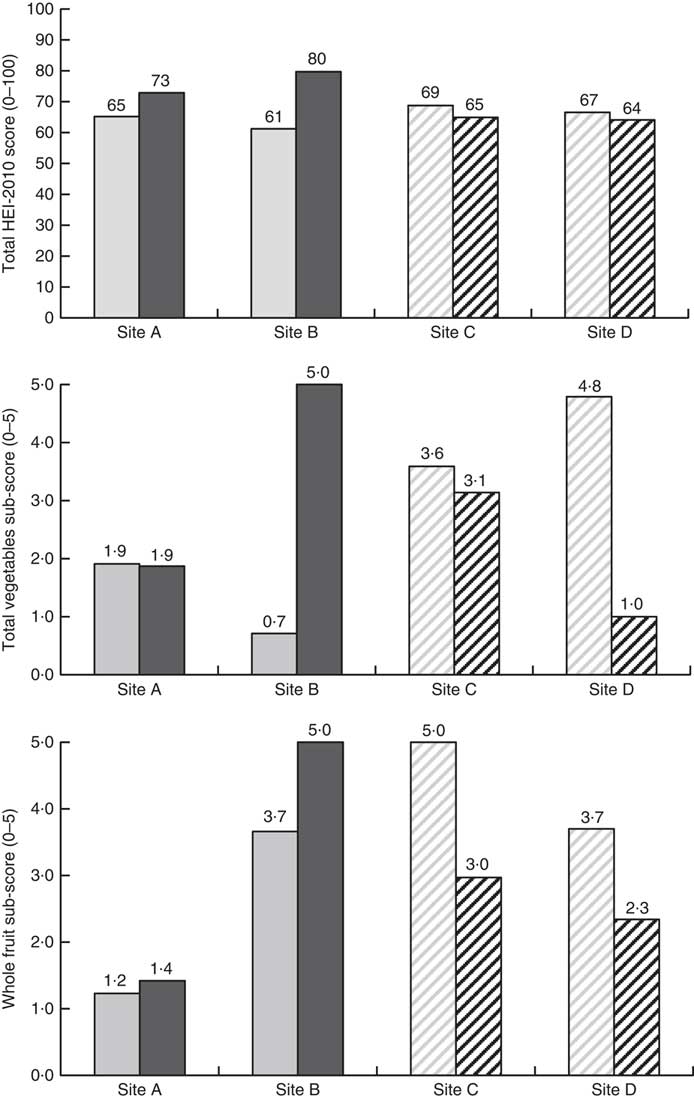
As presented in Fig. 2, total HEI-2010 scores increased in both intervention pantries (by 8 points in Site A and 19 points in Site B). Total HEI-2010 score decreased slightly in both control pantries (−4 points in Site C and −3 points in Site D). To further rule out seasonal effects, Fig. 2 also displays changes in total vegetables and whole fruit, the sub-components most likely to be affected by seasonal changes. These sub-component scores stayed the same or increased in both intervention pantries while they decreased in both control pantries.
Fig. 2 Food pantry inventory total Healthy Eating Index-2010 (HEI-2010) and seasonal HEI-2010 sub-component changes from baseline (![]() ,
,
![]() ) to follow-up (
) to follow-up (![]() ,
, ![]() ) in intervention sites (A and B;
) in intervention sites (A and B; ![]() ,
, ![]() ) and control sites (C and D;
) and control sites (C and D; ![]() ,
, ![]() ); pilot study of the SuperShelf intervention implemented in four food pantries in the greater Minneapolis–St. Paul, MN metropolitan area, USA, 2017
); pilot study of the SuperShelf intervention implemented in four food pantries in the greater Minneapolis–St. Paul, MN metropolitan area, USA, 2017
Discussion
Our results suggest that, when implemented well, the SuperShelf intervention has the potential to improve the nutritional quality of foods available to and selected by clients at a high risk for food insecurity. Following the intervention, both pantries had improved the nutritional quality of the foods available to clients, increasing their total HEI-2010 score by 8 points (Site A) and 19 points (Site B). In the two control sites, there was a slight decrease in total HEI-2010 score and a decrease in the seasonal HEI-2010 sub-component scores. Seasonal effects are, therefore, unlikely to account for the score increase observed in the intervention pantries. Implementation fidelity was higher at Site A than site B. Client behaviour change also differed by site. At Site A, where fidelity scores were higher, client HEI-2010 scores increased by nearly 12 points on average, whereas there was no change at Site B.
The magnitude of the change in client nutrition-related outcomes at Site A is notable. A nearly 12-point increase in the nutritional quality of foods selected by clients was highly statistically significant even with a small sample size. In another intervention study among food pantry clients in the same metropolitan area(Reference Caspi, Friebur and Davey23), total HEI-2010 score for overall diet increased by 7·6 points following a 6-week cooking and nutrition education class for clients. Compared with an educational approach, a behavioural economics approach requires substantially less client time and effort, but has been thought to produce small effects(Reference Guthrie46). If the effects of behavioural economics strategies are in fact meaningful, they could offer a less burdensome approach to behaviour change. While the current study did not measure overall client diet as the cooking class study did, another key finding of our study was that the majority of clients received about half or more of their total food from the food pantry. Considering that (i) a large effect of the intervention on foods selected was observed and (ii) the foods selected at pantries comprised a large portion of clients’ total diets, it is plausible that the SuperShelf intervention could improve the overall nutritional quality of food pantry clients’ diets. This hypothesis remains to be formally tested.
Understanding SuperShelf implementation is clearly essential to the next phases of this work. The SuperShelf intervention occurs in two phases, first addressing the availability of healthy foods (supply), then addressing the appeal of those foods (demand); results from the present study indicate that the first phase may be easier to implement than the second. The first phase is lengthy and gradual, involving mostly decision-making staff or volunteers who make food sourcing decisions. The second phase is more conspicuous for both food pantry staff and clients, involving a transformation of the physical space and the way that clients move through the pantry. With the support of SuperShelf consultants, both intervention sites were successful in implementing the first phase, as indicated by the high stocking standard scores (demonstrating adequate varieties of healthy foods) and increases in total HEI-2010 scores (demonstrating an overall improvement in nutritional quality). Site A was, however, more successful in implementing the core physical transformation elements, even without branded signage at the time of follow-up. While attractive signage contributes to the overall appeal of the food shelf, signage does not appear to be among the most essential components of the intervention. This is an important consideration for food pantries as they prioritize the costs of transforming their space.
In planning for the next phase of work, the SuperShelf team has built a set of practices to better identify pantry ‘readiness’ prior to initiating the transformation process. Identifying readiness will become increasingly critical as momentum for improving nutrition in food pantries grows rapidly in a diverse set of food pantries. To date, more than seventy pantries in Minnesota have applied to participate in SuperShelf transformations. Meanwhile, national organizations such as Feeding America are increasingly cultivating efforts to provide and nudge food-insecure families towards healthy foods(24, 28). Given the current heterogeneity in food pantries in developed countries(Reference Simmet, Depa and Tinnemann18, Reference Stroebele-Benschop, Simmet and Depa47), assuring a process for pantries to meet the prerequisites for interventions – beginning with adopting a choice-based model and then adopting other elements of client-centredness – will be essential for dissemination of models like SuperShelf. Tools currently exist to assist food pantries in these first steps(48) and the SuperShelf study team is currently developing more advanced tools to promote readiness (e.g. specific trainings on cultural equity).
With this growth of interest in food pantry transformations, rigorous and timely evaluation of effects on clients continues to be necessary. A group-randomized study evaluating the SuperShelf model is currently underway in sixteen food pantries. Applications to participate include written responses gauging organizational alignment with SuperShelf core values(41), ensuring organizational commitment with a letter from the Board of Directors and site pre-visits. This larger study will address imitations of the current study, including lack of site randomization, lack of client-level data for control sites, the small number of participants in the study and low/variable fidelity. Finally, the larger study will measure client total diet, comparing 24 h dietary recall data among a cohort of clients followed over 1 year. Approaches such as normalization process theory(Reference May and Finch49) and principles-focused evaluation(Reference Patton50) will be used to continue to assess implementation and its challenges.
Conclusion
In conclusion, SuperShelf resulted in a more nutritious set of foods available to clients in food pantries but increasing healthy food availability alone appeared to be insufficient for changing client food selection. Behavioural economics strategies that emphasize healthy foods and de-emphasize less healthy foods are well suited to be used in pantries ready to make a transformation. Properly implementing these strategies in the present small pilot study resulted in substantial improvements in the nutritional quality of foods that clients took home. Coupled with the fact that pantry clients receive a significant share of their total food from the pantry, this intervention has the potential to result in measurable improvements in diet among a group that carries a disproportionate burden of diet-related chronic disease. As interest in food pantry transformations grows, efforts continue to facilitate the implementation of Super-Shelf and rigorously evaluate its effect on client health outcomes.
Acknowledgements
Acknowledgements: The authors would like to acknowledge Liz Riley at Valley Outreach and Sarah Schmidt at The Food Group for their invaluable contribution to the conceptualization and development of this work, as well Nathan Hesse at the University of Minnesota-Extension for his critical role in carrying out food pantry transformations. They would also like to acknowledge Grace Borg and Kristi Fordyce for their efforts in collecting the data for this study. Financial support: This publication was made possible by funds from Duke University through the support of a grant from the US Department of Agriculture (USDA). The opinions expressed in this publication and those of the authors and do not necessarily reflect the views of Duke University or the USDA. Conflict of interest: The authors declare no conflict of interest. Authorship: C.E.C. conceptualized and obtained funding for the study from which these data originated, oversaw the completion of the research aims, drafted the manuscript and approved the final version of the manuscript. M.C. conceptualized the intervention, assisted in the development of the study design and instruments, contributed to writing/revision of the manuscript and approved the final version of the manuscript. S.C. conducted the data analysis, contributed to writing/revision of the manuscript and approved the final version of the manuscript. J.B. oversaw the intervention as it was carried out, assisted in interpreting the results, contributed to writing/revising the manuscript and approved the final version of the manuscript. L.B. supervised the training and implementation of the intervention, assisted in interpreting the results, contributed to writing/revising the manuscript and approved the final version of the manuscript. K.G. managed the study from which these data originated, oversaw the nutrient analysis, assisted in interpreting the results, contributed to writing/revising the manuscript and approved the final version of the manuscript. H.P. assisted with the research design and development of the study instruments, guided and provided feedback on the analysis, contributed to writing/revision of the manuscript and approved the final version of the manuscript. T.K. supported the conceptualization of the intervention, assisted with the research design and development of the study instruments, contributed to writing/revision of the manuscript and approved the final version of the manuscript. Ethics of human subject participation: This study was conducted according to the guidelines laid down in the Declaration of Helsinki and all procedures involving human subjects were approved by the Institutional Review Board of the University of Minnesota. Informed consent was obtained from all subjects. Consent was witnessed and formally recorded.
Supplementary material
To view supplementary material for this article, please visit https://doi.org/10.1017/S1368980019000405