


The prevalence of type 2 diabetes mellitus is increasing dramatically and represents a growing health problem in most parts of the world(Reference King, Aubert and Herman1–Reference Eastman, Cowie and Harris4). The underlying issue appears to be an inadequate eating behaviour in an environment of declining physical activity. Even in individuals with prediabetes, defined as blood glucose levels above the upper limit of normal but below the definition of diabetes, the risk for cardiovascular events and total mortality is nearly doubled(Reference Coutinho, Gerstein and Wang5–10). Some 5 to 10 % of these prediabetic patients develop diabetes each year(Reference de Vegt, Dekker and Jager11, 12). However, in routine medical practice, prediabetes is not yet recognized nor treated.
Besides a genetic predisposition, both an unhealthy dietary pattern and a sedentary lifestyle promote weight gain and increase visceral fat mass, leading to prediabetes and associated components of the metabolic syndrome. In various populations previous studies suggest that eating behaviour traits correlate with body weight(Reference Mumford, Siega-Riz and Herring13–Reference Bryant, King and Blundell15). Most studies suggest that high levels of restraint eating but also of disinhibition are positively associated with a higher BMI and weight gain over time. Divergent results may be attributable to the subsequent finding that dietary restraint is not a homogeneous construct. It encompasses two distinct behavioural subscales of eating behaviour: rigid control, characterized by an ‘all or nothing’ approach, and flexible control, which comprises a ‘more or less’ approach to weight and eating(Reference Westenhoefer16, Reference Westenhoefer, Stunkard and Pudel17). In studies validating these psychological constructs, rigid control was associated with a higher BMI and disordered eating patterns, whereas flexible control was associated with a lower BMI and a more pronounced weight loss(Reference Westenhoefer18–Reference Gallant, Tremblay and Pérusse22). However, information on the association between cognitive control and central obesity, prediabetes and dietary food patterns is currently limited.
This prompted us to analyse data of young employees in the Delay of Impaired Glucose Tolerance by a Healthy Lifestyle Trial (DELIGHT) to investigate the predictive value of eating behaviour traits with regard to anthropometric parameters, blood glucose levels and major dietary patterns by using the revised German version of the Three-Eating Factor Questionnaire(Reference Westenhoefer16, Reference Pudel and Westenhöfer23).
Methods
Design and recruitment
DELIGHT is a feasibility study on sustainable prevention of diabetes in young men and women. Between 2004 and 2005 employees of five medium-sized companies (health insurance, wharf, camper manufacturer, food industry, medical equipment supplier) in the northern part of Germany were informed about the impact of prediabetes and the chance of preventing diabetes and associated risk factors through lifestyle modification via flyers, intranet and on the occasion of work meetings. Employees aged 18–65 years were advised how to measure their waist circumference and were invited for a medical check-up if the self-measured waist circumference was close to or above the cut-off point of 94 cm for men or 80 cm for women.
Employees with as yet undiagnosed type 2 diabetes mellitus, or classified as prediabetic individuals by fasting plasma glucose ≥100 mg/dl or plasma glucose ≥140 mg/dl two hours after 75 g of glucose, were offered optional weekly group sessions based on the current evidence for diabetes prevention, including dietary advice and walking during the first year, particularly during the first three months(10, Reference Lindström, Louheranta and Mannelin24).
Goals of the initial treatment comprised a weight loss of at least 5 % by reducing energy intake, a reduction in the intakes of total fat (<30 % of energy) and saturated fat (<10 %) by a lower consumption of meat and meat products, an increase in fibre intake by a higher consumption of fruit and vegetables, and regular physical activity of at least 30 min on most days according to Lindström et al.(Reference Lindström, Louheranta and Mannelin24). Adherence to four out of these five goals has been shown to lower the risk to zero after 1 year(Reference Tuomilehto, Lindström and Eriksson25), even long term(Reference Lindström, Ilanne-Parikka and Peltonen26).
Standard behaviour therapy, adapted from Westenhoefer et al.(Reference Westenhoefer16, Reference Westenhoefer18), was part of the dietary counselling. Participants were motivated to develop flexible control, i.e. moderate eating control depending on the situation according to a ‘more or less’ approach. On the other hand, participants were encouraged to reduce rigid control by dieting according to strict rules, which is often followed by periods lacking any control reflecting an ‘all or nothing’ approach. Instead of totally avoiding fatty foods, sweets, snacks or sweetened beverages, participants were advised to consume unhealthy foods less often or in limited amounts (flexible control). The participants also were taught how to cope with situations that might induce disinhibition and how to prevent relapses. They learned how to identify and in a second step to overcome intrinsic or extrinsic stimuli for overeating such as boredom, stress or the presence of tasty food by trying to find alternatives. Relapse prevention included realistic goal setting, identification of potential causes with regard to weight regain and the ability to counter as early and efficiently as possible. After the initial phase participants were offered a follow-up for 2 years including booster sessions every three months.
Exclusion criteria were known pregnancy, known type 1 or 2 diabetes mellitus, and acute malignant or severe chronic disease. The final study population comprised 300 participants. However, the present analysis focuses on the data at screening of 127 men and 157 women (T0) and at a follow-up visit one year after the screening (T1) in twenty-three prediabetic men and twenty-one women who completed the Three-Factor Eating Questionnaire. The study protocol was approved by the ethical committee of Hamburg and conducted according to the principles of the Declaration of Helsinki. Written informed consent was obtained from all participants.
Data collection
Data on lifestyle, nutrition, sociodemographic characteristics and family history of diabetes were obtained using validated questionnaires developed for the EPIC (European Prospective Investigation into Cancer and Nutrition) study, a prospective multicentre cohort study in Europe, investigating the association between lifestyle factors and chronic diseases(Reference Bohlscheid, Hoting and Boeing27–Reference Boeing, Wahrendorf and Becker29). A self-administered food questionnaire recorded the frequency and portion size of 146 food items eaten during the preceding year.
Information about eating behaviour was obtained by using the revised German version of the Three-Eating Factor Questionnaire, based on fifty-six questions. The present analysis focuses on the evaluation of rigid and flexible control as relevant subscales for cognitive dietary restraint, and of disinhibition(Reference Westenhoefer16, Reference Pudel and Westenhöfer23). Dietary restraint describes the behavioural tendency to restrict food intake in order to lose weight or to maintain weight loss. Rigid control and flexible control are subscales of dietary restraint which are correlated although they describe contrasting features of dietary restraint (see introduction). Rigid control and flexible control, although contrasting, are not exclusive. Disinhibition describes the tendency to overeat in response to environmental or emotional stimuli. The questionnaire comprised twenty-one questions with regard to cognitive dietary restraint, sixteen as to rigid control, thirteen as to flexible control and sixteen as to disinhibition(Reference Westenhoefer16). For each question none or one point could be obtained. A low score encompasses that the trait is less pronounced compared with a high score.
Height and weight were measured to the nearest 0·5 cm or 0·1 kg, respectively, and BMI was calculated as weight (kg)/[height (m)]2. Waist circumference was measured midway between the lower rib margin and the iliac crest. Central obesity was defined by a waist circumference ≥80 cm in women and ≥94 cm in men. A fasting morning blood sample was taken and an oral glucose tolerance test (OGTT) was performed using a glucose load of 75 g. All blood samples were transported in NaF-containing Monovette tubes (Eppendorf, Hamburg, Germany) and blood values were determined by standard techniques in the central laboratory of the University Medical Center Hamburg. Prediabetes was defined as a fasting plasma glucose level between 100 and 125 mg/dl (impaired fasting glucose, IFG) and/or a plasma glucose level between 140 and 199 mg/dl two hours after ingesting 75 g glucose in the OGTT (impaired glucose tolerance, IGT)(10). Diabetes was defined as a fasting plasma glucose level ≥126 mg/dl and/or plasma glucose level ≥200 mg/dl two hours after ingesting 75 g glucose in the OGTT. Blood pressure was taken in a sitting position three times approximately 2 min apart, of which the second and third values were averaged(Reference Schulze, Kroke and Saracci30). For the definition of the metabolic syndrome, the criteria of the International Diabetes Federation were adopted (www.idf.org).
Statistical analyses
Baseline characteristics of the participants were analysed with the univariate χ 2 test or the Mann–Whitney test, as appropriate. To quantify correlations between eating behaviour traits, clinical data and dietary patterns, linear regression analysis was used. P values below 0·05 were considered statistically significant. Statistical calculations were performed running the XLSTAT software version 2009 (Addinsoft, Andernach, Germany).
Results
Baseline characteristics
Characteristics of the study population at baseline (T0) are given in Table 1. Due to the inclusion criterion of an elevated waist circumference, mean fasting glucose levels were elevated slightly in both genders. Compared with men, women were characterized by significantly lower systolic blood pressure, LDL-cholesterol and TAG levels and higher HDL-cholesterol levels. Compared with women, men reported a higher intake of energy particularly as meat and meat products and a lower consumption of fruit and vegetables. Women had significantly higher scores for both rigid control and flexible control than men, whereas scores for disinhibition did not differ between genders (Table 1).
Table 1 Baseline (T0) clinical characteristics, dietary patterns and eating behaviour among German employees aged 21–64 years, Delay of Impaired Glucose Tolerance by a Healthy Lifestyle Trial (DELIGHT), 2004–2008
Eating behaviour and clinical parameters
BMI and waist circumference clearly correlated with the extent of flexible control, rigid control and disinhibition at T0. In the total population and separately in both genders, a significant inverse correlation between flexible control and BMI was observed (regression coefficient, r = −0·27, P = 0·005 in total population; r = −0·28, P = 0·024 in men; r = −0·30, P = 0·002 in women). In contrast, rigid control (total: r = 0·34, P = 0·0001; men: r = 0·34, P = 0·001; women: r = 0·35, P = 0·018) and even more so disinhibition (total: r = 0·58, P < 0·0001; men: r = 0·46, P < 0·0001; women: r = 0·66, P < 0·0001) were positively correlated with BMI in the total population and in the subgroups.
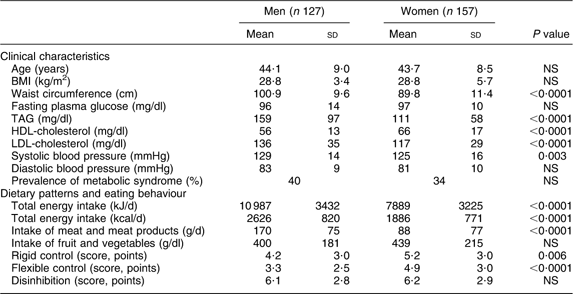
Waist circumference was even more strongly correlated than BMI with all eating behaviour traits at T0. In the total study population and separately in both genders, a strong inverse association between flexible control and waist circumference was revealed (total: r = −1·32, P < 0·0001; men: r = −0·89, P = 0·009; women: r = −0·91, P = 0·002; Fig. 1(a)). Rigid control and waist circumference were correlated positively in both genders, while the trend was weaker in the total population (total: r = 0·44, P = 0·063; men: r = 0·72, P = 0·011; women: r = 0·72, P = 0·017; Fig. 1(b)). Moreover, a strong positive and significant correlation was revealed between disinhibition and waist circumference in the total population and both subgroups (total: r = 1·19, P < 0·0001; men: r = 0·90, P = 0·002; women: r = 1·44, P < 0·0001; Fig. 1(c)).
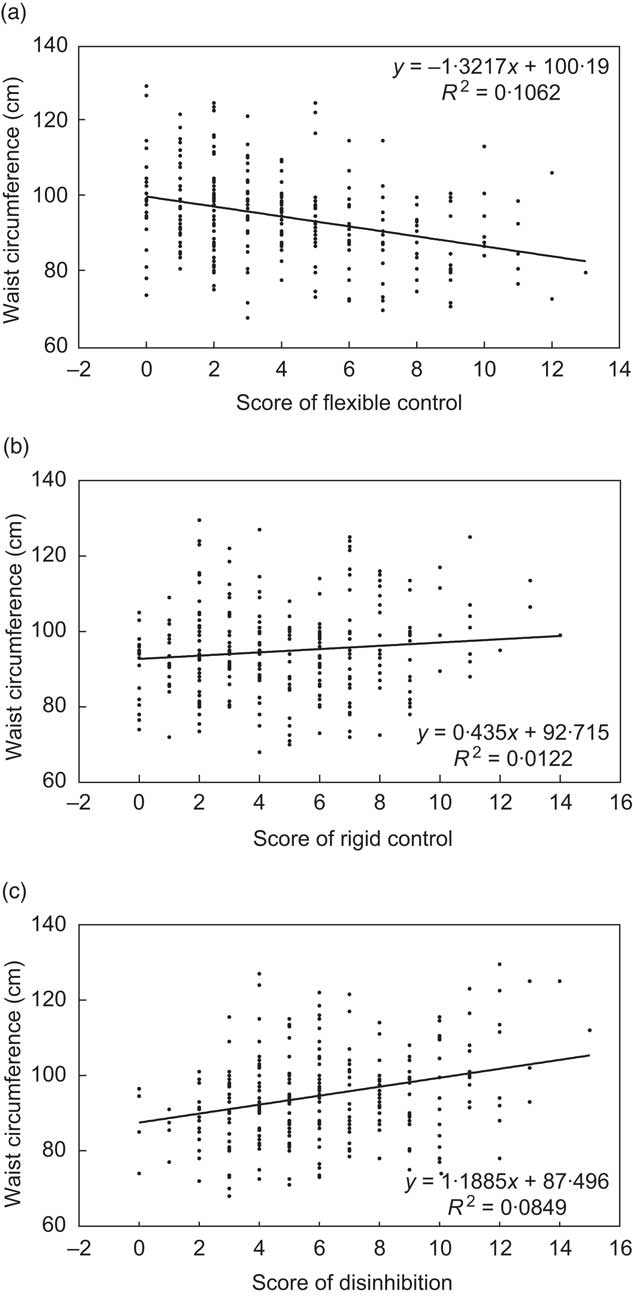
Fig. 1 Association of flexible control (a), rigid control (b) and disinhibition (c) with waist circumference in the total study population at baseline (T0): German employees aged 21–64 years, Delay of Impaired Glucose Tolerance by a Healthy Lifestyle Trial (DELIGHT), 2004–2008
With regard to laboratory values only flexible control was significantly and strongly inversely correlated with fasting plasma glucose (r = −0·49, P = 0·040; Fig. 2) and TAG levels (r = −4·73, P = 0·004) in the total study population at T0. In women, a significant positive association of rigid control and disinhibition with TAG levels was observed too (rigid control: r = 4·52, P = 0·003; disinhibition: r = 3·29, P = 0·033).
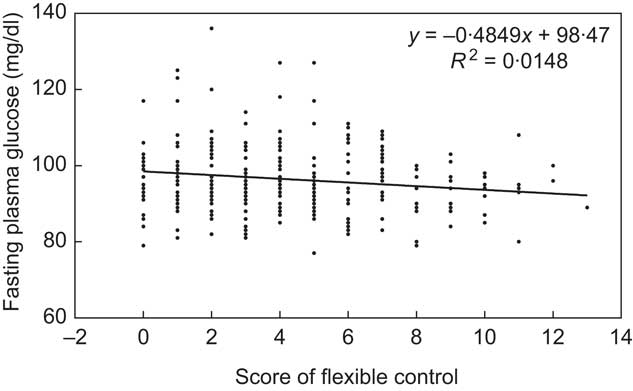
Fig. 2 Association of flexible control with fasting plasma glucose levels in the total study population at baseline (T0): German employees aged 21–64 years, Delay of Impaired Glucose Tolerance by a Healthy Lifestyle Trial (DELIGHT), 2004–2008
More men than women were affected by parameters of the metabolic syndrome at T0 (Table 1). The extent of flexible control differed between those participants with the metabolic syndrome compared with participants without this characteristic (mean score: 3·0 v. 4·0, P = 0·016). Thus, higher flexible control was associated with lower prevalence of the metabolic syndrome in the total study population. No association was found between rigid control or disinhibition and the metabolic syndrome.
Eating behaviour and dietary patterns
At T0 flexible control was inversely associated with energy intake (r = −237·5, P < 0·0001) and the intake of meat and meat products (r = −5·45, P = 0·0001) in the total population (Figs 3(a) and 3(b)). The same trends were observed if men and women were analysed separately, but failed to show significance. In contrast, a positive relationship was found between the extent of flexible control and the intake of fruit and vegetables in the total population (r = 17·9, P < 0·0001; Fig. 3(c)), also in men (r = 14·9, P = 0·023) and women (r = 18·6, P = 0·002). An inverse correlation was revealed between rigid control and energy intake (r = −220·0, P < 0·0001) and a positive association between rigid control and intake of fruit and vegetables (r = 10·7, P = 0·011) in the total population. A positive trend between disinhibition and the intake of meat and meat products was also observed in both genders, but was significant only in women (r = 3·06, P = 0·042).
Fig. 3 Association of flexible control with energy intake (a), intake of meat and meat products (b) and intake of fruit and vegetables (c) in the total study population at baseline (T0): German employees aged 21–64 years, Delay of Impaired Glucose Tolerance by a Healthy Lifestyle Trial (DELIGHT), 2004–2008
Impact of eating behaviour within 1 year
Of the 240 out of 300 employees with an elevated waist circumference screened at T0, 34 % (n 80) were characterized by prediabetes and a further 3 % (n 8) had as yet undiagnosed type 2 diabetes mellitus. Forty-four employees completed the Three-Factor Eating Questionnaire at T0 and T1. Differences in flexible control and rigid control between T1 and T0 were clearly inversely correlated with differences in BMI and waist circumference (Fig. 4(a)). For BMI, the correlation was much stronger for flexible control (r = −0·31, P < 0·0001) than for rigid control (r = −0·17, P = 0·039). However, in terms of waist circumference, correlations for both flexible control (r = −2·04, P < 0·0001) and rigid control (r = −1·36; P = 0·007) were even stronger. In line with these findings the difference in flexible control between T1 and T0 was also inversely related to the change in fasting plasma glucose from T0 to T1 (r = −1·67, P = 0·025; Fig. 4(b)).
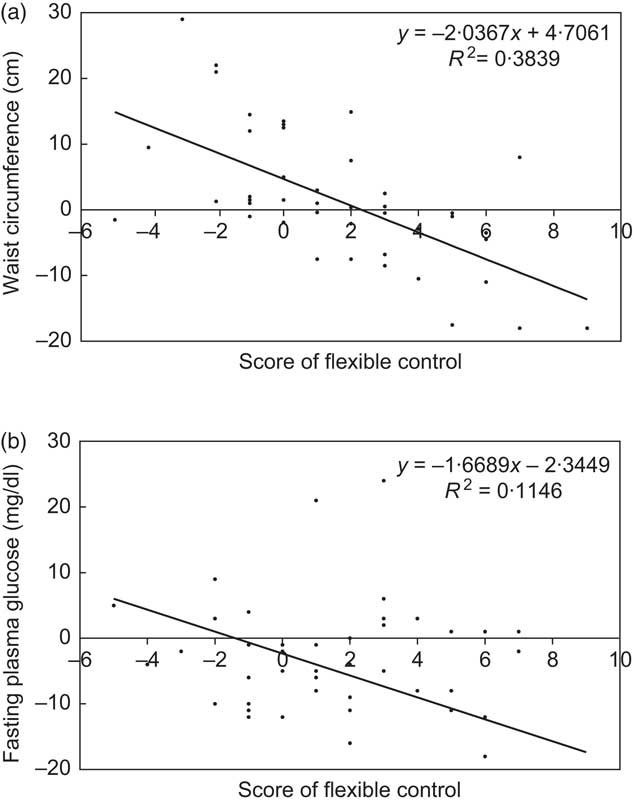
Fig. 4 Association of changes in flexible control (T1 v. T0) with changes in waist circumference (a) and changes in fasting plasma glucose levels (outlying data point 9/–89 not shown) (b) in the total study population: German employees aged 21–64 years, Delay of Impaired Glucose Tolerance by a Healthy Lifestyle Trial (DELIGHT), 2004–2008
Discussion
The present analysis of DELIGHT data showed a strong correlation between eating behaviour traits and anthropometric parameters. Furthermore, the extent of flexible control was inversely related to plasma glucose levels and major dietary patterns known to play a decisive role in the prevention of diabetes. Also, follow-up data clearly indicated that differences in eating traits between T1 and T0 correlated significantly with changes in anthropometric parameters and fasting plasma glucose levels.
Baseline characteristics at T0 demonstrated that mean fasting plasma glucose levels in both genders were close to 100 mg/dl, by definition the cut-off point for prediabetes. However, compared with women, men were characterized by more unhealthy food choices and an unfavourable cardiovascular risk profile including central obesity, systolic blood pressure and levels of LDL-cholesterol, HDL-cholesterol and TAG, in line with other investigations. Consistently, scores of flexible control, but also rigid control, were significantly higher in women compared with men. An impact of gender on the level of cognitive dietary restraint is supported by data from other investigations(Reference Provencher, Drapeau and Tremblay20, Reference Klem, Klesges and Bene31).
At T0 a positive and significant correlation between rigid control and disinhibition with BMI was documented, whereas the relationship of flexible control and BMI was inverse. These findings are in accordance with most, but not all investigators(Reference Westenhoefer, Stunkard and Pudel17, Reference Shearin, Russ and Hull19, Reference Provencher, Drapeau and Tremblay20, Reference Hainer, Kunesova and Bellisle32). In the Quebéc Family Study(Reference Provencher, Drapeau and Tremblay20) rigid and flexible control were oppositely associated with obesity status as in DELIGHT. Bellisle et al. demonstrated that disinhibition was the factor most strongly associated with BMI, particularly in individuals with a low level of dietary restraint(Reference Bellisle, Clément and Le Barzic33). Gallant et al. showed in adolescents that rigid control and disinhibition were independently related to BMI scores(Reference Gallant, Tremblay and Pérusse22). Hays et al. found that high scores of flexible control attenuated the relationship between disinhibition and weight gain, and that rigid control was not significantly associated(Reference Hays and Roberts34). However conflicting results with regard to body weight variations may be caused by ethnic differences, the degree of obesity, self-reported weight or, probably most importantly, focusing on cognitive dietary restraint without differentiating between subscales(Reference Provencher, Drapeau and Tremblay20, Reference Hays and Roberts34–Reference Ledoux, Watson and Baranowski37).
Similar to BMI, DELIGHT showed a clear positive correlation between rigid control and disinhibition with waist circumference, whereas flexible control was inversely related at T0. Only a few studies have evaluated the relationship between eating behaviour traits and central obesity. In the Québec Family Study positive correlations were observed between rigid control and most of the anthropometric variables. However only in women flexible control was inversely associated with waist circumference, and no relationship between disinhibition and central obesity was found(Reference Provencher, Drapeau and Tremblay20). In a sample of Czech adults dietary restraint was negatively and disinhibition positively related to waist circumference(Reference Hainer, Kunesova and Bellisle32).
Regarding anthropometric-dependent laboratory values, in DELIGHT flexible control was strongly inversely correlated with fasting plasma glucose and TAG levels in the total study population at T0. This certainly fits the data on waist circumference. Rigid control and disinhibition had no measurable influence, though. A clear relationship between dietary restraint, hyperlipidaemia and diabetes was documented only in a sample of Czech adults(Reference Hainer, Kunesova and Bellisle32). In restrained eaters Keim and Horn reported that fasting insulin concentrations were lower(Reference Keim and Horn38).
In the present analysis, at T0 eating behaviour traits were not only strongly related to anthropometric and laboratory values, but also to major dietary patterns known to influence the risk of type 2 diabetes mellitus, such as intake of meat and meat products and intake of fruit and vegetables as a protective factor. In terms of energy this is in line with data from Westenhoefer et al., which indicate that flexible control was associated with a lower self-reported intake of energy in a West German population(Reference Westenhoefer, Stunkard and Pudel17). In a sample of university students in Portugal high-restraint eaters reported a lower intake of energy and a higher intake of vegetables(Reference Moreira, de Almeida and Sampaio39).
Also, postmenopausal women with high restraint and low disinhibition had a lower consumption of red and processed meat and a higher intake of whole grains(Reference Goulet, Provencher and Piché40). In patients with newly diagnosed diabetes mellitus van Strien et al. demonstrated that increases in restrained eating were associated with decreases in fat and saturated fat intakes after 4 years(Reference Van Strien and Van de Laar41). In a randomized weight-loss programme Keränen et al. reported that cognitive restraint was associated with lower energy and fat intakes, whereas carbohydrates and fibre intakes were higher(Reference Keränen, Strengell and Savolainen42). In a review from Bryant et al. disinhibition was reported to be associated with a less healthy food choice(Reference Bryant, King and Blundell15). In contrast, the analysis of the Québec Family Study showed that dietary macronutrient content was not consistently related to eating behaviour traits in adolescents(Reference Gallant, Tremblay and Pérusse22). However, previous research did not include prediabetic patients and mostly focused on dietary restraint instead of evaluating subscales.
Certainly an interesting finding of DELIGHT is that changes of eating behaviour traits, particularly flexible control, within the first year of intervention (T1 v. T0) correlated with changes in anthropometric parameters and glucose levels. The beneficial trends may indicate the impact of the instructions on the change of dietary habits during the first year of intervention. Unfortunately the small sample size in the follow-up does not allow us to evaluate the effect of changes in flexible control and dietary intake. However, data of the screening indicate that higher flexible control is positively correlated with the intake of fruits and vegetables and inversely with the amount of meat and processed meat. These findings indicate that motivating patients to adopt flexible control will not only enhance weight control, but may also be an effective measure to prevent type 2 diabetes.
An increase in total restraint, flexible control or rigid control has been shown also by others to predict weight changes over time(Reference Riesco, Rossel and Rusques43–Reference Savage, Hoffman and Birch45). However, with regard to BMI, the role of flexible control seems to be prevailing as in DELIGHT(Reference Westenhoefer, Stunkard and Pudel17, Reference Westenhoefer18, Reference Teixeira, Silva and Coutinho46). Interestingly, in DELIGHT eating behaviour traits at T0, particularly flexible control, were much more closely related to waist circumference, a strong indicator of diabetes risk, than to BMI. This fits with the correlation of flexible control and fasting plasma glucose at T0 and is in line with the observation of an inverse correlation of changes in flexible control and fasting plasma glucose levels between T0 and T1.
Study limitations
DELIGHT has limitations that need to be addressed. First, our findings are confined to those employees who voluntarily chose to take part in the programme. Second, the intervention was offered to all participants, since within the companies randomization into a control group was considered appropriate. Third, the analysis of follow-up data within the first year is based on a small sample and therefore associations between differences in disinhibition and changes in anthropometry or laboratory data may have been missed.
Conclusions
DELIGHT demonstrates that particularly central obesity, blood glucose levels and major dietary patterns correlate strongly with the extent of flexible control. Also, changes in flexible control within the first year of intervention predicted changes in BMI, waist circumference and fasting plasma glucose. Thus, the results of DELIGHT suggest that the evaluation of dietary behaviour traits is useful to identify individuals at risk for diabetes and therefore may be introduced into the routine assessment of dietary habits. Furthermore, emphasis on strategies to adopt flexible control may improve long-term success in a diabetes prevention programme. Certainly, only randomized controlled trials can confirm these findings and establish cause and effect.
Acknowledgements
Financial support of DELIGHT was primarily given by the health assurance ‘AOK NordWest – Die Gesundheitskasse’. All authors have appropriately disclosed conflicts of interest according to journal policy and no competing financial interests exist. B.-C.Z. designed the study and wrote the paper; C.W. collected and analysed the data; A.S. performed analysis of the data; A.H.K. performed analysis of the data; J.W. participated in the design and provided methodical help; E.W. designed and performed the study. All authors read and approved the final manuscript. The authors are indebted to all participants of the study for their collaboration.


