


Obesity in Malaysian adults has escalated to alarming levels. Overweight and obesity prevalence was reported as 30·0 and 17·7 %, respectively, in 2014, indicating that one in two adults is either overweight or obese(1). Alarmed by the odds for the obesity pandemic continuing unabated and its consequent burden on the health-care system, the Ministry of Health has accorded priority to comprehensive national strategies to tackle drivers of excessive weight. The National Plan of Action for Nutrition for Malaysia III (NPANM III) 2016–2025 specifically identifies ‘preventing and controlling obesity’ as an enabling strategy to achieve its ultimate goal of achieving optimal nutritional well-being of Malaysians. Additionally, obesity prevention and management have been identified as Nutrition Research Priorities in Malaysia for the 11th Malaysia Plan (2016–2021)(2, 3).
Globally, the obesity pandemic is driven by multiple factors that include subsidised agriculture, availability of affordable processed foods that are energy-dense with refined fats, oils and carbohydrates, and increase in sedentary lifestyles(4). Scientific evidence has irrevocably established unhealthy diets as a major determinant of obesity. The epidemiological transition occurring in developing countries is characterised by qualitative dietary shifts, namely a trend for increased consumption of energy from animal foods, refined cereals (including white rice), added sugars and vegetable oils(5).
Traditionally, nutritional epidemiology has relied on studying the associations between intake of single nutrients such as carbohydrate or fat, or single foods such as sugar or rice, and health outcomes of interest. However, this simplistic approach has several limitations. The synergistic and interactive nature of nutrients and/or foods, the presence of high levels of inter-correlation between nutrients and the confounding effect of dietary patterns (DP) on single nutrient associations make the interpretation of health associations with a single nutrient or food increasingly complex(Reference Hu6). In turn, translating these findings into appropriate dietary recommendations for the population also becomes challenging. In comparison, the investigation of DP provides a holistic approach to studying population diets as it looks at the spectrum of foods included and excluded, mimicking real-life diets. This approach makes it amenable to understand the nutrient and food profile of the DP and their associations with health outcomes of interest in existing data sets(Reference Atkins, Whincup and Morris7).
Two national dietary intake surveys, namely the Malaysian Adult Nutrition Survey (MANS) undertaken in 2003 and 2014, had included, inter alia, frequency of food intake as well as the BMI of the participants. Hence, the MANS data provide an opportunity to determine the DP of Malaysian adults and the association between changes in DP and BMI status over the survey years. The present study aimed to identify the predominant DP among Malaysian adults and their associations with sociodemographic factors based on MANS 2003 and 2014. In addition, it intended to investigate the association between the identified DP and overweight risks in 2003 and 2014.
Methods
Study population and sampling procedure
The MANS 2003 and 2014 used a multistage stratified sampling design to select a representative sample of Malaysian adult population aged 18 to 60 years. Both surveys covered urban and rural areas throughout the country. Nutritionists and trained research assistants were recruited for data collection. The surveys were undertaken by the Institute of Public Health (Institut Kesihatan Umum), Ministry of Health, Malaysia. Complete details on the methodology are available on the Institute’s website (http://www.iku.gov.my). The MANS 2003 comprised data of 6928 individuals while the MANS 2014 included 3000 individuals. The data sets provided information on body weight, age, sex, ethnicity, state of residence, category of residence (urban or rural) and household monthly income.
Anthropometric measurements
Body weight and height measurements were taken of the survey respondents in 2003 (n 6766) and 2014 (n 2889) using standard procedures. BMI was calculated using the formula: BMI = [weight (kg)]/[height (m)]2. The BMI results in kg/m2 were classified according to WHO (2000) as follows: underweight, BMI < 18·5 kg/m2; normal weight, BMI = 18·0–24·99 kg/m2; overweight, BMI ≥ 25·0 kg/m2. Further details are available in the methodology documents available from the Institute of Public Health(8).
Dietary assessment
A pre-tested semi-quantitative FFQ was used in both surveys. Details on the MANS FFQ have been published earlier(8–Reference Kasim, Ahmad and Bin10). In brief, the MANS 2003 FFQ consisted of 126 commonly consumed food and beverage items which were listed into thirteen food groups. The MANS 2014 FFQ contained additional food and beverage items in each food group accounting for a total of 165 items(Reference Kasim, Ahmad and Bin10). The FFQ in MANS was administered by trained enumerators on a one-to-one basis and respondents were asked to report the frequency of intake of each food item (‘per day’, ‘per week’, ‘per month’, ‘per year’ or ‘never’) based on their habitual intake over the past year. Information on the number of servings consumed each time that the respondents ate the food was also elicited. Visual representation of food portions was used to improve accuracy of reporting.
Data analyses
DP were generated from the MANS FFQ using principal component analysis (PCA) with varimax rotation. The Kaiser–Mayer–Olkin test for sampling adequacy and Bartlett’s test were applied to evaluate PCA applicability. For performing the PCA, the large numbers of variables from the MANS FFQ were aggregated into twenty-eight mutually exclusive groups on the basis of the similarity of food types and nutrient composition. These measures are suggested in the literature to facilitate data analysis and interpretation(Reference Schulze, Hoffmann and Kroke11).
Based on past studies, we made certain assumptions in the categorisation of food groups. Sugar-sweetened beverages and sweetened condensed milk (creamer) are often implicated as constituents of unhealthy diets(12). Likewise, there has been widespread concern about the popularity of Western fast foods, owing to increased globalisation(Reference Habib, Abu Dardak and Zakaria13, Reference Hawkes14). Hence, in the current analysis, we identified specific categories for carbonated beverages, sugar and honey, creamer and fast foods. We also separated the cereal products into categories such as rice, noodles, local bread, corn, sagu and ready-to-eat cereals, since it is important to understand the contributions of these commonly consumed staples to the DP. The twenty-eight food categories identified are shown in Table 1. The analysis was based on the amounts consumed in grams per day.
Table 1 Food categories identified from the Malaysian Adult Nutrition Survey FFQ for performing principal component analysis
Dietary patterns that emerged were identified and labelled based on the foods included and excluded for each factor. The number of DP extracted was determined based on information from the scree plot, component eigenvalues (>1·2) and their contributions to the total variation(Reference Schulze, Hoffmann and Kroke11, Reference Moreira, Corrente and Villas Boas15). The number of factors extracted was based on each factor contributing a minimum of 5 % to the total variance. Small component coefficients (factor loading scores) of less than 0·2 were suppressed. Factor scores were estimated using the regression approach. The regression factor score for each DP was calculated and assigned to every participant. Changes in the DP between 2003 and 2014 were assessed by comparing the food factor loading scores for the individual DP between the two years. The statistical software package IBM SPSS Statistics version 24 was used to perform the PCA and all statistical analyses. P < 0·05 was considered statistically significant. The scores of individual intakes obtained from the DP were categorised into quartiles as a measure of adherence, with quartile 1 denoting the lowest adherence and quartile 4 representing the highest adherence to a specific DP.
Associations between the quartiles of DP adherence and socio-economic factors (age, sex, ethnicity and household income) and body weight status based on presence or absence of overweight and obesity (i.e. BMI ≥ 25·0 kg/m2), as a dichotomous variable, were determined using the χ 2 test for distribution of proportions.
Household income (as shown in the online supplementary material, Supplemental Table S5) was classified in three categories based on reports accrued from the Department of Statistics Malaysia (https://www.dosm.gov.my). Based on the Household Expenditure Surveys, undertaken by the Department of Statistics Malaysia every 5 years, it was gathered that the average monthly household expenditure on food and non-alcoholic beverages was 20·2 % in 2004–2005 and 18·9 % in 2014 out of total household expenditures(16). During this period annual inflation was also reported as below 5 %. Based on these data, which appear to indicate that the impact of household income on food expenditures was not vastly different in 2003 and 2014, we made no further adjustments to the MANS data when analysing household income quartiles v. dietary patterns.
Logistic regression models were fitted by considering presence or absence of overweight and obesity as the outcome and the quartile of adherence to DP as a predictor. Since significant interactions between age, sex and ethnicity were detected during the preliminary analysis (shown in the supplementary files), a second model was developed for the derivation of OR when adjusted for age, sex and ethnicity. A sensitivity analysis was performed to study this association while excluding respondents who were underweight.
Results
Major dietary patterns
Four distinct a posteriori dietary patterns that satisfied the set criteria were extracted in both years. Together they described approximately 25·6 and 26·6 % of the DP variations in 2003 and 2014, respectively. Three of the DP were common to both years: ‘Traditional’ (high in fish, eggs, local cakes (kuih), confectionery, tea and coffee, sugar and honey); ‘Mixed’ (high in ready-to-eat cereals, bread, spread, legumes, vegetables, fruits, malted beverages, soya milk, corn, local cakes and confectionery); and ‘Western’ (high in fast foods and carbonated beverages). In addition, a ‘Flatbread & Beverages’ DP (high in local bread, creamer, malted chocolate drinks, carbonated beverages, soya milk) was generated for 2003 and ‘Noodles & Meat’ DP (high in noodles, meat, eggs, alcoholic beverages) in 2014. Table 2 shows these DP and the predominant food items included. The rotated component matrix shows the grouping of the foods consumed into four DP for 2003 and 2014, respectively, based on the factor scores (see online supplementary material, Supplemental Table S1). The clustering of the food items within the DP is further shown as loading plots derived from PCA (Fig. 1). The percentage of total variation in the diet for each of these DP ranged from 5·7 to 7·6 % (Supplemental Fig. S1).
Table 2 Description of the dietary patterns (DP) identified from the Malaysian Adult Nutrition Survey 2003 and 2014
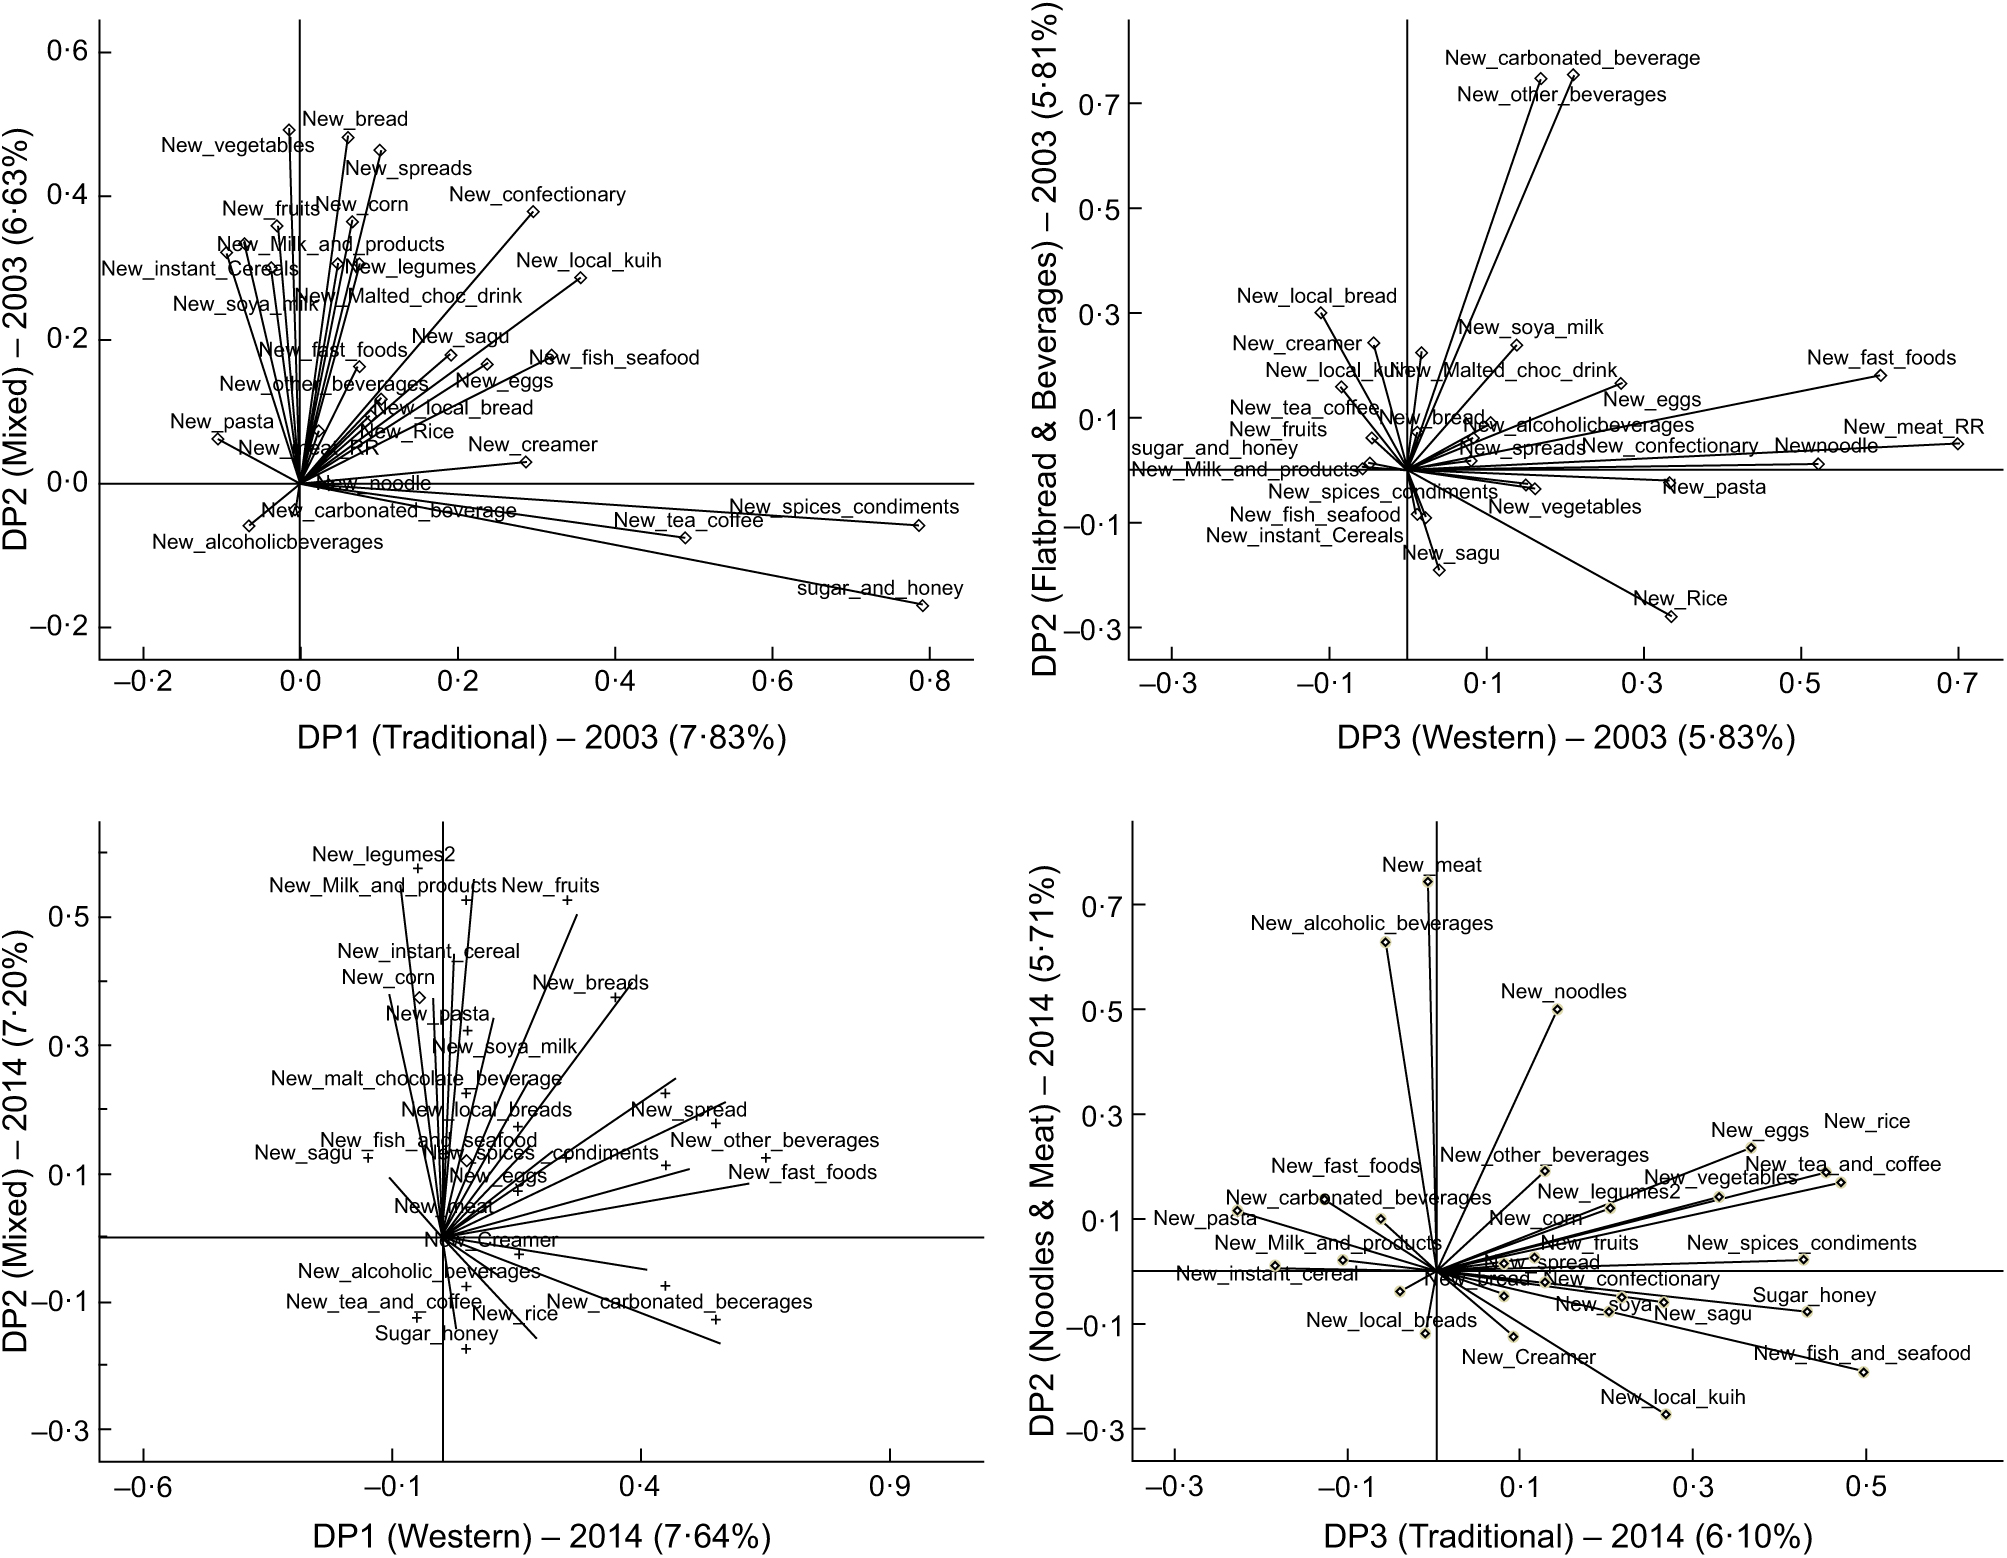
Fig. 1 Rotated component loading plots showing the clustering of food groups for the four dietary patterns (DP) derived by principal component analysis from the Malaysian Adult Nutrition Survey (MANS) 2003 and 2014 FFQ. The left column shows the loading plots with DP1 on the x-axis and DP2 on the y-axis; the right column shows the loading plots with DP3 on the x-axis and DP4 on the y-axis. The top row visualises the data from MANS 2003 and the bottom row the data from MANS 2014
Association between sociodemographic factors and dietary patterns
A summary of the test for association between the sociodemographic factors of the respondents and the DP is shown in Table 3, while the detailed results are presented in the online supplementary material (Supplemental Tables S2 to S6). The Western DP was a preference among younger respondents both in 2003 and 2014 (both P trend < 0·001). While the Mixed DP (P trend = 0·015) was associated with younger respondents in 2003, no significant association with age was shown in 2014. The Traditional DP (2003 and 2014) and the Noodles & Meat DP of 2014 were not found to be associated with respondent age.
Table 3 Significant associations between adherence to dietary patterns (DP) and sociodemographic factors in the Malaysian Adult Nutrition Survey (MANS) 2003 and 2014
† Sarawak indigenous groups include Melanaus, Ibans and Bidayuhs.
‡ Monthly household income (Malaysian Ringgit (RM)): lower, <RM 1500 (~<£280); middle, RM 1500–3500 (~£280–653); higher, >RM 3500 (~>£653).
§ Sabah indigenous groups include Kadazans-Dusuns, Bajaus and Muruts.
Men showed significant associations with several DP in the two MANS, namely Traditional DP (2003 and 2014), Flatbread & Beverages DP (2003), Noodles & Meat DP (2014) and Western DP (2014; all P < 0·001). In contrast, only the Mixed DP was significantly associated with women (P < 0·001 in both years).
As for household income, the Traditional DP was more prevalent with lower income, whereas the Western and Mixed DP were associated with higher household income (P trend < 0·001 in both years). The Noodles & Meat DP of 2014 also showed a positive association with higher household income (P trend = 0·017), while the Flatbread & Beverages DP in 2003 was significantly associated with the middle income category (P trend = 0·002).
Rural households were more likely to adhere to the Traditional DP in both years (P < 0·001), compared with the Mixed and Western DP that scored higher in urban areas. The Flatbread & Beverages DP in 2003 and the Noodles & Meat DP in 2014 were also more prevalent in urban areas (P < 0·001).
The MANS data also revealed significant associations between adherence to the DP and respondent ethnicity. In 2003, the Flatbread & Beverages DP showed higher prevalence among Indians, whereas in both years the Traditional DP was associated with Malays and the indigenous population groups in Sarawak (P trend < 0·001). In 2014, the Mixed DP was associated with Chinese and Indian ethnicity (P trend < 0·001), whereas the Noodles & Meat DP scores were higher among Chinese and Sarawak indigenous groups (P trend = 0·017).
Association between dietary patterns and overweight risk
Results on the association between overweight risk and sociodemographic factors observed in the MANS 2003 and 2014 data are presented in Table 4. The test for the association between quartiles of DP and proportion of participants with BMI ≥ 25·0 kg/m2 is presented in the online supplementary material, Supplemental Table S7 and Supplemental Fig. S2.
Table 4 Association of sociodemographic variables with prevalence of overweight† in the Malaysian Adult Nutrition Survey (MANS) 2003 and 2014
† Overweight is defined as BMI ≥ 25·0 kg/m2.
‡ Categorisation of sociodemographic variables studied. Age group: 18–19, 20–29, 30–39, 40–49, 50–59 years. Sex: male and female. Ethnicity: Malay, Chinese, Indian, Sarawak indigenous, Sabah indigenous, Other indigenous. Monthly household income (Malaysian Ringgit (RM)): lower, <RM 1500 (~<£280); middle, RM 1500–3500 (~£280–653); higher, >RM 3500 (~>£653). Residence: rural and urban.
Results of unadjusted and adjusted OR for prevalence of overweight among the quartiles of DP adherence are shown in Table 5. Unadjusted OR, comparing the lower quartiles of DP adherence with the highest quartile as the reference, showed that lower adherence to the Western DP was associated with higher odds for overweight and obesity both in 2003 and 2014. However, the association was no longer significant after adjusting the model for age, sex and ethnicity. Overall, no significant association was found between prevalence of overweight and dietary patterns in 2003 and 2014, when adjusted for age, sex and ethnicity, with the exception of the finding for Traditional DP. These findings were consistent also when respondents with underweight were excluded during the secondary analysis (see online supplementary material, Supplemental Table S8).
Table 5 Dietary patterns (DP) and the presence of overweight and obesity (BMI ≥ 25·0 kg/m2) among Malaysian Adult Nutrition Survey respondents in 2003 and 2014
*P < 0·05; **P < 0·01, ***P < 0·001.
† DP quartile refers to the quartile of adherence. Q1 and Q4 are the lowest and highest quartiles of adherence, respectively.
‡ OR and 95 % CI are calculated with the highest quartile as the reference.
Discussion
Major dietary patterns and changes
Typical of a rapidly developing economy, Malaysia has undergone substantial expansion and diversification in food consumption, as indicated by the major DP identified and the concomitant shifts observed over the study period. While Traditional, Mixed and Western DP were distinctly identified in both the MANS 2003 and 2014, nevertheless, major shifts in the popularity of these DP were discerned over the years. Whereas Traditional DP ranked highest in explaining 7·4 % of the dietary variations in 2003, by 2014 however the Western DP had taken over the top position, contributing 7·6 % of the dietary variations (Supplemental Fig. S1). These observations parallel reports of rapid proliferation of the fast-food industry in recent decades in Malaysia(Reference Hawkes14). Working status, especially among dual-career families, is associated with increased consumption of convenience and ready-to-eat fast foods as quick meal solutions(Reference van der Horst, Brunner and Siegrist17–Reference Ali19). High demand for convenience foods and beverages is one of the major food demand drivers in Asia, leading to continued emergence of processed foods(Reference Ali19).
In this conjunction, Malaysia displays the consequences of a rapid convergence of global dietary influence on the local food consumption landscape. Whereas rice and noodles were key constituents of the Western DP in 2003, by 2014 both items were no longer components of the Western DP. The latter appears entrenched mainly with Western constituents, namely fast foods, spreads and carbonated beverages. Meanwhile, noodles made from different types of cereals and grains are an increasingly popular alternative to rice among the different ethnic groups. The escalating popularity of noodles reflects, in part, increasing international influence (spaghetti, ramen and soba noodles) and in part the perception in some segments of the population that ‘noodle is healthier than rice’. Rice, nevertheless, persists as a predominant staple as a component of the 2014 Traditional DP.
Implications of socio-economic factors
The associations between sociodemographic factors and the major DP appear to be consistent in MANS 2003 and 2014. In general, the Western and Mixed DP were preferred by younger age groups, urban residents and those with higher household income. Affordability explains the finding in both years of the lower-income and rural areas adhering to the Traditional DP that comprises local food items such as rice, fish and spices.
The gender differentials revealed in the present study suggest that men tend to favour a variety of DP compared with women. While women were significantly associated with the Mixed DP, men were positively linked to several DP in both years of the survey. The Mixed DP that includes bread, ready-to-eat cereals, vegetables and fruits is similar to the ‘healthy diet’ pattern described in Singapore(Reference Whitton, Rebello and Lee20). It is postulated that women’s penchant for healthier lifestyle and increased health awareness(Reference Wardle, Haase and Steptoe21) are likely to lead to their adoption of healthier diets. The Mixed DP would also require limited food preparation time and could explain its adoption among women who constitute about 38–54 % of the workforce in Malaysia(22, Reference Takahashi, Hori and Ishigamori23).
The Noodles & Meat DP showed greater association with men, higher income and urban dwellers, as well as Chinese and Sarawak indigenous ethnicity. It is not unexpected to observe alcoholic beverages in this DP, as among the ethnic groups studied only the Malays are known to be prohibited by religion from consumption of alcoholic beverages.
The Flatbread & Beverages DP typified by Southern Indian breads, such as roti canai (made from refined wheat flour) and thosai (made from fermented lentils and rice batter), is usually taken with beverages, including teh tarik (tea sweetened with creamer) and malted chocolate drinks. This cuisine is ubiquitous to the Malaysian Mamak food scene, popular for its affordability and long hours of availability(Reference Boon24). Perhaps for these factors this DP was reported above as significantly associated with male, middle-income and urban respondents (Table 3). Nevertheless, the Flatbread & Beverages DP did not emerge in 2014, perhaps owing to competition and increasing popularity of multi-ethnic and so-called ‘fusion cuisines’ (blended Western and Asian ingredients in a single dish). In Malaysia, international influence and diversification of local cuisines are expected to be in demand in tandem with growing affluence of Malaysians and growing influx of foreign tourists.
Nutritional implications
There are concerns over the widespread acculturation of Western fast foods in the Malaysian diet(Reference Habib, Abu Dardak and Zakaria13, Reference Hawkes14). Consumption of sugar-sweetened (carbonated) beverages and sweetened condensed milk/creamer is also a concern given the escalating prevalence of obesity and diabetes in the population(12). Hence in the current analysis, while grouping foods for PCA, we created specific categories for sugar and honey, creamer and fast foods. The analysis of the contributions of key dietary items to the major DP revealed notable nutritional implications. For example, there appears a lower contribution of sugar and sweet foods in 2014 compared with 2003, as exemplified by the Traditional DP which was the DP characterised by the intake of sugary foods. For this DP, factor loading scores for several sweet items, including table sugar, honey, local cakes and confectionery, decreased from 2003 to 2014 (see online supplementary material, Supplemental Table S1). The factor loading score for sweetened milk (creamer) also showed a decrease for the Traditional DP over the same period (Supplemental Table S1). Since factor loadings are interpreted like standardised regression coefficients, a higher loading value would indicate a stronger correlation with the factor it is associated with. A decreased factor loading can be construed to indicate a lower degree correlation, thereby contributing less to a particular DP. Thus, lower factor loading scores for these elements can indicate decreased contribution of sugary products and sweetened milk to this DP, over time. This encouraging trend is consistent with the 2016 review of Amarra et al., who reported that the per capita daily consumption of energy from sugar and sweeteners in Malaysia dropped dramatically between 2000 and 2004, after experiencing an increase from 1965 to 1999(Reference Amarra, Khor and Chan25).
Another nutritional implication shown by the current study is that food consumption patterns among Malaysians expanded and diversified in 2014, including adding meat (Noodle & Meat DP), increased contribution of fruits and vegetables (Western, Mixed & Traditional DP), as well as higher loading scores for milk and dairy products (Mixed DP), in contrast to the DP in 2003. These dietary improvements within the DP may reflect increased availability of household economic means to access various food groups coupled with greater awareness about nutrition.
Dietary patterns and overweight risk
The prevalence of overweight and obesity (BMI ≥ 25·0 kg/m2) as reported by the MANS data was 38·3 % in 2003 and 50·9 % in 2014(1). In the present study, primary analysis found no significant association between DP and adjusted risk for overweight. The prevalence of underweight (BMI < 18·5 kg/m2) among the respondents was 9·3 and 5·6 % in 2003 and 2014, respectively. Nevertheless, a sensitivity analysis was carried out to assess any masking of the association by excluding those with BMI < 18·5 kg/m2. This secondary analysis is presented in the online supplementary material. Supplemental Table S8. The direction of these associations remained consistent in both analyses. Only the practice of Traditional DP in 2003 revealed lower odds for overweight, after adjustment for age, sex, ethnicity and household income.
This lack of association between adherence to a DP and overweight risk agrees with a previous attempt at associating obesity with frequency of eating out in Malaysia, which found no significant association(22). These findings are also in line with the earlier investigation that explored DP in the MANS 2003 data using PCA, which found that DP were not significantly associated with obesity(Reference Ali19). These observations differ from the evidence reported in other Asian populations(Reference Kim, Jo and Joung26–Reference Okubo, Sasaki and Murakami28). As a commonality, the latter studies found that high fat, meat and sweets intakes were positively associated with body weight. These studies also found an inverse relationship between BMI and fruits, vegetables, fish and whole grains intakes. Interestingly, rice intake (in the Japanese Traditional diet(Reference Okubo, Sasaki and Murakami28)) and potato intake (in the Korean transitional diet(Reference Kim, Jo and Joung26)) were associated with obesity. In Singapore, high intakes of fruit, vegetables, dairy, wholegrain breads, breakfast cereals, and use of unsaturated cooking oils, coupled with low intakes of Western fast foods, sugar-sweetened beverages, poultry, processed meat and flavoured rice, were found to be associated with better cardiovascular risk profiles and body weight status among adults(Reference Whitton, Rebello and Lee20). These contradictory findings could be due to the cross-sectional nature of the MANS data that precludes assumptions of causality and the likely under-reporting among overweight and obese respondents, which is a well-established source of error in nutritional surveys(Reference Mirnalini, Zalilah and Safiah29).
Conclusion and recommendations
Analysis of the MANS 2003 and 2014 data generated three consistent major dietary patterns, namely Traditional, Mixed and Western. In general, overweight among Malaysian adults was not found to be significantly associated with adherence to any of these DP. This finding may be due to the constantly morphing dietary landscape in Malaysia, especially in urban areas, given the ease of availability and relative affordability of multi-ethnic and international foods.
National surveys of dietary intake of all ages should be undertaken in a timely manner to address the public health implications of the constantly changing dietary consumption behaviour of the people, concomitant with the country undergoing rapid nutrition transition. Such findings are particularly pertinent in view of the growing obesity and non-communicable disease burden on the health of the people and health-care costs of the country. In light of the findings that sociodemographic characteristics play an important influence in the people’s dietary preferences, there is scope for targeting educational and health promotion messages towards improving nutritional well-being of Malaysians.
Acknowledgements
Acknowledgements: The authors wish to acknowledge the guidance of Professor Joon Wah Mak, Dr Poh Sin Yap and Dr Sue Yee Tan from the International Medical University (IMU), Kuala Lumpur, Malaysia. They would also like to thank the Director General of Health Malaysia for his permission to publish this paper. Financial support: This work was supported by an internal research grant from IMU (project ID: 348-2016). IMU funders had no role in the design, analysis or writing of this article. Conflict of interest: None. Authorship: G.-L.K., S.A., S.S., R.A. and T.A. conceptualised the study. S.S. and W.-L.C. contributed to the technical analyses. S.S., G.-L.K. and W.-L.C. interpreted the data. S.S. and G.-L.K. drafted the manuscript and S.A. contributed to the editing. All authors reviewed the final manuscript. Ethics of human subject participation: This manuscript involves secondary analysis of the Malaysian Adult Nutritional Surveys conducted by the Malaysian Public Health Institute in 2003 and 2014. The research protocol for this project was approved by the Joint Committee on Research and Ethics of the International Medical University (IMU-JC). Approval for access to the database was obtained from the Medical Research and Ethics Committee, Ministry of Health, Malaysia. The study was registered under the National Medical Research Register (NMRR-16-460-29768).
Supplementary material
To view supplementary material for this article, please visit https://doi.org/10.1017/S1368980019001861


