Obesity is a major public health concern( Reference Lim, Vos and Flaxman 1 ) and a risk factor in the development of non-communicable chronic diseases( 2 ). Curbing or reversing the rising obesity trend is a public policy priority worldwide. This trend has been fuelled partly by inappropriate dietary patterns triggered by environmental factors, such as food-associated external cues. Vision plays an important role in the detection and evaluation of food cues in extra-personal space( Reference Spence, Okajima and Cheok 3 ). Given their relevance to survival, food cues, such as visual cues, activate the brain areas underlying attentional processing, appetitive behaviour and the reward centre, and elicit sensory–visceromotor responses linked with food-seeking engagement and consumption( Reference Rothemund, Preuschhof and Bohner 4 – Reference Wang, Volkow and Telang 7 ). A growing body of evidence shows that visual food cues influence food choices, consumers’ intention to eat and taste perception( Reference Michel, Velasco and Gatti 8 – Reference Boswell and Kober 12 ). For instance, exposure to food cues through advertising on television triggers automatic consumption predispositions, indicating that visual food cues are used strategically by advertisers( Reference Harris, Bargh and Brownell 13 – Reference Boyland and Halford 15 ).
Stimuli-driven consumer predispositions following sensory food-cue exposure are closely related to emotion( Reference Braesicke, Parkinson and Reekie 16 – Reference Gutjar, de Graaf and Kooijman 19 ). Studies grounded in affective neuroscience have shown that pictures of food are emotion-laden, evoking differential subjective, physiological and behavioural responses relative to non-food stimuli( Reference Miccoli, Delgado and Guerra 20 – Reference Drobes, Miller and Hillman 22 ). Based on subjective affective ratings, a standard method has been used to directly assess emotional responses to pictures( Reference Bradley and Lang 23 ). This method assumes that the diversity of emotions can be determined by two main factors, valence (unpleasant v. pleasant) and arousal (the intensity of activation). This experimental approach is based on the International Affective Picture System (IAPS)( Reference Lang, Bradley and Cuthbert 24 ), a catalogue with hundreds of pictures designed to evoke a broad range of human emotional experience, and the Self-Assessment Manikin (SAM)( Reference Bradley and Lang 23 ), a normative instrument used to evaluate the valence and emotional arousal associated with each picture. The following two essential properties of the standardization method apply to the IAPS: (i) the emotional responses evoked by each picture are determined based on the average ratings of a group of participants; and (ii) the rating sessions must include pictures eliciting emotions ranging from an extremely negative to an extremely positive valence and from low to high levels of arousal. These properties will provide valid measures of evocativeness per picture that can be extrapolated to other individuals and groups, thereby facilitating between-group comparisons( Reference Miccoli, Delgado and Guerra 20 , Reference Paes, De Oliveira and Pereira 25 ). The valence and arousal ratings obtained with this method correlate with physiological responses to emotional visual cues and are, to an extent, considered an index of motivational tendencies that drive appetitive (‘approach-like’) or defensive (‘avoidance-like’) responses to stimuli( Reference Bradley, Codispoti and Sabatinelli 26 , Reference Greenwald, Cook and Lang 27 ). This standard method has been applied to investigate appetitive (approach) motivational tendencies elicited by home-cooked food pictures, revealing greater emotional responses to pictures depicting foods with high amounts of sugar and fat( Reference Miccoli, Delgado and Guerra 20 , Reference Miccoli, Delgado and Rodriguez-Ruiz 28 ).
Recently, the Pan American Health Organization recognized that Latin America is immersed in an obesogenic environment and that market deregulation policies have contributed to this situation( 29 ). Along with lower prices and effective distribution channels, packaging and promotion-related marketing activities are also major factors. The sensory attractive cues of industrialized, ultra-processed food products are combined with aggressive advertising to induce a greater appetitive drive and overconsumption. It is therefore unsurprising that aggressive marketing campaigns for ultra-processed food and drink products are commonly identified as major contributors to unhealthy food intake and global epidemics of non-communicable diseases( Reference Chandon and Wansink 30 , Reference Moodie, Stuckler and Monteiro 31 ).
The development of ultra-processed, ready-to-eat or ready-to-heat food and drink products involves several processing techniques. The products comprise several ingredients (typically more than five), including substances, such as additives and food industry ingredients, not used in culinary preparations( Reference Monteiro, Levy and Claro 32 ). These ultra-processed products are high in sugar, sodium, saturated and/or trans-fats, are hyper-palatable and have high energy densities( Reference Monteiro, Levy and Claro 33 ). Studies show that the consumption of these products is increasing in high- and middle-income countries and is linked to health problems, such as obesity, non-communicable diseases and dental caries, among others( Reference Martins, Levy and Claro 34 – Reference Steele, Baraldi and Louzada 37 ).
Consumers’ ability to absorb and use nutrition information is limited and varies widely based on numeracy and literacy skills. For instance, in a study on consumers’ understanding of food labels, the authors found that only 32 % could compute the number of carbohydrates in a 20-ounce bottle of soda based on the nutrition label information. Additionally, education was positively associated with nutrition label comprehension( Reference Rothman, Housam and Weiss 38 ). In other words, whereas appetitive cues are successfully generated through salient and emotionally laden cues on products, packages and advertisements, information about nutritional content or hazards fails to persuasively communicate the risks associated with consuming ultra-processed products. The hidden, abstract and difficult-to-comprehend nutrition table on the back of packages exemplifies this failure in communication.
The growing concern about the harms associated with ultra-processed products and the lack of use or the misuse of nutrition information has intensified discussions in several countries about the labelling and warning statement requirements for packages and advertisements linked to these products. One proposal involves displaying a nutrition labelling system on the front rather than the back of food product packaging. Front-of-pack nutrition label schemes are designed to provide simplified nutritional content through colour coding (e.g. traffic-light nutrition labels), the presentation of nutrient-specific content in the context of an individual’s overall diet such as Guideline Daily Amounts, or the use of a single indicator of nutritional quality based on specific nutritional criteria (e.g. health logos)( Reference Hersey, Wohlgenant and Arsenault 39 – 41 ). Various front-of-pack formats are being considered or are currently in use worldwide( 41 ).
Regarding text warning proposals, in the USA, San Francisco passed a law requiring advertising for sugar-sweetened beverages that displays text warnings to inform consumers about the presence of added sugar and its negative health effects, thus promoting informed consumer choice( 42 ). California’s Proposition 65 also requires businesses to provide text warnings related to products that contain non-secure levels of chemicals listed as carcinogens, as is the case with some food and beverage additives( 43 ). In Chile, products that exceed sugar, energy, fat and salt limits must carry a warning label of that fact, such as the text ‘High in sugar’( Reference Ramirez, Sternsdorff and Pastor 44 ). In Brazil, the National Agency for Sanitary Surveillance proposed a norm whereby media advertising of unhealthy food products and beverages (high in sugar, sodium, saturated and/or trans-fats) would be followed by text warnings specifying risks related to the consumption of those products( 45 ). This norm, however, focused only on media advertising and did not consider product packaging.
Because the development of public health policies must be based on scientific evidence, the first aim of the present research was to assess the appetitive drive evoked by the visual cues of ultra-processed food products. An important concern with ultra-processed products is that they are designed to prompt extremely strong emotional reactions, elicit food cravings and be habit-forming( 29 ). Scientific evidence of ultra-processed products as emotionally evocative would support obesity-related policies by reinforcing beliefs about ultra-processed products as addictive( Reference Moran, Musicus and Soo 46 ). In Study I, we addressed this issue by using the standardization method applied to the IAPS to measure, through affective normative ratings, the appetitive drive evoked by pictures of ultra-processed foods( Reference Lang, Bradley and Cuthbert 24 ).
The standardization method used in the present study also enabled us to select ultra-processed product pictures with the greatest affective reactions to subsequently test in Study II. In Study II, an experiment was conducted to assess the influence of textual warnings on the appetitive drive and consumption intentions associated with the ultra-processed products selected from Study I. Therefore, the second aim of the research was to test whether text warnings can counteract the powerful influence of highly appetitive ultra-processed product cues. In sum, we aimed to inform public health regulatory efforts with scientific evidence of the efficacy of text health warnings when paired with attractive visual cues of ultra-processed products.
Study I: Emotional normative ratings of ultra-processed product pictures
Methods
Participants
Two hundred and fifteen university student participants (135 women; mean age 21·3 (sd 3·4) years) were recruited. The participants were naïve to the purpose of the study. The Research Ethics Committee of Fluminense Federal University (Brazil) approved the experiments and all participants provided informed consent before any experimental procedure was conducted.
Evaluative report: hedonic valence and arousal
To establish the appetitive drive evoked by ultra-processed product pictures, we applied the SAM( Reference Bradley and Lang 23 ), a picture-oriented instrument used to assess valence and arousal following exposure to emotional-laden pictures. Ratings were obtained for each picture with visual analogue scales ranging from 1 to 9. The scale for the hedonic valence dimension was composed of five pictorial drawings of manikins interleaved by blank spaces, with the expressions of the manikins ranging from ‘smiling/happy’ (score=9) to ‘frowning/unhappy’ (score=1). For the arousal dimension, the expressions of the manikins ranged from an ‘excited wide-eyed’ figure (score=9) to a ‘relaxed-sleepy’ figure (score=1). Lang et al. developed the SAM scale to create a set of standard pictures (the IAPS) calibrated for affective responses( Reference Lang, Bradley and Cuthbert 24 ). The methodology used in the IAPS generates standard picture sets that evoke similar emotional responses across individuals and groups.
Stimuli
Ultra-processed products
The ultra-processed product pictures included sixty-four pictures of highly industrialized products, mostly selected from the Internet, that are easily found on the Brazilian market.
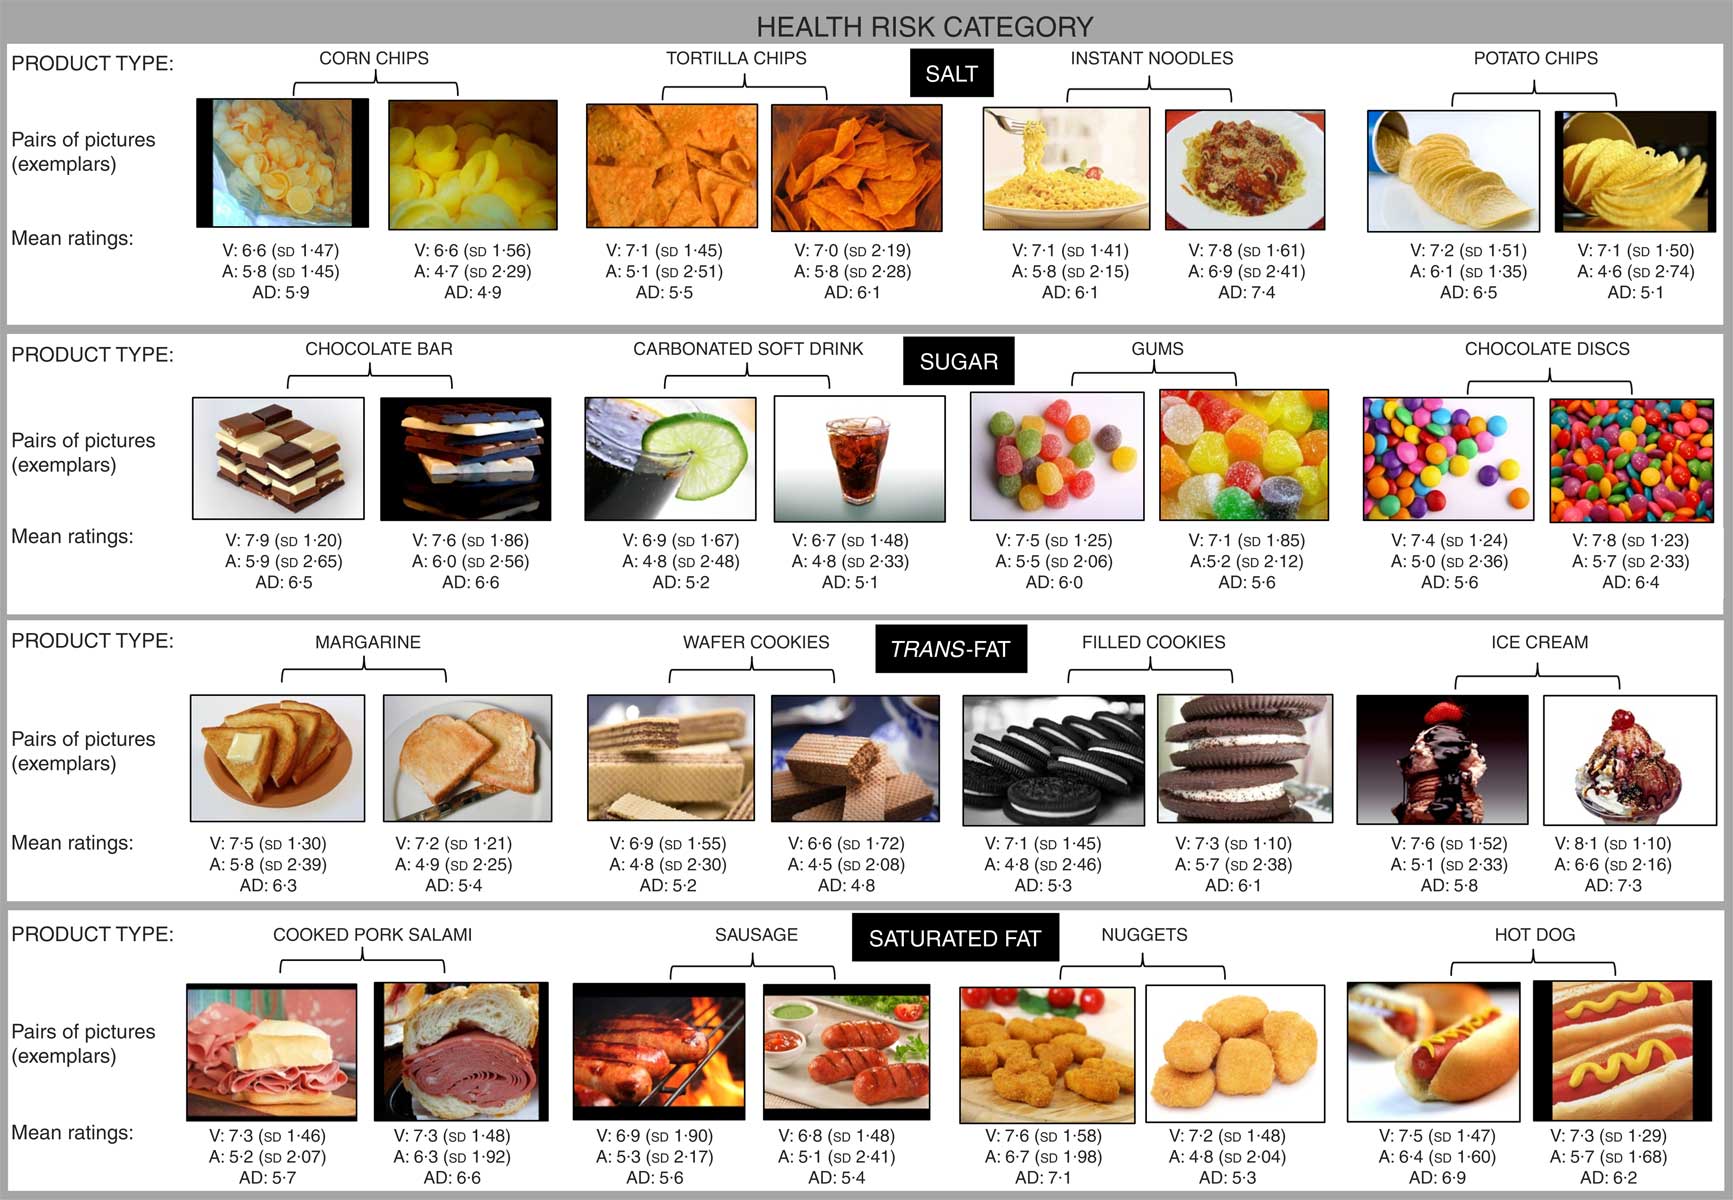
Pictures were preselected so that an equal number of pictures represented the four following health risk categories: excessive salt, sugar, trans-fat and saturated fat. Each health risk category was represented by four different product types with four exemplars of a given product. ‘Sugar’ product types included carbonated soft drinks, chocolate bars, chocolate discs and gums; ‘salt’ product types included corn chips, potato chips, tortilla chips and instant noodles; ‘saturated fat’ product types included sausages, cooked pork salamis, nuggets and hot dogs; and ‘trans-fat’ product types included margarines, filled cookies, wafer cookies and ice creams (see Fig. 1 for examples). The pictures did not include the extrinsic proprieties of the products, such as the product’s name, brand or package.
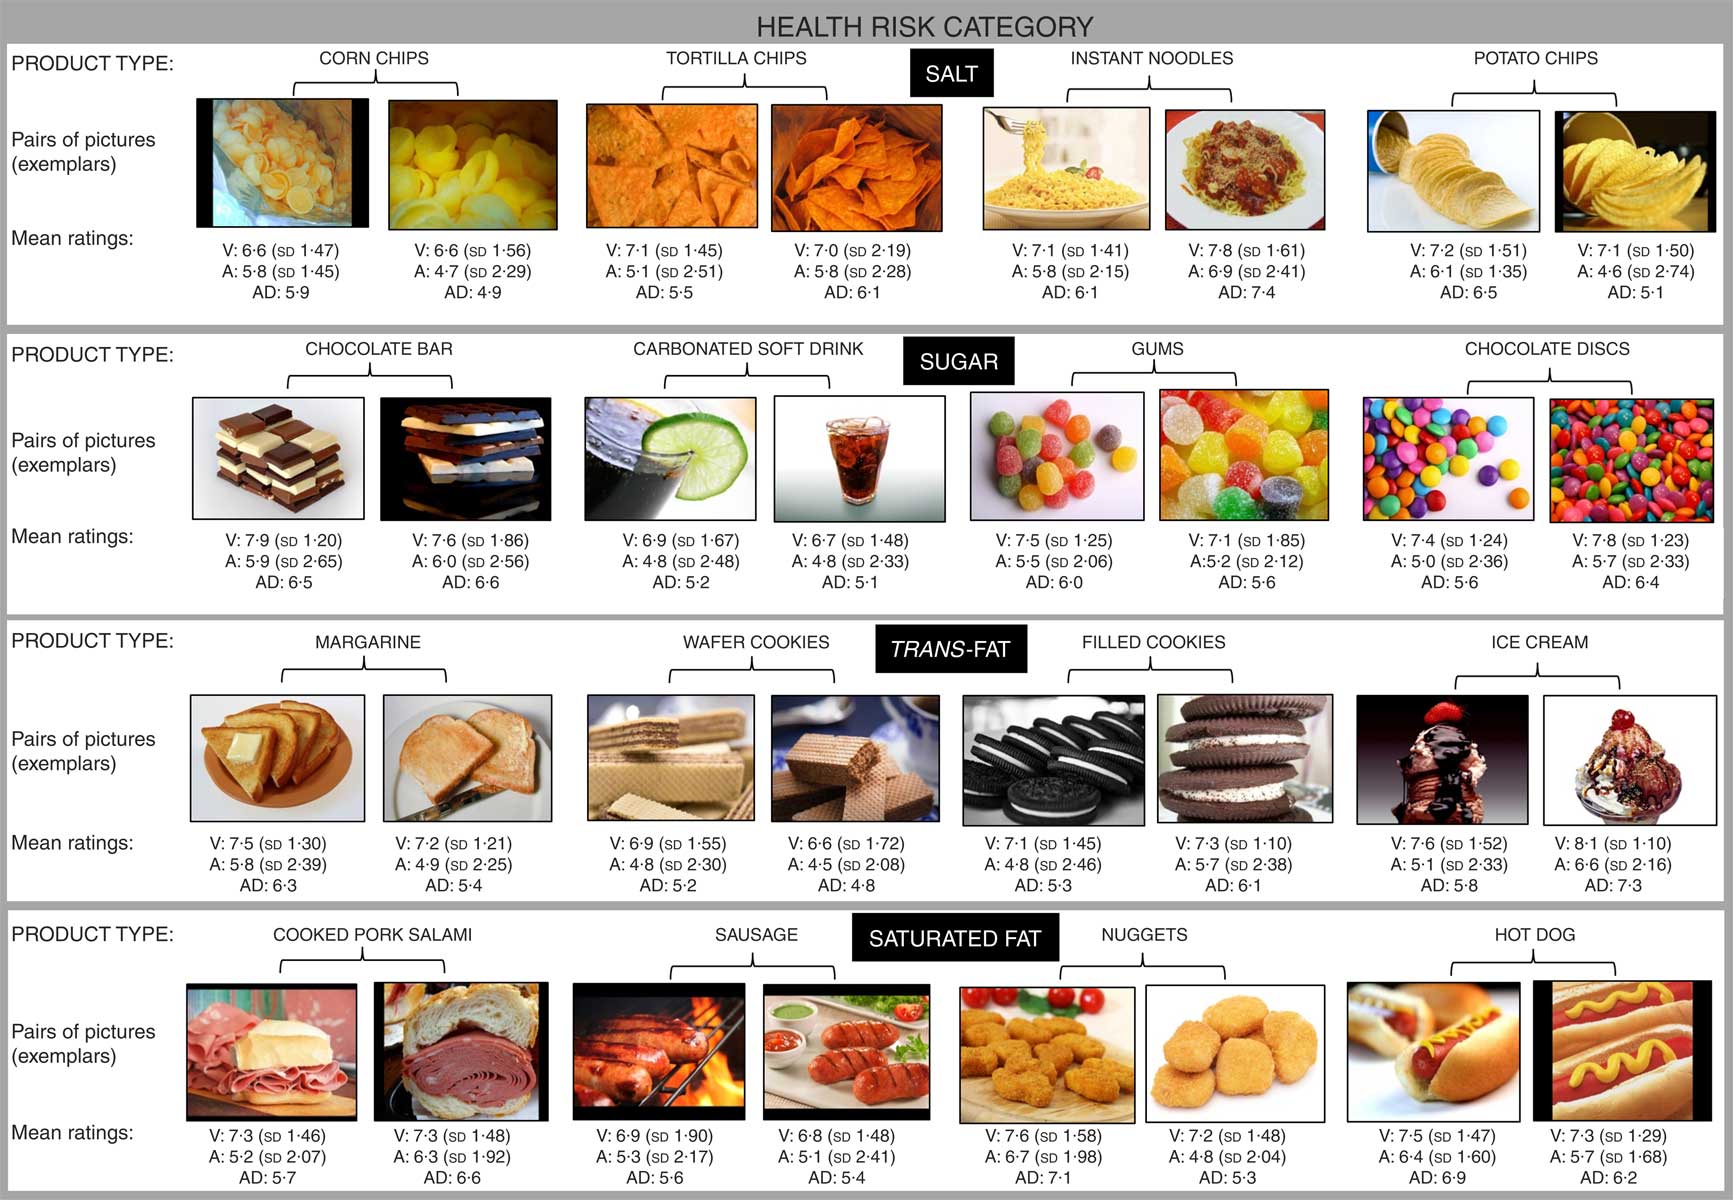
Fig. 1 (colour online) Pictures of ultra-processed food and drink products. Illustration of the thirty-two pictures of ultra-processed products selected from Study I. Each product type was represented with two picture exemplars (picture pair). The product types were divided into four health risk categories, i.e. salt, sugar, trans-fat and saturated fat. Each product type had a high content of at least the component (sugar, salt, trans-fat, saturated fat) that represents the category to which it belongs. The mean and sd values of the valence (V) and the arousal (A) and the vector magnitudes of the appetitive drive (AD) are noted below each picture
A set of four different pictures of the same ultra-processed product type was used to select two exemplars per product type that evoked the greatest pleasant feelings and that would then be tested in Study II. This procedure was applied to minimize the likelihood that appetitive drive differences between ultra-processed product types would be mostly influenced by aesthetic variability( Reference Michel, Velasco and Gatti 8 ), because aesthetics is the only aspect that varies across pictures of the same product.
To confirm that all selected products could be classified as ultra-processed products( 29 ), we estimated the exemplars’ ingredients and nutritional compositions based on the NOVA system, which considers the extent and purpose of the industrial food processing( Reference Monteiro, Levy and Claro 32 ). One researcher randomly selected samples of the products available on the market. The data extracted from the nutritional tables displayed on the packages included information about the ingredients and nutrition facts. For each product type, we computed the nutrient profile based on the Food Standards Agency (FSA) score( 47 ), considering the nutrient content for 100 g. The FSA score is calculated by awarding each nutrient/food component positive points (0–10) for energy (kJ), total sugar (g), saturated fatty acids (g) and sodium (mg), and negative points (0–5) for fruits, vegetables and nuts (%), fibre (g) and protein (g). The final score varies from −15 (very high nutritional quality) to +40 (very low nutritional quality). To test the accuracy of these scores, a second researcher estimated the FSA scores for a randomly selected sub-sample of the products. The FSA scores obtained by the two researchers were highly correlated (r=0·97, P<0·001).
International Affective Picture System
Seventy-two pictures from diverse emotional categories, balanced in terms of both hedonic valence and arousal, were selected from the IAPS( Reference Lang, Bradley and Cuthbert 24 ) and served as a control background for the target pictures (ultra-processed products). The IAPS emotional categories were neutral (objects, people, animals and plants), pleasant (from low to high arousal: happy families, babies and puppies, nature scenes, sports and erotica) and unpleasant (from low to high arousal: pollution, loss, disgusting, disease, violence and mutilated bodies). The use of different IAPS pictures as backgrounds, varying in valence and arousal, served as the affective bases of comparison during the evaluation of the target pictures, thus anchoring the emotional rating scales( Reference Miccoli, Delgado and Guerra 20 , Reference Lang, Bradley and Cuthbert 24 , Reference Paes, De Oliveira and Pereira 25 ). This standard procedure provides valid between-group ratings, as previously noted( Reference Miccoli, Delgado and Guerra 20 , Reference Paes, De Oliveira and Pereira 25 , Reference Bradley, Codispoti and Sabatinelli 26 , Reference Nascimento, Oliveira and Vieira a 48 ).
Apparatus
The ratings sessions were conducted in a dimly lit room with desks placed in rows in front of a slide projection screen. Each session had a maximum of forty participants. The desks were arranged in such a manner that the screen was perfectly visible to every participant. The stimuli were displayed with a projector connected to a microcomputer running the software E-prime 2.0 Professional (Psychology Software Tools, Inc., Sharpsburg, PA, USA), which controlled the timings of stimulus delivery.
Experimental design
Each rating session presented sixteen of the sixty-four target ultra-processed food pictures, in addition to the seventy-two non-target background pictures from the IAPS (the same background pictures were shown in every session). The sixteen target pictures comprised all health risk categories, with one exemplar of each product type within a category. To complete the assessment of the sixty-four ultra-processed product pictures, four different sets of sixteen pictures were prepared. Each set was presented in a different rating session to different participants. To prevent fatigue, we included only sixteen target pictures (instead of sixty-four) in each session.
Procedure
Upon arrival, the participants were asked to be seated and to read and sign the consent form if they were willing to participate in the study. Each participant then received a copy of the instructions and a rating booklet. Before the start of the experimental session, a didactic video explained the incoming task, and training was performed using nine extra pictures from the IAPS from diverse emotional categories. The session included eighty-eight trials (sixteen target pictures plus seventy-two non-target pictures). Each trial began with a preparation slide (‘Get ready to rate the next picture’) that lasted 3s. Then, the picture was presented for 6 s to be appraised. During the next 7s, the participants were asked to estimate how they felt about the picture by rating it along the dimensions of hedonic valence and arousal using the paper-and-pencil version of the SAM scales( Reference Bradley and Lang 23 ). The sequential order of the pictures’ presentation was pseudo-randomized, with the constraint that the emotional category (neutral, pleasant or unpleasant) could not be repeated more than three times consecutively. We did not provide the participants with any information about the sources of distinction between the control (IAPS) and experimental (ultra-processed products) pictures.
Data analysis
Valence and arousal ratings attributed to each emotion-laden picture were averaged across the participants. The affective space was represented in a Cartesian coordinate system. For better visualization, the ratings in the valence dimension were converted to numbers ranging from −4 (extremely unpleasant) to +4 (extremely pleasant), with 0 being neutral. In this way, valence becomes 0 at the midpoint of the transition from negative to positive ratings. This analysis was conducted to assess the consistency of a picture’s distribution in the bidimensional model( Reference Bradley and Lang 23 , Reference Bradley, Codispoti and Sabatinelli 26 , Reference Greenwald, Cook and Lang 27 ). According to this model, a set of pictures varying in valence and arousal ratings, if represented in a Cartesian coordinate system, is disposed in vectors that point in two directions, forming a ‘boomerang’ shape. The upper arm of the boomerang indexes appetitive (approach-like) motivation, while the lower arm indexes defensive (avoidance-like) motivation.
Spearman correlations were calculated to verify the similarity between the SAM ratings of the IAPS pictures in the present study and the SAM ratings from the original study with North American participants. This analysis tested whether the standardization method was effective for generating valid between-group affective ratings, as predicted.
Arousal and valence ratings were combined and transformed into a vector whose magnitude indicated the appetitive drive (approach-like motivation) towards each ultra-processed food picture. We jointly analysed valence and arousal, as previously described( Reference Nascimento, Oliveira and Vieira a 48 , Reference Volchan, David and Tavares 49 ).
Because the data exhibited a normal distribution (Shapiro–Wilk test), we calculated a Pearson correlation between the index of nutritional quality (the FSA score) and the appetitive drive evoked by the visualization of each type of ultra-processed product (sixteen product types). For this correlation, the appetitive drive was computed by each product’s type as the mean across the two most pleasant pictures of the same product.
The threshold for significance was set at P<0·05.
Results
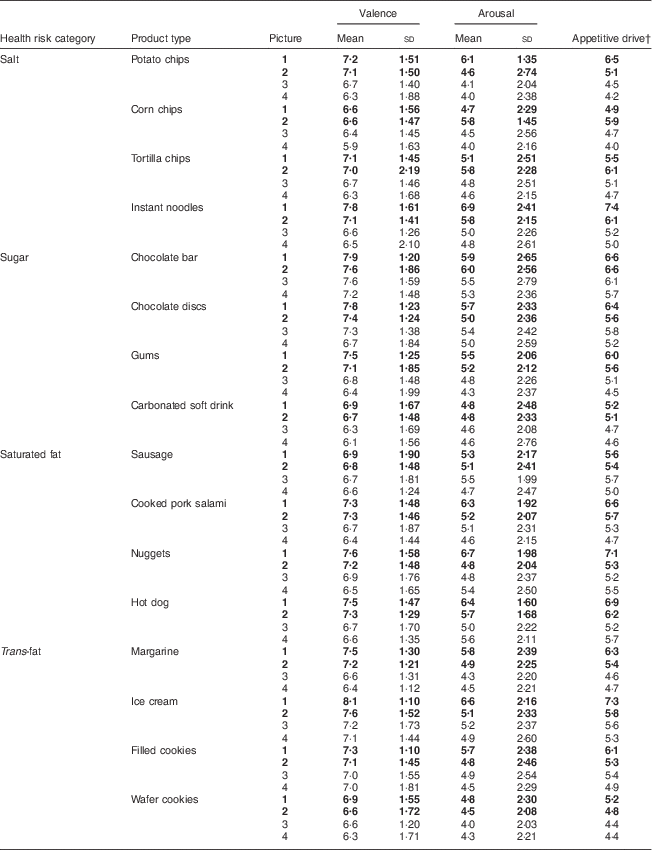
The mean valence and arousal ratings and the appetitive drive of the sixty-four pictures are presented in Table 1. Four exemplars are used to represent each product type. The product types correspond to the four health risk categories, i.e. salt, sugar, trans-fat and saturated fat. Each product type at least had a high content of the component (salt, sugar, trans-fat and saturated fat) that represents the category to which it belongs. The average mean valence and arousal ratings for the sixty-four pictures were 6·9 (sd=0·47, minimum=5·9, maximum=8·1) for valence and 5·1 for arousal (sd=0·66, minimum=4·0, maximum=6·9).
Table 1 Arousal and valence mean ratings and sd, and magnitude of the appetitive drive vector, for the sixty-four ultra-processed product pictures

The pictures selected for Study II are indicated in bold font.
† Vector magnitude.
The two most aesthetically pleasing pictures of the same product type (based on the highest mean valence) were selected for Study II. Therefore, thirty-two pictures were selected from the initial sixty-four. The thirty-two pictures of ultra-processed products selected are presented in Fig. 1.
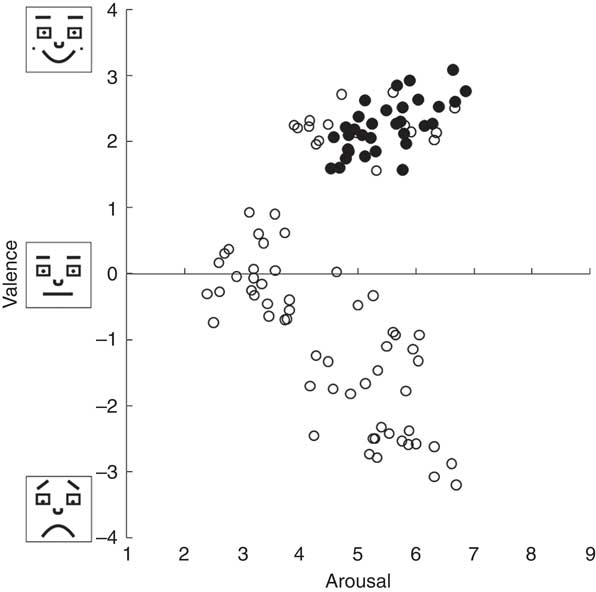
The ratings of valence and arousal for the emotion-laden pictures were plotted in a Cartesian plan as shown in Fig. 2. Each point in the Cartesian coordinates represents the mean valence on the y-axis and mean arousal on the x-axis for each IAPS or ultra-processed product picture. The correlation between the ratings of the IAPS pictures we collected and that reported for North Americans approached significance in both the hedonic valence (ρ=0·97, P<0·001) and emotional arousal (ρ=0·93, P<0·001) dimensions. As expected, the ratings were displayed in the Cartesian plan in vectors that point in two directions, representing a ‘boomerang’ shape( Reference Bradley and Lang 23 ). Appetitive (approach-like) motivation is represented in the upper arm of the boomerang, while the lower arm shows defensive (avoidance-like) motivation.

Fig. 2 Affective space. Illustration of the bidimensional space defined by SAM valence (y-axis) and arousal (x-axis) ratings. Each point in the plot represents an IAPS (control) picture (○) or a picture of an ultra-processed food or drink product (●) as a function of its mean hedonic valence and arousal ratings. (SAM, Self-Assessment Manikin; IAPS, International Affective Picture System)
Critically, the thirty-two selected pictures of ultra-processed products are displayed in the upper arm of the boomerang, in the appetitive space. Some pictures were classified as extremely arousing and pleasant and are positioned at the end of the upper appetitive arm of the space. The combination of the arousal and valence ratings into a vector revealed the appetitive drive evoked by each ultra-processed product picture. The greater the arousal and pleasant ratings values, the greater the appetitive drive.
All selected products fit into the ultra-processed product categories( 29 , Reference Monteiro, Levy and Claro 32 ). They comprised more than five ingredients, including additives and food industry ingredients. They were of low nutritional quality, far exceeding the suggested FSA score limit of ≥4 points for foods and ≥1 for drinks (see Table 2) relative to regulatory actions on advertising to children( 47 ). Notably, we observed a significant positive correlation between the appetitive drive evoked by the products and their nutritional quality indexed by the FSA score (r=0·52, P<0·05). The worse the ultra-processed products’ nutritional content was (i.e. the higher the number of kilojoules and amounts of sugar, saturated fat and salt, and the lack of fibre), the stronger the evoked appetitive drive responses were (Fig. 3).
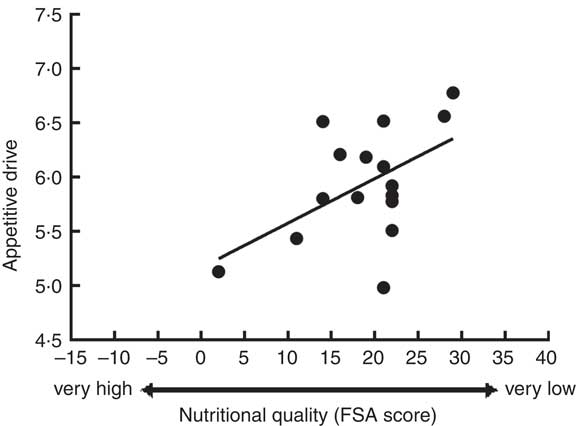
Fig. 3 The correlation between nutritional quality (FSA score) and appetitive drive. The worse the ultra-processed products’ nutritional content, the stronger the evoked emotional response (r=0·52, P<0·05). (FSA, Foods Standards Agency)
Table 2 Nutritional content and ingredients of each product type
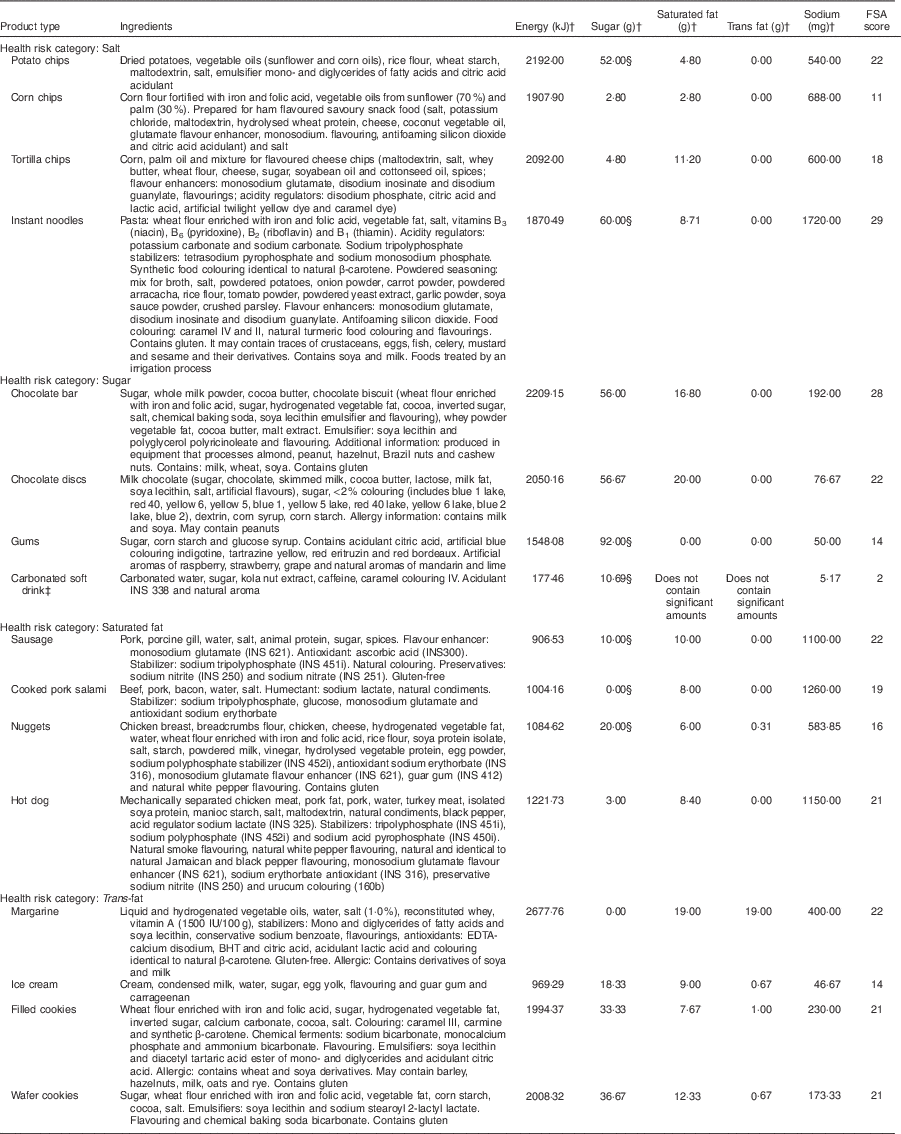
FSA, Food Standards Agency.
† Per 100 g.
‡ Per 100 ml.
§ Carbohydrate information is provided because sugar information was unavailable.
Discussion
The results of the first study provide two contributions. First, the pictures of ultra-processed products prompted an appetitive/attraction motivation and are positioned in the upper arm of the boomerang-shaped arousal–valence affective space. Furthermore, the higher the amount of saturated fat, salt and sugar (the FSA score), the stronger the evoked appetitive drive. This finding converges with the evidence that these components are addictive substances that prompt an uncontrolled approach-like behaviour in high amounts( Reference Ifland, Preuss and Marcus 50 ). In fact, emotional reactivity assessed through arousal and valence ratings has been linked to food craving ratings and addictive behaviours to other substances( Reference Miccoli, Delgado and Rodriguez-Ruiz 28 , Reference Khazaal, Zullino and Billieux 51 ). Therefore, higher amounts of sugar, fat and salt would likely negatively influence the public’s ability to cope with ultra-processed food and drink formulations. An open question is whether text warnings can help curb the powerful influence of these highly appetitive ultra-processed food cues. Study II addresses this issue.
Study II: Text warning effects on appetitive drive and intention to consume
Methods
Participants
Ninety-eight (fifty-two women, mean age 20·2 (sd 2·19) years) university student participants were recruited. The participants were naïve to the purpose of the experiments. The Research Ethics Committee of Fluminense Federal University (Brazil) approved the experiments and all participants provided informed consent before any experimental procedure was conducted.
Evaluative report: hedonic valence and arousal
The same instrument (SAM) used in Study I was used in Study II. The participants separately rated valence and arousal using the visual analogue scales described above. Ratings were obtained for each picture of ultra-processed food and drink products.
Intention to consume
The participants were also asked to rate their perceived intention to consume the ultra-processed food or drink product depicted by the picture on a 9-point Likert-type scale (0=none, 8=maximum).
Stimuli
Ultra-processed product pictures
The thirty-two pictures selected from Study I were used (see Fig. 1). Each product type (e.g. corn chips, chocolate bar, carbonated soft drink, wafer cookies) was represented by a pair of pictures displaying different images of the same product type. Therefore, each product type (n 16) was represented by two exemplars (e.g. wafer cookie 1 and wafer cookie 2), totalling thirty-two pictures. One exemplar of each pair was randomly allocated to one of two experimental sets. Each experimental set containing sixteen pictures of ultra-processed product pictures was preceded by either a warning or a control text.
The IAPS pictures were excluded from Study II, as the aim was to compare ultra-processed product picture ratings after exposure to a text warning and a control text rather than obtaining standardized affective ratings.
Text warnings and controls
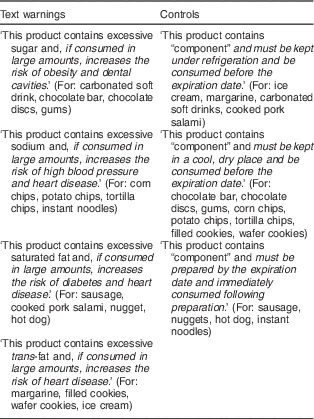
The text warnings and the ‘neutral’ controls are described in Table 3. Each text warning addressed a health risk category of products, namely the high content of a specific ‘component’: sugar (carbonated soft drink, chocolate bar, chocolate discs, gum), sodium (corn chips, potato chips, tortilla chips, instant noodles), saturated fat (sausage, cooked pork salami, nuggets, hot dog) and trans-fat (margarine, filled cookies, wafer cookies, ice cream). The text warnings were inspired by the norm from the Brazilian National Agency for Sanitary Surveillance that focuses on media advertising. The control texts matched the warning texts relative to the nutritional contents. However, the health risks associated with overconsumption were substituted with information about a product’s conservation and expiration date. The control and warning texts were centrally presented in white font on a green background (RGB:0.128.0) and occupied approximately 75 % of the screen dimensions.
Table 3 Text warnings and controls preceding the ultra-processed product pictures

“Component” refers to sugar, sodium, saturated fat or trans-fat.
Apparatus
The apparatus employed was the same as in Study I, except that each rating session included thirty-two ultra-processed product pictures. Each set of the sixteen types of ultra-processed product pictures was preceded by a warning or control text.
Procedure
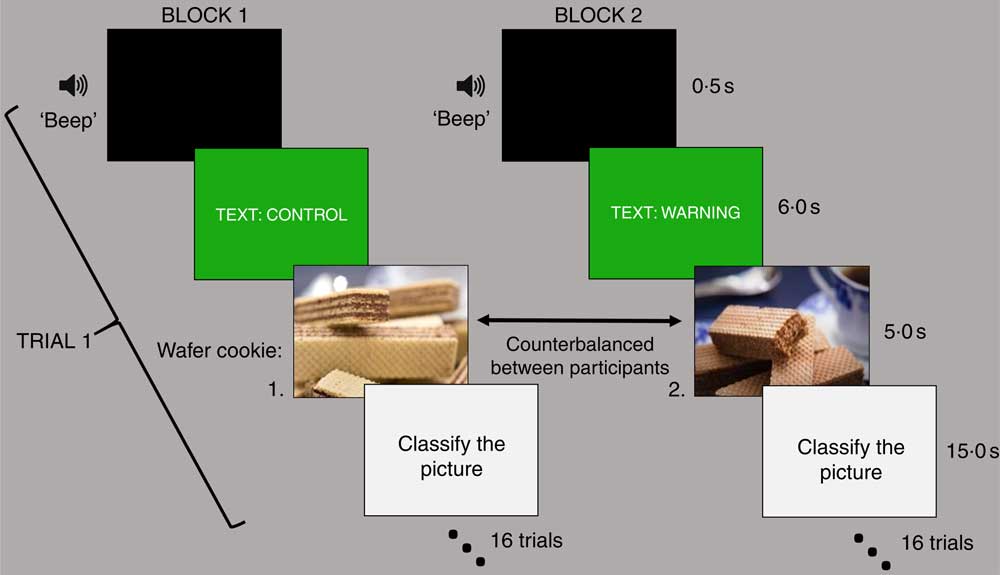
Before the start of the experimental session, a didactic video explained the incoming task, and four practice trials were performed. The instructions focused on the rating task regarding the ultra-processed product pictures. Therefore, no emphasis was given to the preceding texts. The experimental session included thirty-two trials divided into two blocks without an interval. The first block presented one set of the sixteen pictures of ultra-processed product types, and each picture presentation was preceded by a control text. The second block presented the other set of the sixteen pictures of ultra-processed product types, and each picture presentation was preceded by corresponding warning text. In each block, an experimental trial began with a ‘beep’ sound presented on a black screen for 500 ms. Then, text (control or warning) was presented for 6s. Immediately after the text offset, an ultra-processed product’s picture was presented and the participants attentively observed it for 5s. During the 15s following the picture offset, the participants should have rated the picture along hedonic valence and emotional arousal (the SAM dimensions) and the intention to consume (Fig. 4).

Fig. 4 (colour online) Schematic representation of the sequence of events in a trial. The experimental session was divided into two blocks. During each session sixteen pictures of ultra-processed products were preceded by control texts (block 1), and the other sixteen pictures from the same products were preceded by warning texts (block 2). The pictures presented for each condition (control or warning) were counterbalanced between the participants. Then, for each picture (the wafer cookie 1, for example), the mean ratings for the warning condition were obtained from one group of participants, and the ratings for the control condition were obtained from the other group of participants
Each set of the sixteen pictures of ultra-processed product types was preceded by a warning or a control text. The combination of the two sets of pictures and the two conditions (warning or control) was counterbalanced between the participants. The set of sixteen ultra-processed product pictures presented in block 1 (control) for a group of participants in one session was presented to another group in block 2 (warning) in another session, and vice versa. For instance, wafer cookie 1 was presented in the warning condition for one group of participants and in the control condition for another group of participants. Therefore, each picture (from the thirty-two pictures) was presented under both control and warning conditions for different groups of participants, guaranteeing that any warning effects would not be associated with a specific pool of pictures. Additionally, the group of participants presented with wafer cookie 1 in the warning condition, was presented with wafer cookie 2 in the control condition. The other group of participants was presented with the pictures in the inverse order (i.e. wafer cookie 1 was presented in the control case and wafer cookie 2 was presented in the warning case). Therefore, for each condition (warning or control), half of the pictures (n 16) received ratings from one group of participants and the other half (n 16) received ratings from the other group of participants. For analysis, the mean ratings of the thirty-two pictures were considered, thus encompassing the ratings from both groups of participants and guaranteeing that any warning effects would not be associated with a specific group of participants. Additionally, the groups did not differ in terms of hunger (t (96)=−0·30, P=0·76), eating habits (t (96)=−0·53, P=0·60), BMI (t (96)=−0·75, P=0·45) or nutritional knowledge (t (96)=0·10, P=0·92). The self-reported measures are described in detail in the online supplementary material, Supplemental File 1. The average self-reported BMI of the participants in Study II was 23·3 kg/m2 (sd=3·85, minimum=16·55, maximum=38·59).
Data analysis
Valence and arousal ratings attributed to each ultra-processed food picture (from the thirty-two pictures) were averaged across the participants by condition (warning or control). Each point in the Cartesian coordinates represents the mean valence on the y-axis and the mean arousal on the x-axis for each picture during the warning and control conditions. Then, we applied a joint analysis of valence and arousal, as in Study I, to obtain the vector of appetitive drive for each picture.
We averaged the ratings for each picture on the intention to consume scale and the appetitive drive scores for the warning and control conditions. Paired t tests were used to compare the mean ratings of the thirty-two ultra-processed product pictures obtained for the warning condition and the mean ratings of the same thirty-two ultra-processed product pictures obtained for the control condition. Separate analyses were conducted for appetitive drive measures and the intention to consume. The effect sizes were computed in terms of Cohen’s d.
The threshold for significance was set at P<0·05.
Results
The paired t test revealed that text warnings significantly reduced the appetitive drive (t (31)=2·25, P<0·05; Cohen’s d=0·33) and the intention to consume (t (31)=3·80, P<0·001; Cohen’s d=0·45) evoked by the ultra-processed product pictures compared with the control condition, in which these same ultra-processed pictures were preceded by control texts. These results are detailed in Table 4.
Table 4 Mean picture ratings and sd during control and warning conditions (Study II)

* Mean value was significantly different from that of the control: P<0·05.
The mean valence and mean arousal ratings for each ultra-processed food and drink product in Cartesian coordinates are depicted in Fig. 5. The mean ratings for each of the thirty-two pictures of ultra-processed products were distributed predominantly in the positive-valence domain when they were preceded by a control text. In the case of a warning text, the mean ratings of these same pictures moved towards a more central, ‘less emotional’ area of the bidimensional space (Fig. 5). The data presented in the online supplementary material, Supplemental File 2, show the vector magnitudes of the appetitive drive and the mean values of valence, arousal and intention to consume for the warning and control conditions for each picture of an ultra-processed product.
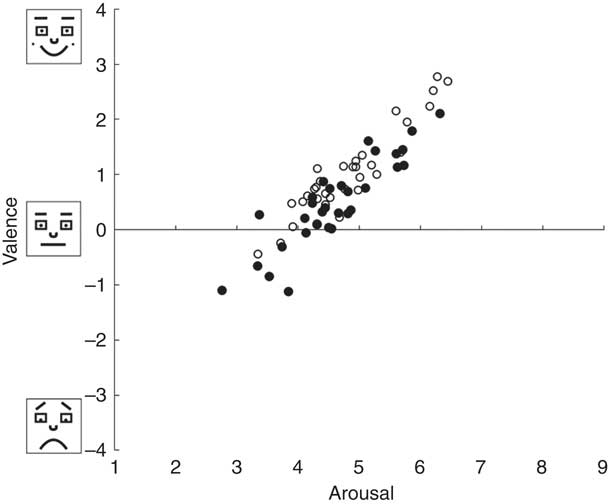
Fig. 5 Distribution of the pictures’ ratings during the warning and control conditions on a bidimensional affective space. Valence is depicted on the y-axis and arousal on the x-axis. Each point in the graph represents a picture. The pictures preceded by text warnings are shown as (●) and the same pictures preceded by control texts are shown as (○)
Discussion
Although the ultra-processed product pictures greatly impacted the participants, the text warnings were effective in reducing the appetitive drive and the intention to consume the corresponding products. Previous studies have shown that texts can change the emotional impact of emotion-laden pictures by activating cognitive reappraisal strategies( Reference Macnamara, Foti and Hajcak 52 – Reference Mocaiber, Sanchez and Pereira 54 ). A study using a brain electrical activity index of food pictures’ emotional impact demonstrated that thinking about the long-term consequences of eating high-energy foods modulated their emotional impact and the reported desire to consume them( Reference Meule, Kübler and Blechert 55 ). Considered together, the studies suggest that the use of text warnings may be effective for communicating the long-term consequences of ultra-processed products’ overconsumption, reducing appetitive drive and consumption predispositions towards them, possibly by activating cognitive regulation mechanisms.
General discussion
The main goal of the two studies was to assess the appetitive drives evoked by the visual cues of ultra-processed products and test whether text warnings would affect the appetitive drive and the reported intentions to consume these products. Study I estimated the appetitive drive elicited by ultra-processed product pictures using normative affective ratings. Ultra-processed product images prompted very strong emotional reactions that were associated with their nutrient profile. The results of Study II indicated that text warnings about the hazards of ultra-processed products’ overconsumption were effective in reducing the intention to consume and the appetitive drive evoked by pictures of these products.
Although the use of text warnings for ultra-processed products would address the problem of increasing obesity and poor health, studies that scientifically test the efficacy of this type of health warning have been overlooked. Recent evidence has shown that text warnings affect healthiness perception, purchase intention and preferences( Reference Roberto, Wong and Musicus 56 – Reference Bollard, Maubach and Walker 58 ). However, these articles focused exclusively on sugar-sweetened beverages. Furthermore, they did not assess the extent to which the emotional appetitive drive elicited by the product or packaging cues can counteract or moderate the impact of text warnings. Here, we showed that text warnings can superpose the appetitive drive elicited by ultra-processed product-related cues.
Determining the emotional reactivity elicited by visual cues of ultra-processed products is an important issue because food-evoked emotions affect consumers’ food choices( Reference Gutjar, Dalenberg and de Graaf 17 , Reference Dalenberg, Gutjar and Ter Horst 18 ) and, consequently, their diet and health. Products with more addictive components( Reference Ifland, Preuss and Marcus 50 ) evoked a stronger emotional appetitive drive. This result is useful because recognizing ultra-processed products as addictive would support obesity-related policies( Reference Moran, Musicus and Soo 46 ). This result also supports the argument that characteristics of visual food cues, such as their nutritional content, can evoke differential automatic appetitive motivational tendencies( Reference Bailey 59 ).
The present study had some limitations. Given that the original IAPS ratings were collected in university students, the study was conducted in this population to enable a more direct comparison between the ratings obtained here and those from the original IAPS study. However, the use of more diverse populations and a wider range of product types would be interesting in the future. Here, we also focused on the intrinsic sensory properties of the products. Further research is recommended to assess the influence of extrinsic properties, such as the brand or package( Reference Gutjar, Dalenberg and de Graaf 17 ). Finally, we cannot exclude a desirability response bias, in that the reported arousal, valence and intention to consume during the text warning condition may have been lower because it was the desirable answer. However, for each picture, the mean ratings during the warning condition were obtained from one group of participants, and the ratings during the control condition were obtained from another. This procedure has been described to diminish desirability tendencies( Reference Podsakoff, MacKenzie and Podsakoff 60 ). Measures of psychophysiological reactivity to emotional visual stimuli (e.g. heart rate, startle reflex, cerebral measures, skin conductance) could be applied in the future to provide a more objective and unbiased approach to track individuals’ appetitive motivational responses.
Despite these limitations, the study has a number of strengths. We provided timely new data on the emotional impact of ultra-processed product pictures through a gold-standard psychometric instrument to measure emotional reactions to visual stimuli( Reference Bradley and Lang 23 ). We contributed controlled experimental evidence regarding text warnings’ efficacy by answering the call for new scientific evidence on this topic( Reference Schillinger and Jacobson 61 ). Finally, the study also collected interdisciplinary scientific knowledge from specialists in neuroscience, experimental psychology, public health nutrition and marketing.
Conclusion
In conclusion, visual cues of ultra-processed food products evoked strong emotional responses and text warnings of the corresponding health risks minimized their appetitive drive and the intention to consume them. Overall, the data reported here implicate text warnings as a potential effective strategy for public health policies that target chronic disease prevention and health promotion. The combination of these findings with new experimental and observational studies would amass evidence to support the use of text warnings in public health.
Acknowledgements
Acknowledgements: The authors would like to thank Júlia de Souza Vale for her help with the data collection. This article is related to the PhD doctoral thesis of L.K. Financial support: This work was supported by Coordenação de Aperfeiçoamento de Pessoal de Nível Superior (CAPES), Conselho Nacional de Desenvolvimento Científico e Tecnológico (CNPQ), Fundação de Amparo à Pesquisa do Estado do Rio de Janeiro (FAPERJ) and Fundação do Câncer. CAPES, CNPQ, FAPERJ and Fundação do Câncer had no role in the design, analysis or writing of this article. Conflict of interest: There were no conflicts of interests. Authorship: I.A.D., L.K., F.B., E.V., F.S.G., E.B.A., R.L.A., L.O. and M.G.P. conceptualized and designed the experiments. I.A.D., L.K., F.B., J.R.A. and R.L.A. performed the experiments. I.A.D. and L.K. drafted the manuscript. I.A.D., J.M.O., F.B., E.V., M.G.P., L.O., F.S.G., S.G., M.C.F.-S. and E.B.A. contributed for analysis and materials tools. I.A.D., F.B., L.K. and E.V. analysed the data. All authors reviewed draft versions of the manuscript for salient intellectual content and provided suggestions and critical feedback. All authors have made a significant contribution to this manuscript and approved the final version. Ethics of human subject participation: The study was approved by the local research ethics committee (approval number: UFF/CMM/HUAP nº 352/11; CAAE:0369.0.258.258-11).
Supplementary material
To view supplementary material for this article, please visit https://doi.org/10.1017/S1368980017003263


